


Partly hidden beneath the complexities of N* and an attack on the supposedly individualist presumptions of ethnic fractionalization measures, a simple and valuable question lies implicit in Cederman and Girardin's (2007) article (henceforth, CG). Are countries at greater risk of civil war when the state is controlled by an ethnic minority?
Scholars of nationalism have long suggested that this might be the case. In a nationalist age, plurality groups that are excluded from power may feel especially aggrieved. As Gellner (1983, 1) put it,
there is one particular form of the violation of the nationalist principle to which nationalist sentiment is quite particularly sensitive: if the rulers of the political unit belong to a nation other than that of the majority of the ruled, this, for nationalists, constitutes a quite outstandingly intolerable breach of political propriety.
We examine this issue using new data on the ethnicity of the top political leader for 161 countries in all regions of the world, observed since 1945.1
Kasara, who deserves primary credit for these data, completely recoded an initial effort that we had begun several years ago with the assistance of Nikolay Marinov.
Our results do not change if we use CG's N* index calculated using our data on ethnic group of the head of state. A reanalysis of CG's data shows that in their more limited sample, only four countries are coded as having had a minority “ethnic group in power,” three of which have suffered civil wars. We show that the apparent impact of the N* index in CG's sample comes entirely from the experience of these three countries. Looking case by case, there is some limited support for the notion that ethnic minority rule fostered internal conflict, but it is not unambiguous even in these three cases. In addition, a plausible recoding of just one country—changing Syria from CG's coding of shared Sunni–Alawite control to Alawite dominance—causes the estimate of N*'s impact to nearly vanish.
ETHNOLINGUISTIC FRACTIONALIZATION AND OTHER MEASURES OF ETHNIC DEMOGRAPHY
We agree that it is natural to wonder whether political dominance of an ethnic minority raises civil war risks. But we also believe that it is interesting and important to ask, as we did in Fearon and Laitin (2003a), whether civil war is more likely in more ethnically diverse countries. It is important because it is commonly supposed to be so in the media and by politicians, and because much work by political scientists and sociologists on ethnic politics has presumed or argued that “plural societies” are more prone to intense internal conflict (e.g., Horowitz 1985; Rabushka and Shepsle 1972). Gellner (1983) himself observes that the nationalist principle is violated when there are multiple “potential nations” within state boundaries. He says that multiple groups imply that “a territorial political unit can only become ethnically homogeneous, in such cases, if it either kills, or expels, or assimilates all nonnationals. Their unwillingness to suffer such fates may make the peaceful implementation of the nationalist principle difficult” (2). This logic suggests that the more ethnic groups, the more unsatisfied and conflicting nationalist sentiments, and the greater the risk of internal conflict.
An ethnolinguistic fractionalization (ELF) index is just one way of measuring ethnic diversity. It has advantages over, say, counting groups or using the size of the largest group. ELF increases with the number of groups holding the distribution of sizes constant, and it increases as one changes the distribution toward greater equality among the groups. Both are desirable properties in a measure of diversity. If one simply counts the number of groups, then a country with group shares (.97, .01, .01, .01) looks as diverse as a country with (.25, .25, .25, .25), which seems wrong relative to intuitions about what ethnic diversity means. (The ELF scores are .06 and .75, respectively.)
But there are other defensible measures of ethnic or religious diversity at the country level, including the size of the largest group, a count of the number of groups above some threshold, or the “effective number of groups” (1/(1-ELF)). One can also make arguments about specific size distributions, such as the idea that a country with a majority ethnic group and a large minority group may be particularly prone to violence (e.g., Horowitz 1985, 36–41). We considered these several measures and others for the analysis in Fearon and Laitin (2003a; see also Fearon and Laitin 2003b). In addition we used nonparametric methods in case the linearity assumptions of the regression model might be obscuring some less linear pattern. We did not view ELF as representing any particular argument about why ethnic diversity would cause greater civil war risk—much less the specific “individualist” argument proposed by CG—but rather as a measure helpful for empirically assessing any argument that proposes a positive relationship between ethnic diversity and civil war risk, “individualist” or not.
In their conclusion, CG assert that by using ELF, we “tend to assume that violence is primarily a reflection of individual, as opposed to group-level dynamics” (2007, 182). It seems a bit unfair for CG to make up an “individualist” story to rationalize ELF and then attribute it to us, simply because we use the measure! In any event, if a “group-level” rationale for ELF is wanted, it is not difficult to construct one. Suppose that major conflicts occur according to a Poisson process, and that the rate at which they emerge between any two distinct groups i and jis proportional to pipj, where these are their respective population proportions. (Thus, violent conflict is assumed more likely the larger the two groups and the more equal they are.) Then the total rate is proportional to
ELF, since ELF
. No assumption about individual-level interactions driving conflict is needed here; the groups may be conceived as unitary actors, as in CG's arguments for N*.
ETHNIC GROUPS AND CONTROL OF THE STATE
The main obstacle to answering the question posed at the outset is how to code “control” of the state by different ethnic groups across a large number of countries. CG say that they “consider a group, or a coalition of groups, to be in power if their leaders serve (at least intermittently) in senior governmental positions, especially within the cabinet” (2007, 178). It is not clear whether they examined ethnicities of cabinet members, however, or indeed just what the operational procedure was. Their paragraph on coding says that “To determine if a group was an EGIP, we relied on Heger and Salehyan's (2005) dataset of leader's ethnic affiliations, based on information from a leader data [set] collected by Goemans, Chiozza, Gleditsch, and Choung (2005)” (2007, 178), taking additional data from the Minorities at Risk project and the CIA World Fact book.
Whatever their exact procedures and rules, in practice CG's choice for the “Ethnic Group in Power” (EGIP) is the plurality ethnic group in a large majority of the Eurasia and North Africa countries in their sample—74 out of 89, or 83%. Only four countries are coded as having a minority EGIP (Iraq, Jordan, United Arab Emirates, and Lebanon). The biggest departure of EGIP from the plurality group share comes from CG's decision to code 11 countries as having a coalition of EGIPs, which they treat as equivalent to a unified ethnic group with population share equal to the sum of the component groups' shares (Belarus, Belgium, Czechoslovakia, Finland, Pakistan, Spain, Switzerland, Syria, United Kingdom, Ukraine, and Yugoslavia). For N*, this decision makes such cases equivalent to nearly homogenous countries in which the plurality group controls the state. N* assigns these cases essentially zero probability of conflict.
This coding procedure folds together two issues that might better be kept separate. First, are countries with a minority EGIP more civil war prone? This is the question most directly implied by Gellner's and CG's theoretical arguments. Unfortunately, because there are only four such cases in their sample (by CG's coding), there is probably not enough evidence here for establishing any robust empirical tendency or pattern.
Second, are multiethnic countries that succeed in sharing state power among groups at lower risk of civil war? It would not be too surprising if the answer were “yes,” because this is not far from asking “is civil war less likely in a country in which the major ethnic groups have demonstrated an ability to get along?”2
It seems likely that if Lebanon had not had the civil war that began in 1975, it would have been coded as a case of successful power sharing rather than as Maronite dominance. And perhaps if Syria had had a civil war, there would have been a stronger temptation to see it as a case of Alawite state control (which is how we would argue for coding it in any event), rather than as a coalition of Alawis and Sunnis.
Using CG's codings, civil wars broke out in 2.60% (5/192) of the country years with a minority EGIP, versus 1.80% (51/2837) for plurality EGIPs and .99% (5/503) for coalition EGIP cases. Although this pattern is consistent with the hypotheses that minority rule raises civil war risk, and that countries with some measure of ethnic power-sharing are less civil war prone, there is not much evidence here. A chi-square test fails to reject the null hypothesis of no association (p=.28). Again, there are only four minority EGIP countries in CG's sample, two of which had two civil wars (Lebanon and Iraq), and one (Jordan) which had one, using Fearon and Laitin's (2003a) civil war codings.
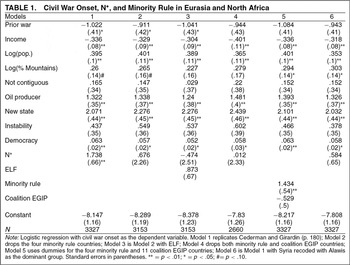
Table 1 reexamines CG's logit analysis of the country-year data for their Eurasia and North African subsample. Model 1 replicates their Table 3 (Model 2), which finds a positive effect of their N* measure in the Eurasia/North Africa sample.3
There are very slight differences in the coefficients, which must stem from very minor differences in our N* calculations. We can replicate their Model 1, which does not include N*, exactly.

Model 4 drops both minority and coalition EGIP countries, allowing us to distinguish between the effect of N* that comes from it being (essentially) a nonlinear transformation of the plurality group share and the effect of N* coming from the fact that in some countries the plurality group does not control the state. Note that N*'s estimated coefficient is now essentially zero (adding ELF sends the estimate for N* to −1.36). So there appears to be little to choose from between N* and ELF when we consider only countries with plurality EGIPs.
Model 5 drops N* and instead uses dummies for whether the country had a minority EGIP and whether the country had a coalition EGIP as coded by CG (the omitted category is countries with a plurality EGIP). It shows a positive effect on civil war risk for the four minority EGIPs, and a negative but statistically insignificant effect for the 11 coalition EGIPs.
Overall, it is clear that the “punch” of N* comes entirely from its marking off the four minority EGIP countries, three of which are coded as having had civil wars in this period (the bivariate correlation between N* and a dummy marking these four countries is quite high, at .89). It is a bit disconcerting that including either Iraq or Lebanon, while omitting the other three minority EGIP countries, suffices to produce “statistical significance” for N* in this sample. Worse, Model 6 shows that when we recode Syria as having a minority EGIP, which seems at least as plausible as CG's coding,4
CG code Syria as dominated by a Sunni–Alawite coalition, although on page 178 of their article, they say that Syria was Druze–Alawite dominated from 1963 to 1970. Because Syria in fact had Sunni rulers from 1963 to 1970 and was ruled by the Alawite Assads after 1970, it may be that Syria is coded in error by CG's own rules. CG also say that Iraq was not Sunni dominated for the whole of the period in 1945–1958 (page 178), although this was the period of the (Sunni) Hashemite monarchy in Iraq.
In our view this evidence provides no support for the N* formulation per se, and weak support for the notion that states dominated by ethnic minorities have higher civil war risk. The evidence is weak because it comes from the experience of just four countries, and Lebanon and Iraq in particular. Prior to its political disintegration, Lebanon could have been coded as a country with a coalition EGIP quite easily. Iraq has two civil wars coded in Fearon and Laitin's (2003a) data, neither of which involved the majority Shias rebelling against the dominant minority Sunni regime (although arguably there should be such a civil war coded after the first Gulf War). The Kurds rebelled under Sunni minority rule in Iraq, but they are a minority as well. Further, Kurds have rebelled in neighboring Turkey and Iran where plurality ethnic groups control government. They have not rebelled in Syria where there is, arguably, a minority EGIP. The 1971 war in Jordan might be linked with Palestinian unhappiness with the Hashemite regime's dominance, although regional political struggles were also very important. So the evidence is suggestive but certainly not a robust generalization.
LEADER ETHNICITY AND CIVIL WAR RISK IN A LARGER SET OF COUNTRIES
Most political scientists would probably say that an ethnic group “controls” or “dominates” a state or government to the extent that its members monopolize major government offices and also determine significant policies. In principle one could try to operationalize this concept by coding the ethnic composition of cabinets or all state offices for a large sample of countries. In practice this would be a difficult enterprise, especially for highly diverse subSaharan Africa. Moreover, because the real power of different ministries and other offices can vary enormously across countries and time, one would face difficult aggregation problems even if the data were available.
A compelling alternative is to use the ethnicity of the head of state as an indicator of ethnic influence or control. It has some obvious problems, but these can be managed and the compensating advantages are great.
The main problem is illustrated by the case of Canada, which has had three French Quebecois as prime ministers since 1945. To say that the French dominated or controlled the Canadian state in these periods seems wrong. The same issue arises in a number of other cases, mainly in Europe: for example, a Scottish PM in Britain (Douglas-Home, 1963), the Galician Franco in Spain, the Georgian Stalin in the USSR, Slovak General Secretaries in Czechoslovakia, and rotating presidencies in Switzerland and post-Tito communist Yugoslavia. However, if we are trying to tap the idea of “state control” that CG and other analysts of ethnic politics seem to have in mind, we can drop such countries from the sample, or recode them on an ad hoc basis as “majority dominated.”
There are several significant advantages to using leader ethnicity as an indicator. First, we have been able to code it for more than 160 countries for the period 1945 to 1999. Second, problematic cases of the type just mentioned appear to be unusual. In general, leader ethnicity does an excellent job of picking out the group locally regarded as politically most powerful. In sub-Saharan Africa, for example, it is often thought that the president's ethnic group is the most favored and politically dominant, even in cases where many government bureaucrats come from a different group. Comparing this indicator with CG's EGIP codings for the countries in their Eurasia/North Africa sample, we find very few differences. Of the 835 leaders in the countries of CG's sample, less than 5% come from an ethnic group different from a group CG identified as “in power” in that country. This suggests that the indicator is worth considering for the larger sample beyond these regions.
A third important advantage of using leader ethnicity is that the measure varies over time within a good number of countries, allowing us to examine whether civil wars tend to begin with transitions to minority leaders. By contrast, CG's codings assume that the “ethnic group in power” never changes, which is implausible for a number of their countries and would be an untenable assumption for sub-Saharan Africa. A fourth advantage is that although the real significance of different ministries varies across countries and over time, the question of who gets to be the head of state is always critical.5
Goemans et al. (2005, 1) attempt to code the “effective leader,” so that, for example, a paramount “strong man” is coded even if he does not hold the highest formal office. They note that this is rare in their data. See Goemans et al. 2005 for a discussion of their criteria for identifying the head of state (the main issue concerns whether to code the prime minister or the president in certain systems).
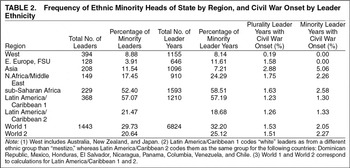
Using Goemans et al.'s (2005) list of heads of state and the ethnic categories from Fearon (2003), we coded leader ethnicity for 161 countries for the period from 1945 to 1999. Table 2 provides summary statistics on the prevalence of leaders from minority ethnic groups. Worldwide, between 20% and 30% of heads of state have been from an ethnic group other than the plurality group for the period from 1945 to 1999, depending on whether we treat “white” and “mestizo” as the same or different groups in a number of Latin American countries.6
How one treats these cases depends on the exact formulation of the hypothesis about ethnic minority rule. If the hypothesis is that rule by an ethnic minority defined in terms of a socially relevant ethnic distinction should associate with higher civil war risk, then we should separate white and mestizo in many of these cases. If the hypothesis is that ethnic minority rule matters only in countries where there is a political salience or importance attached to a given minority, then we might combine white and mestizo for these cases. The latter hypothesis tends more towards tautology, though it is still an interesting question. Another problem is that the white/mestizo distinction is often fuzzy or hard to get information about, so we have less confidence in these than in most other ethnic attributions.

Table 2 also compares rates of civil war outbreak by whether the leader was from the plurality group or an ethnic minority. Overall, civil war has broken out at a slightly higher rate when the leader came from an ethnic minority (2.05% or 2.27% vs. 1.5% per year, depending on how we code the Latin America cases). This is also true within regions except for Western and Eastern Europe and the former Soviet Union. However, using either a chi-squared or a simple t test on differences of means, the raw difference for the whole sample is not statistically significant under the “white different from mestizo” coding, or just barely so under the “white same as mestizo” coding (at p=.05).
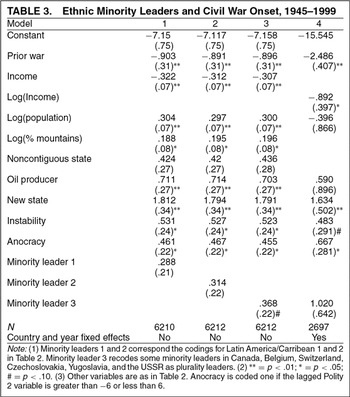
Because ethnic minority leaders are clearly more common in poorer countries—as seen in the higher proportions in sub-Saharan Africa—bivariate comparisons may be misleading. Table 3 displays the results of a multivariate logit analysis using the core specification and data from Fearon and Laitin 2003a, but adding a dummy variable marking country years in which the leader came from a group other than the plurality group. The first model uses the coding with “white different from mestizo” for Latin America; the second uses “white same as mestizo.” For the third model, in addition to using “white same as mestizo,” we recode the countries Canada, Belgium, Spain, Switzerland, Czechoslovakia, Yugoslavia, and the USSR so that they have no minority leaders, in order to see if some implausible attributions of minority dominance in these cases are affecting the results.7
Finland and the UK each had a “minority” leader for 1 year of the sample period (Douglas-Home in Britain in 1963 and Mannerheim in Finland in 1945). We recode these cases as well for this regression.

Having a leader from an ethnic minority is positively associated with civil war onset in Models 1–3, but the estimates are small in substantive terms in addition to being quite uncertain. In Models 1 and 2 they translate to about 34% greater annual odds of civil war outbreak in minority-led country years, which is a bit more than half the impact of anocracy, the next most “important” dichotomous variable in the model. In Model 3, with the most favorable coding for minority leader, odds of civil war outbreak are estimated to be 44% greater per year under minority leaders, just barely significant at the 10% level. The estimates are also fragile in the sense that adding region dummies reduces their size and significance considerably (while leaving the other variables relatively unaffected).
Perhaps the simple indicator for whether the leader is from a minority group is too crude a measure of plurality group nationalist resentment. We considered alternative measures, such as the difference between plurality and leader group sizes, the raw size of the leader's group, and N* calculated using our leader ethnicity data for the EGIP. The results are always worse for these variables than for the dummy variable indicating minority leader.
For countries that had a civil war and controlling for unmeasured country-specific factors (Table 3, Model 4), the estimated coefficient for ethnic minority rule is much larger. Substantively, it implies that the odds of civil war onset were about 2.75 times greater each year under the minority leader, other things equal. The estimate is again fairly uncertain, and the results are rather unstable (depending on specification). This is typical of fixed-effects logit models for rare events; there simply isn't much within-country variation in the dependent variable available to identify effects. In the case at hand, we find no association at all for ethnic minority rule within sub-Saharan Africa or Latin America using the fixed-effects approach, and a strong association in Eurasia and North Africa that depends heavily on a small number of cases.8
The same three countries discussed above, plus Afghanistan in 1992 (Tajik leader Rabbani) and Pakistan, which has three wars coded as beginning under the Bhuttos (Sindhis). As it happens, CG code Sindhis as an ethnic group in power in Pakistan. The results are also sensitive to whether the indicator for ethnic minority rule is lagged or not, which is a bit worrisome because some minority leaders may have come to power after the war began.
What about “ethnic” civil wars? The pattern proves to be similar: hardly any association between minority rule and ethnic civil war within Africa or Latin America, and a somewhat stronger association outside of these regions that depends on a small number of cases (for the regression results and discussion, see Fearon, Kasara, and Laitin 2006).
CONCLUSION
Countries with heads of state from a minority ethnic group have been marginally more likely to have civil wars begin, although the association is weak and uncertain. It appears to be stronger outside of sub-Saharan Africa and Latin America, but even in Eurasia and North Africa the association depends heavily on the experience of a small number of countries.
To this point both we and CG have been discussing partial correlations rather than causal effects. To believe that the coefficients on N* or “minority leader” provide decent estimates of causal effect in CG's or our statistical models, one has to believe that these variables are uncorrelated with other, unmeasured determinants of civil war risk. This is implausible in the case at hand.
The mechanism that CG, Gellner, and others have in mind is that minority political dominance causes plurality group resentment and perhaps greater perception of opportunity to take power. But there are other causes of the level of ethnic antagonism in a country, and these may affect the likelihood that minorities serve in high political offices. Thus, minorities may be more likely to hold power where “background” levels of ethnic nationalist sentiment are lower—Switzerland versus Sri Lanka, for example.9
Note, however, that high levels of antagonism can also increase a minority group's motivation to gain or hold on to political power, as in Burundi and Rwanda. In Syria, Alawites fear that moves towards democracy may increase the risk of anti-Alawite pogroms.
There are two ways to deal with this problem. One is to try to control for other determinants of nationalist antagonism, hoping that the variation that remains (if any) is caused by minority dominance. CG's and our ad hoc treatments of ethnic power-sharing cases like Switzerland can be interpreted in this light. The fixed-effects approach goes further in the same direction, controlling for each country's unobserved level of ethnic antagonism in a fixed effect. Unfortunately, the magnitude of the impact of minority dominance probably depends on the level of “background” ethnic antagonism, in which case the fixed-effect estimates may also be misleading.10
That is, with fixed effects we are assuming that the impact of minority rule on civil war risk is the same in Switzerland as in Sri Lanka, once we have controlled for the underlying level of ethnic antagonism not attributable to who is in power. But surely greater ethnic antagonisms make people more sensitive to who rules.
The second approach would be to find a factor correlated with ethnic minority rule but uncorrelated with underlying levels of nationalist sentiment or other determinants of civil war risk (an “instrument”). This seems nearly impossible, although some progress might be made by looking at leaders who came to power “accidentally,” say via a military coup or a jumbled succession after the death of a dictator.11
For example, it may be that the first military coup in newly independent countries tended to bring ethnic minorities to power, due to British and French colonial ethnic policies concerning the army. Jones and Olken (2005) use natural deaths by leaders as an instrument to identify the impact of leadership on economic growth.
In sum, more ethnically diverse countries show no strong tendency to have a greater risk of civil wars, if one compares states at similar levels of economic development (Fearon and Laitin 2003a). The same appears true of countries with government controlled by minority ethnic groups, although there is suggestive-but-thin evidence for a relationship outside of sub-Saharan Africa and Latin America, and there are difficult questions of endogeneity that could be leading us to underestimate the causal effect in general. Regardless, it is not likely that ethnic minority dominance explains much variance in civil war propensities. If in truth it does have a significant causal impact, minority dominance must be quite rare in those countries where it could actually cause trouble.
We applaud attempts to explore how different ethnic configurations might relate to civil war risk, and we agree with CG that it makes sense to consider whether ethnic minority dominance is a major risk factor. Both our analysis of data for all regions and our reanalysis of CG's data suggest, however, that it is probably not.



Comments
No Comments have been published for this article.