I. INTRODUCTION
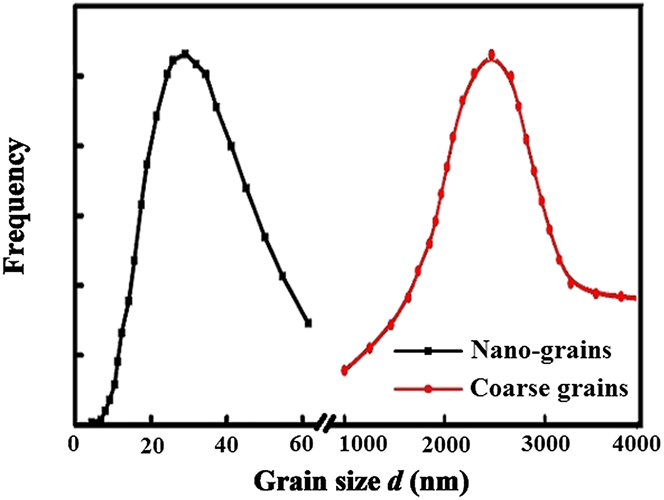
Nanocrystalline (NC) materials have attracted great interest in recent years owing to their excellent mechanical and special physical properties.Reference Meyers, Mishra and Benson1,Reference Li and Soh2 Generally speaking, NC materials possess high strength and low ductility compared with their coarse-grained conventional counterparts.Reference Koch, Morris, Lu and Inoue3–Reference Sharon, Padilla and Boyce5 The deficiency of low ductility and the associated loss of toughness in some materials stop their engineering applications. Therefore, various strategies have been proposed to improve the ductility of NC materials for achieving a better balance of strength and ductility. On the basis of engineering practice and theoretical experience, a composite structure is always built to enhance the ductility of NC materials.Reference He, Eckert, Loser and Schultz6–Reference Han, Lavernia and Mohamed10 One efficient approach is to develop a bimodal grain size distribution in which NC grains provide high strength, whereas coarse grains can enhance ductility.Reference Wang, Chen, Zhou and Ma11–Reference Vinogradov, Hashimoto, Patlan and Kitagawa14 Grain size statistical distribution for bimodal structure is shown in Fig. 1.
Schematics of grain size statistical distribution for bimodal structure.

In the last two decades, there are many experimental studies focusing on the mechanical properties of bimodal nanocrystalline (BNC) materials. Most of the experimental observations have revealed that nanoscale voids were observed in the NC grain phase, while the necking was observed in coarse grains, and the shear localization dominated the constitutive and fracture behaviors of such materials. For example, Fan et al.Reference Fan, Choo, Liaw and Lavernia15 studied the plastic deformation and fracture of ultrafine-grained (UFG) Al–Mg alloys with a bimodal grain size distribution. It was found that the plastic deformation of the UFG Al–Mg alloys with a bimodal microstructure was highly localized. The fracture of the alloys was attributed to shear localization under the compressive tests and to a combination of shear localization, cavitation, and necking under the tensile tests. However, the grain size of their UFG matrix did not reach the nanoscale. Han et al.Reference Han, Huang, Zhu and Lavernia16 investigated the strain rate sensitivity and the strain rate effect on the ductility of bimodal 5083 Al alloys. The mechanical responses of several bimodal 5083 Al alloys with different fractions of coarse grains were studied at different strain rates. It was found that the failure strain increases with the decreasing of strain rate for plastic deformation when the strain rate is less than 10−1 s−1. Magee et al.Reference Magee, Ladani, Topping and Lavernia17 studied the tensile test parameter effects on the mechanical properties of a bimodal Al–Mg alloy. It was found that decreasing the specimen thickness and strain rate served to increase both the strength and ductility of the material, and increasing the coarse grain (CG) ratio would lead to increase ductility and slightly reduce strength. Long et al.Reference Long, Wang, Zhang and Huang18 investigated the ductility in the bimodal UFG Ti–6Al–4V alloy fabricated by high energy ball milling and spark plasma sintering. It was found that the high strength primarily results from the contribution of ultrafine grains, while the enhanced ductility may be attributed to the improved strain hardening capability by the presence of coarse grains and occurrence of crack blunting and deflecting.
Although there have been numerous experimental studies that have provided insight into the constitutive behavior of BNC materials, it scarcely builds explicit and universally theoretical models to take quantitative analysis. For instance, Ovid'ko and SheinermanReference Ovid'ko and Sheinerman19 built a theoretical model that describes the generation of nanoscale cracks of BNC materials, in the frame work of their model, cracks are generated in the stress field of interfacial disclination dipoles formed at the interfaces between larger grains and NC matrix during plastic deformation. But, it did not consider the critical stress intensity factors. Zhu et al.Reference Zhu, Shi, Lu and Lu20,Reference Zhu and Lu21 built two statistical models to study the strength and ductility of BNC materials. The calculating results show that nano/microcracks do not lead to catastrophic failure, instead, they induce the back stress for strain hardening in BNC materials. However, their models did not consider the effect of dislocation emission on the constitutive behavior. WeReference Liu, Zhou and Hui22 also built a constitutive model of BNC materials based on a strain gradient plasticity theory, but we did not consider the effect of nanocracks.
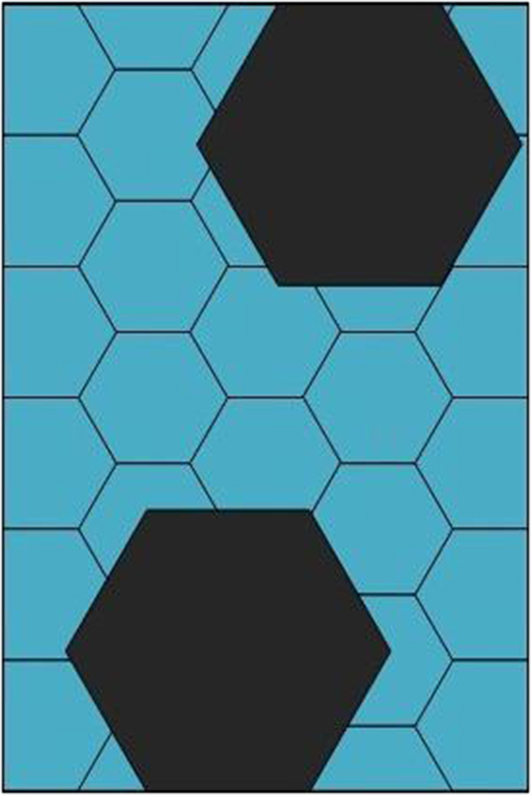
To deeply study the effects of grain size distribution, existence of nanocracks, and dislocation emissions on the constitutive behaviors of BNC materials, this study proposes a new composite model to describe the constitutive behavior of BNC materials. For simplicity, it is assumed that the coarse grains evenly distribute in the NC matrix, as shown in Fig. 2. The calculations seem much meaningful and inspired.
Schematics of bimodal grain size distributions in the present model.

II. THE CONSTITUTIVE MODEL
Both the dislocations within coarse grains and nanograins contribute to the overall strain hardening through Taylor's theory, thus the flow stress can be expressed as:
 $${\sigma _{{\rm{flow}}}} = {\sigma _0} + M\alpha \mu b\sqrt {{\rho _{\rm{T}}}} + {\sigma _{\rm{b}}}\quad ,$$
here α, μ, b, and M are the empirical constant, the shear modulus, the burgers vector, and the Taylor factor, respectively. σ0 is the lattice friction stress and σb represents the back stress for the kinematic hardening that comes from dislocation accumulation at the grain boundaries, and these dislocations are emitted from the nanocrack tips because of stress concentration. ρT refers to the total density of dislocations in coarse grains and the nanograins, determined by the Kocks–Mecking model.Reference Kocks and Mecking23 It can be obtained by using the following equation:
 $${\rho _{\rm{T}}} = {f_{{\rm{coarse}}}}{\rho _{{\rm{sc}}}} + {f_{{\rm{nano}}}}{\rho _{{\rm{sn}}}}\quad ,$$
where f coarse and f nano are the volume fraction of the coarse grains and the nanograins, respectively, ρsc and ρsn are the density of statistically stored dislocations in the coarse grains and nanograins, respectively.
To describe the constitutive behavior of the BNC materials, a dislocation density-related unified constitutive model is used to describe the density of statistically stored dislocations below. During the deformation process controlled by dislocation mechanism, the density of statistically stored dislocations ρs is determined by two dynamic processes: athermal storage of dislocations  $\rho _{\rm{s}}^ +$ and annihilation of dislocations
 $\rho _{\rm{s}}^ -$. For a given overall strain, ρs will be given by
 $${\rho _{\rm{s}}} = \rho _{\rm{s}}^ + + \rho _{\rm{s}}^ - \quad .$$
According to the Kocks–Mecking model, the density of dislocations in grains obeys the evolution law of plastic strain. Capolungo et al.Reference Capolungo, Jochum, Cherkaoui and Qu24 proposed a model accounting for the athermal storage of dislocations and the dynamic recovery process controlled by the annihilation of stored dislocations. Based on their model, the relation between the density of dislocations (ρ) and ε can be expressed as follows:
 $${{\partial \rho } \over {\partial \varepsilon }} = M\left( {{k \over d} + {k_1}\sqrt \rho - {k_2}\rho } \right)\quad ,$$
where k = 1/b, k 1 = ψ/b, and k 2 = k 20(εp/ε0)−1/n, ψ is the proportionality factor, d is the grain size, k 20 and ε0 are the constants, ε0 is the reference strain rate, and n is the Taylor orientation factor, which is inversely proportional to the temperature.
The back stress induced by dislocation accumulation can be simply expressed as:
 $${\sigma _{\rm{b}}} = M\left( {{{\mu b} \over d}} \right)N\quad ,$$
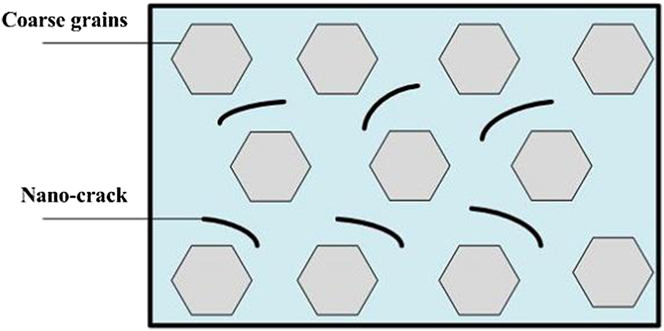
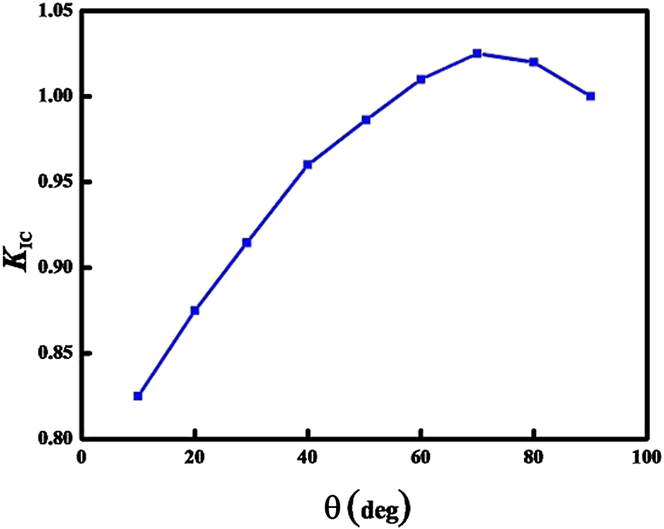
where N is the number of dislocations that emit from the nanocrack tips. In the present work, we assume that the nanocracks evenly distribute in the NC matrix, as shown in Fig. 3. In our previous work,Reference Liu, Zhou, Wang, Zhang and Wang25 we proposed a model to study the effect of grain boundary sliding and dislocation emission from crack tip on fracture toughness of NC materials. When an external load is applied to a specimen with a crack, stress concentration occurs at the crack tip, and then the stress singularity appears. Such stress singularity is induced not only by the external load but also by the stress field of dislocations introduced around the crack tip. Dislocations change the local stress intensity factor at the crack tip from where it would be in the bare external stress field. Such concept on the interaction between crack and dislocations has been treated in terms of crack tip shielding by dislocations.Reference Song, Curtin, Bhandakkar and Gao26,Reference Liu, Zhou and Shen27 To simplify, we assume that all dislocations emitted from the crack tip would reach the opposite grain boundary. From the literature,Reference Liu, Zhou, Wang, Zhang and Wang25 we can know the relation between the critical stress intensity factor K IC and θ, where θ is the angle between the direction of dislocation emission and crack propagation direction. As illustrated in Fig. 4, the critical intensity factor K IC reaches the maximum value when the angle θ is approximately 70°. Therefore, we only consider the number of dislocations emitted from the crack tip of NC copper when the angle θ is 70°. N can be got from
 $$N = {\rho _{{\rm{crack}}}}{N^*}\quad ,$$
where N ∗ is the maximum number of edge dislocations that can be emitted from the crack tip along one slip plane, ρcrack is the density of the nanocracks, and it can be written as followsReference Zhu, Shi, Lu and Lu20:
 $${\rho _{{\rm{crack}}}} = {\rho _0}\left( {1 - \exp \left[ { - {{\left( {{\varepsilon \over {{\varepsilon _0}}}} \right)}^m}} \right]} \right)\quad .$$
Schematics of nanocracks in bimodal structure.

Dependence of critical crack intensity factor K IC on the angle θ made by the boundary plane and crack growth direction.

ρ0 is the reference density of nanocracks and m is a parameter that can be defined byReference Xie and Gao28
 $$m\log {\varepsilon \over {{\varepsilon _0}}} = D\log {{\pi {a_0}{\sigma ^2}} \over {{\alpha _0}K_{{\rm{IC}}}^2}}\quad ,$$
where α0 is a dimensionless coefficient, a 0 is the initial crack size, and K IC is the critical stress intensity factor. D is the fractal factor and it can be written as:
 $$D = 3 + {{\log \left( {{f_{{\rm{coarse}}}}} \right)} \over {\log \left( {{{{d_{\rm{L}}}} \mathord{\left/ {\vphantom {{{d_{\rm{L}}}} {{d_{\rm{S}}}}}} \right. \kern-\nulldelimiterspace} {{d_{\rm{S}}}}}} \right)}}\quad ,$$
here d L and d S are the maximum and minimum grain sizes, respectively.
Fracture originated in crack, stillness, and balance or development of cracks are all dependent on the stress field near the crack tip. For a mode-I crack with the length of 2a, when it is under different stress states, fracture toughness should be obtained by the following expression:
 $${K_{\rm{I}}} = {\alpha _0}\sigma \sqrt {\pi a} \quad ,$$
here K I denotes the stress intensity factor, α0 is the geometry factor, which depends on geometry and loading forms of the crack object, it can be set to 1 for a infinite plate through cracks.
a is the crack size. According to the fracture criterion of material, when K I arrives at the value of critical stress intensity factor K IC, substituting K IC = K I into Eq. (10) will lead to the expression of the crack size
 $$a = {{K_{{\rm{IC}}}^2} \over {{{\left( {{\alpha _0}\sigma \sqrt \pi } \right)}^2}}}\quad .$$
According to the energy balance theory, in the process of crack growth, the elastic energy would be released. When the maximum strain energy release rate reaches a critical value, the crack will expand. Based on this theory, one can obtain the relationship between the critical stress intensity factor and the critical energy release rate by
 $${K_{{\rm{IC}}}} = \sqrt {{{E{G_{{\rm{cr}}}}} \mathord{\left/ {\vphantom {{E{G_{{\rm{cr}}}}} {{\alpha _0}}}} \right. \kern-\nulldelimiterspace} {{\alpha _0}}}} \quad ,$$
where G cr is the critical energy release rate, and it can be expressed by the surface energy
 $${G_{{\rm{cr}}}} = 2{\gamma _{\rm{s}}}\quad ,$$
here γs is the surface energy.
Let us calculate the maximum number of edge dislocations N ∗ that can be emitted from the crack tip along one slip plane. The equilibrium position of each dislocation is calculated from the force balance equation F r = 0 on the r-axis, here k = 1, 2, …, N ∗. The total force  $F_r^k$ acting on the kth dislocation can be written in terms of the effective stress
 $\sigma _{r\theta }^{\rm{e}}\left( {{r_k},\;\theta } \right)$, where r k is the distance from the kth dislocation to the crack tip, and it can be presented as:
 $F_r^k = b\sigma _{r\theta }^{\rm{e}}\left( {{r_k},\;\theta } \right)$. The effective stress
 $\sigma _{r\theta }^{\rm{e}}\left( {{r_k},\;\theta } \right)$ can be written asReference Ovid'ko and Sheinerman19
 $$\sigma _{r\theta }^{\rm{e}}\left( {r,\;\!\theta } \right) = \sigma _{r\theta }^{{K_{\rm{I}}}}\left( {r,\;\theta } \right) + \sigma _{r\theta }^{{\rm{im}}}\left( {r,\;\theta } \right) \!+ \mathop\sum\limits_{\scriptstyle j = 1 \hfill \atop \scriptstyle j \ne k \hfill} ^{N^*} {{\sigma _{r\theta }}\left( {{r_k},\;{r_j},\;\theta } \right)} \quad ,$$
where the stress  $\sigma _{r\theta }^{{K_1}}\left( {r,\;\theta } \right)$ is created by the applied load near the crack tip on the kth dislocation; the image stress
 $\sigma _{r\theta }^{{\rm{im}}}\left( {r,\;\theta } \right)$ is associated with the presence of the crack free surface and corresponds to the image force induced by the crack; and the stress σrθ(r k, r j, θ) is created by the jth dislocation at the point (r k, θ) and corresponds to the force exerted on the kth dislocation by the jth dislocation.
Following the Rice–Thompson criterion,Reference Rice and Thompson29 it assumes that the emission of the first dislocation occurs if this dislocation is repelled from the crack tip when the distance from the dislocation to the crack tip exceeds the dislocation core radius r 0. Thus, the critical condition for the emission of the first dislocation is
 $${\left. {\sigma _{r\theta }^{{K_{\rm{I}}}}\left( {r,\;\theta } \right) + \sigma _{r\theta }^{{\rm{im}}}\left( {r,\;\theta } \right)} \right|_{r = {r_0}}} > 0\quad .$$
For definiteness, we will consider only necessary conditions for dislocation emission and assume that dislocation emission can be possible even if the width of the crack tip attraction zone exceeds the dislocation core radius. We assume that the (N ∗ + 1)th dislocation (N ∗ = 1, 2, …) can emit within the interval 0 < r < d where this dislocation is repelled from the crack tip. In this region, the following inequality should be valid:
 $$\sigma _{r\theta }^{{K_{\rm{I}}}}\left( {r,\;\theta } \right) + \sigma _{r\theta }^{{\rm{im}}}\left( {r,\;\theta } \right) + \mathop\sum\limits_{\scriptstyle j = 1 \hfill \atop \scriptstyle j \ne k \hfill} ^{{N^*}} {\sigma _{r\theta }^{}\left( {{r_k},\;{r_j},\;\theta } \right)} > 0\quad .$$
It should be noted that Eq. (16) gives only necessary but not sufficient condition for the dislocation emission. Therefore, the real conditions for the dislocation emission are more complex than those described in Eq. (16). The stresses  $\sigma _{r\theta }^{{K_{\rm{I}}}}\left( {r,\theta } \right)$,
 $\sigma _{r\theta }^{{\rm{im}}}\left( {r,\;\theta } \right)$, and σrθ(r k, r j, θ) appearing in Eqs. 14–16 can be obtained from Ref. Reference Lin and Thomson30.
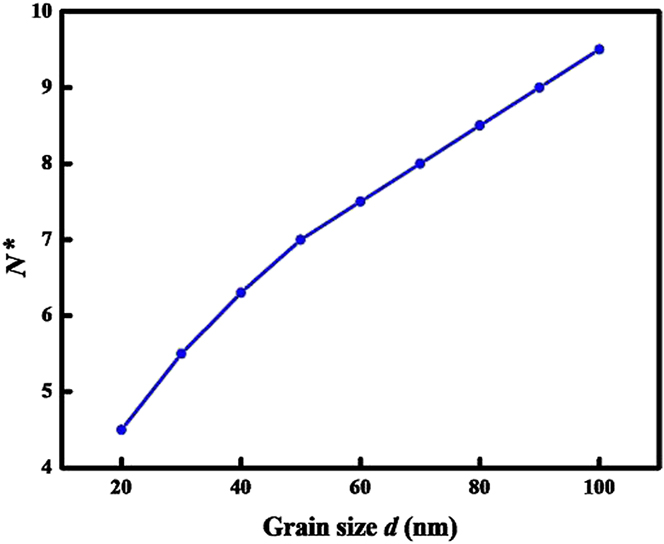
To calculate the maximal number N* of lattice dislocations that can be emitted along the same slip plane, we use the following calculation procedure as introduced by Ovid'ko and Sheinerman.Reference Ovid'ko and Sheinerman31 First, we verify the validity of criterion (15) for the emission of the first dislocation. If this criterion is valid, we place the first dislocation at the distance d from the crack tip and verify the validity of criterion (16) for the emission of the second dislocation. If this criterion is valid for the second dislocation, we calculate its equilibrium position and check the validity of criterion (16) for the emission of the third dislocation, and so on. The procedure is carried out for all the new emitted dislocations and ends when criterion (16) for the emission of a new dislocation stops to be valid. Then, we can obtain the relationship between N ∗ and the grain size d, as shown in Fig. 5.
The maximum number N* of dislocations that can be emitted from the crack tip along one slip plane as a function of grain size d.

III. RESULTS AND DISCUSSION
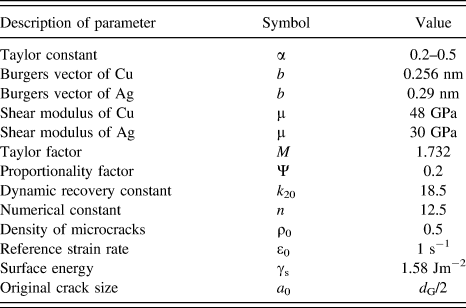
We now utilize the developed model to predict the effect of both the grain size distributions and the nanocracks on the stress–strain relations for the case of bimodal Cu–Ag material. In the proposed composite model, the nanograined phase and coarse-grained phase have different elastic moduli. Detailed information about the material parameters used in calculations is listed in Table I.Reference Zhu, Shi, Lu and Lu20,Reference Zhou, Zhu and Zhang32
Description, symbol, and value of parameter in the model.Reference Zhu, Shi, Lu and Lu20,Reference Zhou, Zhu and Zhang32

A. Constitutive relations
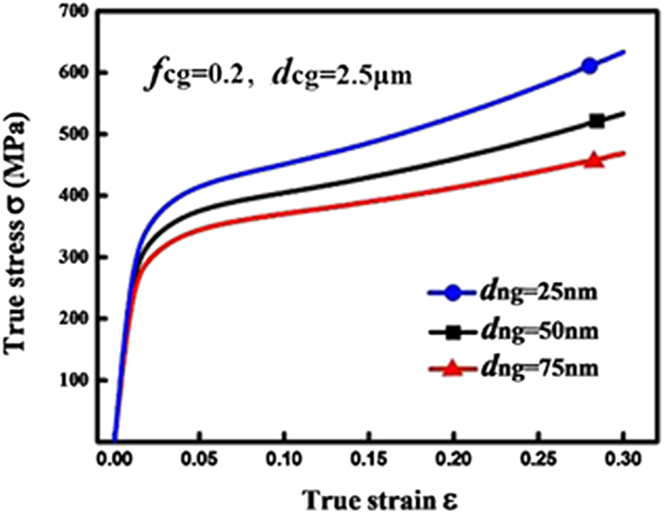
By fixing the volume fraction and the grain size of coarse grain as 20% and 2.5 μm, respectively, the constitutive behaviors obtained from the present model are displayed as a function of NC grain size in Fig. 6. It can be seen from Fig. 6 that the strength of the material increases with the decreasing of the NC grain size. For instance, when the NC grain size increases from 25 to 75 nm, the strength decreases by 24.2%, which is the reason that why people reduce the grain size to increase the strength of the material. In addition, all the stress–strain curves show continuous strain hardening, and these phenomena are consistent with the uniaxial tension stress–strain behavior reported for BNC materials, which show that because of the coarse grain size and fewer obstacles to slip, dislocations glide more easily in the coarse-grained regions than in the NC matrix; so, the coarse grains can enable strain hardening to enhance ductility.
The calculated stress–strain relations for BNC Cu–Ag materials with different NC matrix grain sizes.

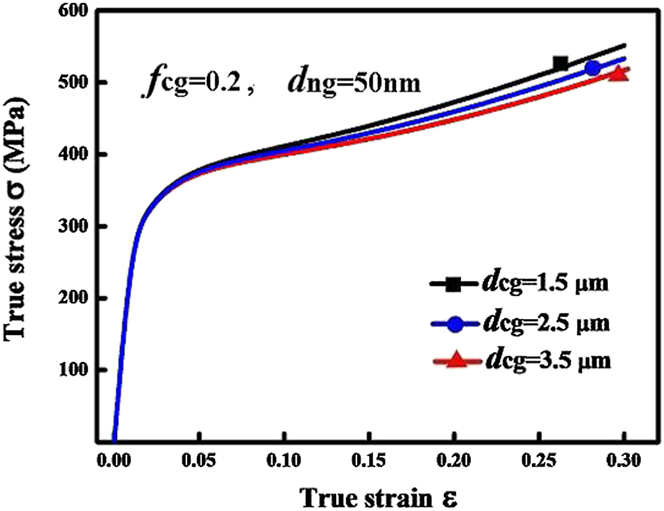
The numerical simulations for BNC Cu–Ag with coarse grain sizes of 1.5, 2.5, and 3.5 μm are also carried out. The grain size of NC matrix and the volume fraction of coarse grain are fixed to be 50 nm and 20%, respectively, and the calculated results are shown in Fig. 7. Figure 7 suggests that the strength of the material decreases with increasing the grain size of the coarse grain, and the changes are relatively small. For example, the strength only decreases by 10.2% when the grain size increases from 1.5 to 3.5 μm. It demonstrates that when the volume fraction of coarse grains remains unchanged, the strength of BNC materials is not highly sensitive to the change in coarse grain size.
The calculated stress–strain relations for BNC Cu–Ag materials with different coarse grain sizes.

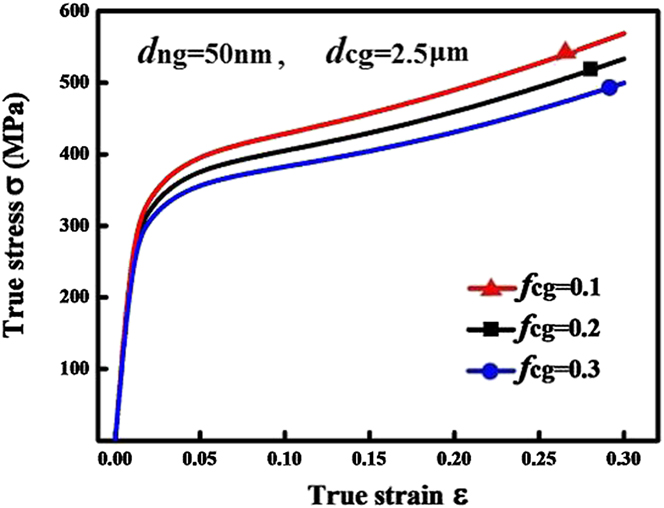
By fixing the coarse grain at 2.5 μm and the fine grain at 50 nm, respectively, the constitutive behavior of the BNC Cu–Ag with different coarse grain volume fractions is depicted in Fig. 8. It can be seen from Fig. 8 that the strength decreases with increasing the CG content. This change is not large, for example, when the CG content increases from 10 to 30%, the strength only decreases by 14.7%. This conclusion is consistent with the experimental data, which explains why people join a certain amount of coarse grain particles in NC materials to increase toughness without reducing the strength.
The calculated stress–strain relations for BNC Cu–Ag materials with different CG contents.

B. Effect of nanocracks on the constitutive behavior
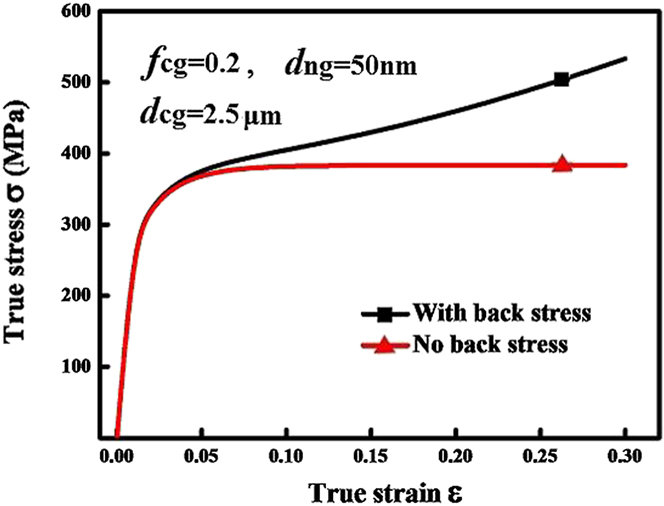
As we discussed earlier, nanocracks can cause modification of the stress and strain fields. When an external load is applied to a specimen with nanocracks, the stress concentration occurs at the crack tip, which leads to dislocation emissions around the crack tips, and then the emitted dislocations slid to the opposite grain boundary by forming pile-ups. This is how the back stress σb in Eq. (1) is formed. In this section, we will study the effect of back stress on the constitutive behavior and dynamic strain hardening of BNC materials by using the present model. The results are shown in Fig. 9. From Fig. 9, we can see that the additional back stress has no tangible influence on yield stress; instead, it has a certain influence on the dynamic strain hardening. From this result, we can conclude that the nanocracks in BNC materials give rise to additional contribution to the kinematic strain hardening but no tangible influence on yield stress.
Influence of the back stress on the plastic deformation of bimodal Cu–Ag materials.

C. Comparison with experimental results
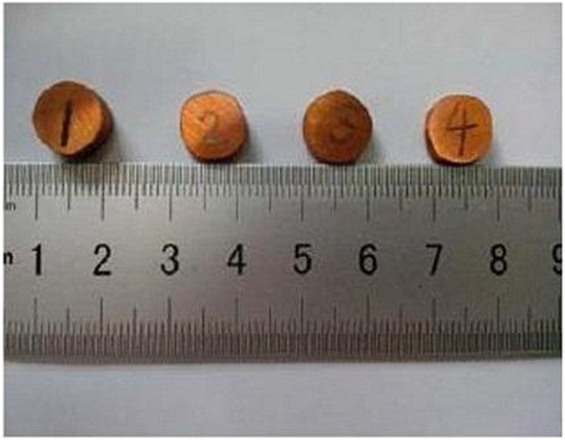
To validate the proposed model, uniaxial tensile test for nanostructured Cu–Ag composite materials with bimodal grain size distribution is carried out to make a comparison with the predictions. The Cu–Ag composite is prepared by using a high temperature and high pressure sintering method. The process of sample preparation is as follows: Cu powder with a mean grain size of 20 nm and Ag powder with a mean grain size of 5 μm as the starting materials were manually mixed for 4 h. Then, the metal oxides were reduced by hydrogen. Afterward, mixture powders were sintered at 5.0 GPa, a high temperature of 700–800 °C for a heat treatment time of 20 min. The high pressure sintering experiments were carried out using a large-volume cubic-type multianvil apparatus.Reference Zou, He, Wei, Yu, Lu, Chang and Wang33 The prepared sample is shown in Fig. 10.
View of BNC Cu–Ag materials.

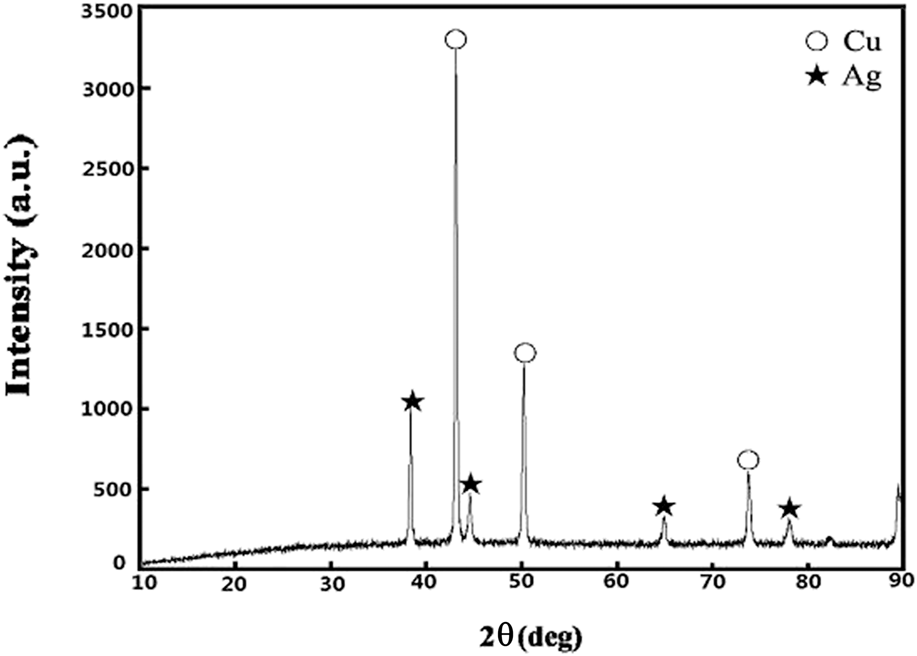
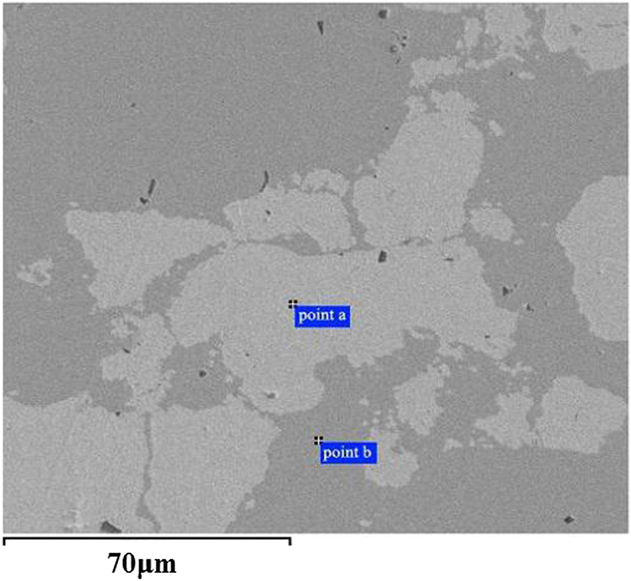
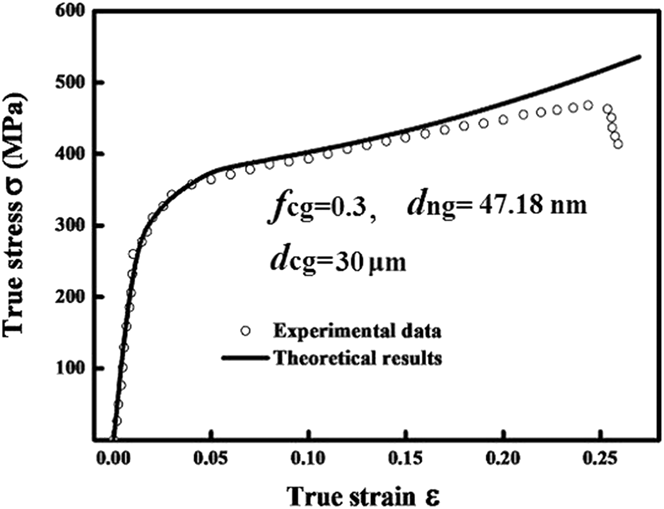
The phase composition and grain sizes of the sintered samples were investigated by the x-ray diffraction (XRD) analysis, as shown in Fig. 11. It can be seen from Fig. 11 that there is no other product. By using the XRD line broadening method,Reference Klug and Alexander34 we can calculate that the average grain size of the synthesized Ag and Cu powders is about 30 μm and 47.18 nm, respectively. Scanning electron microscope (SEM) was also utilized to investigate the microstructure and morphology of the sintered samples, as shown in Fig. 12. The SEM image shows that there was no reaction between Cu phase and Ag phase, and the porosity is very small. The comparison between the calculated stress–strain relationship based on the proposed model and the uniaxial tensile test is shown in Fig. 13. It can be seen that the predicted yield stress and work hardening rate agree well with the experimental results. The proposed model appears to be capable of capturing the constitutive behavior of BNC Cu–Ag materials.
XRD pattern of the starting material is synthesized using a high temperature and high pressure method, with the phase of Ag and Cu.

SEM image of the BNC Cu–Ag materials.

Comparison of the stress–strain relationship between the theoretical results and the experiments for BNC Cu–Ag materials.

IV. CONCLUSIONS
This study established a theoretical model to describe the constitutive behavior of BNC materials. In the frame work of the model, the local mechanical properties are modified due to the existence of back stress induced by emission of dislocations from crack tips. The emission of dislocations makes a shielding effect on the crack and leads to strain hardening. After identifying the related parameters in the developed model, the stress–strain responses of BNC Cu–Ag materials were simulated. It was revealed that the proposed model can describe the mechanical behavior of BNC Cu–Ag successfully, and the result shows that: (i) the strength of the material increases with the decreasing of the NC grain size. (ii) Stress–strain curves show continuous strain hardening, and it captures the features of the mechanical response of BNC materials. (iii) The numerical results also indicate that as the volume fraction of coarse grains remains unchanged, the strength of BNC materials is not highly sensitive to the change in coarse grain size. (iv) The strength is dependent on the volume fraction of coarse grains, and it decreases with increasing the CG content. (v) The back stress makes much more contribution to work hardening rather than enhancing the strength. (vi) The prediction is in good agreement with the experimental result. These conclusions make a good illustration that why people join a certain amount of coarse grain particles in NC materials to increase toughness without reducing the strength.
ACKNOWLEDGMENTS
The authors are grateful for the funding of the National Natural Science Foundation of China (51301069), Natural Science Foundation of Hebei Province (E2014502073), and the Fundamental Research Funds for the Central Universities (2014MS114).