INTRODUCTION
Wheat, maize and cotton are the three main crops of agricultural production in Xinjiang, a Uygur Autonomous Region in north-western China. Due to Xinjiang's short frost-free period of 156 days (Tang et al. Reference Tang, Li, Ma, Hao and Li2008), crops can be planted only in monoculture in this area. In 2011, the area of the three crops accounted for 0·70 of the planted area in Xinjiang, of which 0·22, 0·15 and 0·33 consisted of wheat, maize and cotton, respectively (National Bureau of Statistics of China 2012).
Rational fertilization, especially for phosphorus (P), is one of the most important techniques for improving crop yield and quality, and it also reduces the surface water eutrophication of the environment. Phosphorus is one of the main limiting nutrients for crop production; it has been estimated that 0·43–0·48 of soils in China contain low P contents (Olsen-P as available P < 10 mg/kg) (Xie & Tan Reference Xie and Tan2001; Yang et al. Reference Yang, Jin, Bai and Huang2001). The application of mineral P fertilizers is the most effective way to improve the P supply for crop production (Johnston Reference Johnston, Leigh and Johnston1994; Eichler-Löbermann et al. Reference Eichler-Löbermann, Köhne and Köppen2007) and to increase crop yields (Li et al. Reference Li, Eneji, Duan, Inanaga and Li2005). However, farmers have resorted to using higher than the recommended rates of fertilizers in their pursuit of higher yields in many areas of China (Li et al. Reference Li, Gao, Ma, Gilkes and Prakongkep2010). An overload of P fertilizer causes massive P accumulation in cultivated soils. Most of this residual P (P surplus) accumulates in soils as less soluble and more stable products (Selles et al. Reference Selles, Campbell and Zentner1995), especially in arid areas, which raises concerns for diffuse environmental pollution and the inefficiency of P resource use (Zhang et al. Reference Zhang, Ji, Kolbe and Xu2004). Excessive P accumulation in the soil also threatens surface water quality and the ecological security of the environment in China and many other countries worldwide (Sharpley et al. Reference Sharpley, Daniel, Sims and Pote1996, Reference Sharpley, Foy and Withers2000; McDowell & Sharpley Reference McDowell and Sharpley2004; Aulakh et al. Reference Aulakh, Garg and Kabba2007; Tang et al. Reference Tang, Ma, Hao, Li, Li, Huang and Yang2009). The development and testing of a robust but simple model for predicting the effects of P surpluses on the increased accumulation of Olsen-P in the soil is a valuable goal, because such a tool would enable farmers and agronomists to determine how much surplus P is required to build soil P to an agronomically suitable level without exceeding environmental thresholds.
Ma et al. (Reference Ma, Li, Li, Tang, Liang, Huang, Wang, Liu and Yang2009) studied the accumulation of P in soils using long-term wheat–maize crop rotation experiments at five geographically and climatically different sites in China and developed a model describing Olsen-P accumulation in the soil based on the application rate of inorganic P fertilizers, crop yield and soil pH. On the basis of that model, Huang et al. (Reference Huang, Ma, Bao, Guo and Zhang2011) demonstrated that manure behaved similarly to superphosphate in terms of P accumulation, indicating that the model relating the accumulation of Olsen-P and surplus P in the soils applied not only to inorganic P sources (such as superphosphate) but also to organic P fertilizers (such as horse, horse-cattle and cattle manures) over a 15-year long-term wheat–maize crop rotation experiment in Zhengzhou in the Henan province in China. This P accumulation model has also been validated using paddy soil (Li et al. Reference Li, Gao, Liu, Xu and Ma2012a ) and bio-solids (including sewage sludge and chicken manure) as organic P fertilizers (Li et al. Reference Li, Li, Cui, Wei and Ma2012b ).
However, it remains unclear whether this model could be applied to a more comprehensive range of situations, such as a wheat–maize–cotton monoculture 3-year cycle rotation system in an arid area. Therefore, the objectives of the present study were to: (i) quantify the P accumulation rates resulting from the different application rates of P fertilizers and P export rates by crop uptake in a wheat–maize–cotton monoculture 3-year cycle rotation system in the arid area of Xinjiang; (ii) adjust the parameters of the P model and validate it using a long-term monitoring history dataset for grey desert soil, based on the results from a long-term (over 22-year) wheat, maize and cotton monoculture in a 3-year crop rotation system in a dry land area of China; and (iii) validate the model independently using data previously published in the literature.
MATERIALS AND METHODS
Experimental location, climate characteristics and soil properties
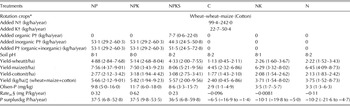
The experimental location in the grey desert soil of Xinjiang was one site of the National Long-term Monitoring Network of Soil Fertility and Fertilizer Effects, which was established in 1989 to investigate the effects of climate, crop rotation and application of inorganic and organic fertilizers on crop yield and soil fertility in the main agricultural areas of China. The experimental site (43°58′N, 87°25′E, 600 m a. s. l.) was located in the suburbs of Urumqi, Xinjiang, China, which fell under a typical continental arid climate. The data regarding the climatic characteristics of the experimental location were as follows: annual precipitation, mean annual temperature, effective accumulated temperature, frost-free period and sunshine hours were 242 mm, 7·6 °C, 1734 °C, 156 days and 2454 h, respectively. The soil was classified as a grey desert soil in the Chinese classification and as a Calcaric Cambisol in the FAO soil classification (FAO 2006). The main soil properties in the plough layer (0–200 mm) prior to the experiment were: soil pH (water: soil = 2·5:1) 8·1, organic matter 8·8 g/kg, total N 0·87 g/kg, total P 0·67 g/kg, total K 23·0 g/kg, alkaline hydrolysable N 55·2 mg N/kg, Olsen-P 3·9 mg P/kg and NH4OAc extractable K 288·0 mg K/kg. A local cultivar of wheat was grown for 2 years without fertilizer in order to decrease the variability in the experimental field prior to beginning the long-term fertilizer monitoring experiments in 1989. One crop (wheat, maize or cotton) was planted at the local experiment site each year (Table 1).
Fertilizer application, crop yields and Olsen-P in each treatment

* Generally, the crop rotation cycle for Urumqi was maize-spring wheat-winter wheat-spring (or cotton) from 1990 to 2011. Maize was grown in 1990, 1993, 1996, 2000, 2003, 2005, 2008 and 2010; winter wheat was grown in 1992, 1995, 1997, 1998, 2001, 2004, 2007 and 2011; spring wheat was sown in 1991, 1994, 2002 and 2006; and cotton was planted in 1999 and 2009.
† The application rates of N, P and K were 99·4 kg N/ha, 29·2 kg P/ha and 22·7 kg K/ha in 1990–1994 and 242 kg N/ha, 60·3 kg P/ha and 50·4 kg K/ha from 1995 to 2011 in the inorganic fertilizer treatments at the Urumqi experiment site. Added organic P is the NPKS treatment from 1990 to 2011.
‡ The yields of ‘wheat + maize + cotton’ for different treatments are calculated as a ‘weighted’ mean for the number of years each crop grown.
§ The values of the Olsen-P accumulation rates (Rateac) are derived from the Olsen-P values measured in the last year (2011) minus the initial Olsen-P values (1989), were divided by the cultivation time (22 years).
A randomized complete block design was used in the experiments. Six treatments were investigated: (1) C (unfertilized control), (2) N (nitrogen only), (3) NK (nitrogen and potassium), (4) NP (nitrogen and phosphorus), (5) NPK (nitrogen, phosphorus and potassium) and (6) NPKS (nitrogen, phosphorus, potassium and crop straw returned to the field). The fertilizer application rates of N, P and K are listed in Table 1. All of the P and K fertilizers, as well as 0·60 of the N fertilizer, were applied as basal fertilizers prior to seeding. The remaining N fertilizer was applied as a top dressing later during the growing season.
Crops (wheat, maize and cotton) were harvested close to the ground with farm machinery, and all harvested biomass was removed from the plots, with little or no crop residues returned to the land except in the NPKS treatment. The experimental plot covered an area of 468 m2 and crop yields were determined from the whole plot area. The long-term experiment was conducted from 1990–2011.
Analysis of soil and plant samples
Soil samples from each treatment were collected from the plough layer (0–200 mm) annually from 1990 to 2011 after crop harvesting. Samples were taken at ten places in each plot and mixed thoroughly, then air-dried, sieved through a 2·0-mm sieve and stored for analysis. Crop and straw samples were air-dried on concrete, threshed and oven-dried at 65 °C to uniform moisture content before weighing.
Soil samples were analysed for soil pH (water to soil at 2·5:1 ratio), available N (alkaline diffusion method), Olsen-P (0·5 mol/l sodium bicarbonate (NaHCO3) at pH 8·5 extractable P) and available K (1 mol/l ammonium acetate (NH4OAc) extractable K) following Page et al. (Reference Page, Miller and Keeney1982). Total N, P and K in soil were analysed using micro-Kjeldahl digestion, the colorimetric analysis method and dissolution-flame photometry (Page et al. Reference Page, Miller and Keeney1982), respectively.
Crop samples were ground to pass through a 0·15-mm sieve. To determine the total P (TP) content, the crop samples were digested with sulphuric acid (H2SO4) and hydrogen peroxide (H2O2) following the method of Jackson (Reference Jackson1958), and the concentration in the digesting solution was measured using the molybdenum-blue colorimetric method (Page et al. Reference Page, Miller and Keeney1982).
Models and validation
The relationship between Olsen-P in the soil and soil pH, application rates of P fertilizer and crop yield was developed by Ma et al. (Reference Ma, Li, Li, Tang, Liang, Huang, Wang, Liu and Yang2009) and further studied by Huang et al. (Reference Huang, Ma, Bao, Guo and Zhang2011) and Li et al. (Reference Li, Gao, Liu, Xu and Ma2012a , Reference Li, Li, Cui, Wei and Ma b ) and can be expressed by the following equations:
 $${\rm Olsen \!-\! P} = {{\rm Olsen} \!-\! {\rm P}_i + \displaystyle{D \over {{\rm pH}}}\sum\limits_1^{\rm t} {(P_t - C_t \times Y_t)}}$$
 $${\rm Olsen \!-\! P} = {\rm Olsen \!-\! P}_i + \displaystyle{D \over {{\rm pH}}}(P_m - C_m \times Y_m) \times t$$
where Olsen-P i was the initial concentration of Olsen-P in the soil (mg/kg) prior to the experiment, D was a constant, pH was soil pH (2·5, water/soil), P was the application rate of P fertilizers (kg P/ha), t was the cultivation time (year), C was the apparent concentration of P in the crop (g/kg), Y was the total crop yield tonne/ha (t/ha) and the subscript m denoted the average of P, C and Y over the period of cultivation, respectively. The reasons for using the apparent concentration of P, not the measured concentration of P, were that the variation of P concentration in crops from different treatments, and/or different soils and crop variety, was ignored. The accumulation rate (Rateac) of Olsen-P in soil could be estimated as follows:
 $${\rm Rate}_{{\rm ac}} \left( {{\rm mg}/{\rm kg}/{\rm year}} \right) = (D/{\rm pH}) \times \left( {P_{m} - {\rm} C_{m} \times Y_m} \right)$$
P input–output balances (P surplus) were calculated as follows:
 $$\Delta P = {\rm} P_r -U_{\rm P} $$
where ΔP (kg P/ha) was the surplus P, P r (kg P/ha) was the amount of P fertilizer applied from both organic and inorganic P sources and U P (kg P/ha) was total P uptake by the crop (grain and straw). The value of Olsen-P in different monitoring years minus the Olsen-P from the initial year (ΔOlsen-P) was calculated as follows:
 $$\Delta {\rm Olsen} \!-\! {\rm P} = {\rm Olsen} \!-\! {\rm P}_n - {\rm Olsen} \!-\! {\rm P}_i $$
where Olsen-P i was defined by Eqn (1) and Olsen-P n was the soil Olsen-P content (mg/kg) during the experimental monitoring.
Statistical analysis
The descriptive statistics of the data (the application rate of P fertilizer, crop yields, Olsen-P, pH, etc.) for the long-term monitoring experiment site were obtained using Excel software (Version 2003; Microsoft Corporation 2003). The relationships among the measured and estimated Olsen-P values, ΔOlsen-P and ΔP (surplus P) were evaluated using correlation and linear regression analyses in SAS software (Version 9.1; SAS Institute 2003).
RESULTS
Accumulation of Phosphorus in soils with and without P fertilizers
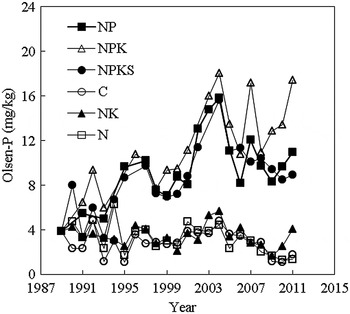
Olsen-P concentrations were different in each treatment over time (Fig. 1). Both positive and negative P accumulation in the soil occurred at the same time owing to the different inputs and outputs of P in the soils under different treatments. The Olsen-P accumulation rates in Xinjiang grey desert soil with a wheat, maize and cotton monoculture in a 3-year cycle rotation over 22 years (1990–2011) were 0·32, 0·62, 0·23, −0·096, −0·0081 and −0·11 mg P/kg/year in the NP, NPK, NPKS, C, NK and N treatments (Table 1), respectively, when the P fertilizer application rates were 53·1, 53·1, 51·5, 0, 0 and 0 kg P/ha/year in the NP, NPK, NPKS, C, NK and N treatments (Table 1), respectively. The average accumulation rate of Olsen-P under P application was 0·39 mg P/kg/year, resulting in an increase from the initial value of 3·9 mg P/kg in 1989 to 12·5 mg P/kg in 2011. Conversely, a decrease of 0·068 mg P/kg/year, leading to a decline from 3·9 mg P/kg to 2·4 mg P/kg, was observed without P application. The measured Olsen-P concentrations varied around the average of 3·0 mg/kg in the soil without P addition between 1989 and 2011. For the three treatments receiving P fertilizers (NP, NPK and NPKS), the values of Olsen-P in the soils peaked in 2004 and then declined (Fig. 1), which was probably due to the change of crop variety with higher yield and offtakes in 2005 and the variability in Olsen-P from the unevenness of soils with applied P fertilizers.
Changes in the measured soil Olsen-P for different treatments over time.

Predictive model and validation
The Olsen-P accumulation model was parameterized with the long-term fertilization monitoring dataset of the wheat, maize and cotton monoculture in a 3-year cycle rotation in grey desert soil by minimizing the sum of the squares of the residual variation in the data from the model in Eqn (2). The model was characterized by the following equation:
 $${\rm Olsen \!-\! P(mg/kg)} = {\rm Olsen \!-\! P}_i + \displaystyle{{{\rm 0}{\rm. 1}} \over {{\rm pH}}}(P_m - {\rm 3}{\rm. 1} \times Y_{m{\rm 1}} - {\rm 2}{\rm. 47} \times Y_{m{\rm 2}} - {\rm 3}{\rm. 46} \times Y_{m{\rm 3}}) \times t $$
 $$\left( {R^{\rm 2} = 0 {\cdot} {\rm 71},\,n = {\rm 122}} \right)$$
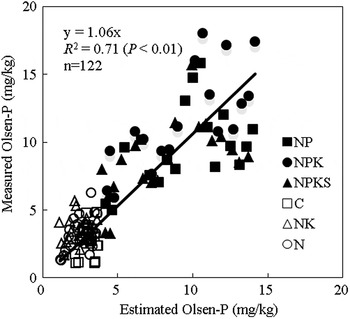
where Olsen-P i was the initial concentration of Olsen-P in the soil (mg/kg); the parameter of 0·1/pH (mg/kg × ha/kg) was the ΔOlsen-P in the soil (mg/kg) led by one unit of P surplus (kg/ha) in the soil; P m was the average of application rate of P fertilizer per cultivation year (kg P/ha); Y m1, Y m2 and Y m3 were the average crop yields of wheat, maize and cotton (t/ha), respectively; 3·1, 2·47 and 3·46 (g P/kg) were the apparent concentrations of P in crops of wheat, maize and cotton, respectively; and t was the cultivation time (year). The measured and predicted Olsen-P values in the soils with and without P fertilization are shown in Fig. 2. The determination coefficient (R 2) for the measured versus the estimated Olsen-P values in the wheat, maize and cotton monoculture rotation production system in grey desert soil was 0·71 (P < 0·01) and the ratio (1·06) of the measured to the estimated Olsen-P values was much closer to 1·0.
Measured and estimated Olsen-P using the accumulation model for each treatment under the long-term experiment.

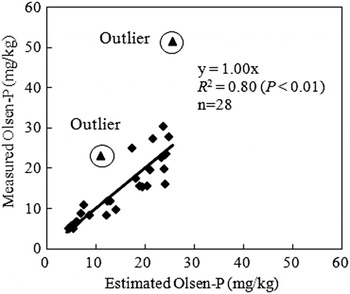
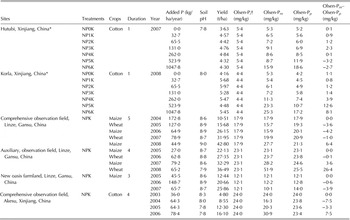
The measured soil Olsen-P contents of wheat, maize and cotton monoculture crops in arid areas reported in the literature were in good agreement with those predicted by the model of Eqn (6) (Table 2). The differences between the measured and predicted values were <0·46 (7·5 mg/kg), except for the Olsen-P values of 23·3 and 51·9 mg/kg measured in Korla Xinjiang and Linze Gansu in China, respectively. The determination coefficient (R 2) between the predicted and the measured soil Olsen-P values was 0·80 (P < 0·01) (Fig. 3). These results indicated that the Olsen-P accumulation model could be used to predict the concentrations and the accumulation rates of soil Olsen-P using the P fertilizer application rate (including organic and inorganic P), crop yield (wheat–maize–cotton) and soil pH.
Measured and estimated Olsen-P using the accumulation model in wheat, maize or cotton monocultures in the north-western arid production areas of China.

The measured Olsen-P (Olsen-Pm) in the literature and the predicted Olsen-P (Olsen-Pp) using the model (Eq. 6) in a short experiment with cotton (one crop each year) in Hutubi and Korla, Xinjiang, China in 2010 (Chen Reference Chen2010; Chen et al. Reference Chen, Sheng, Jiang and Liu2010); a long-term experiment with wheat–maize rotation (one crop each year) in Linze, Gansu, China (Zhang & Jin Reference Zhang and Jin2010) and a long-term experiment with cotton monoculture in Akesu, Xinjiang, China (Zhao & Hu Reference Zhao and Hu2010)

* In the NPK treatment at Hutubi and Korla, Xinjiang, China, the application rates of N, P0, P1, P2, P3, P4, P5, P6 and K fertilizers were 276, 0, 32·75, 65·49, 130·98, 261·96, 523·92, 1047·84 and 53·79 kg/ha, respectively.
† Olsen-P i is the initial Olsen-P concentration in the soil prior to the trials.
Phosphorus input–output balance
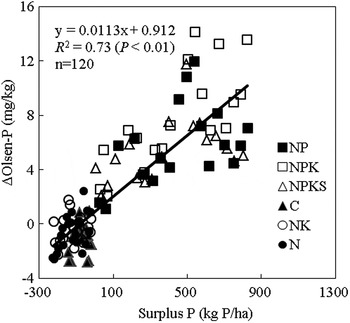
The P balance in the soil depended on the inputs and outputs of soil P. In the Olsen-P accumulation model (Eqn 6), plant uptake caused an average net loss of soil Olsen-P of 0·12 mg P/kg/year (ranging from 0·067 to 0·26 mg P/kg/year) without P fertilization application in the plough layer (0–200 mm), as indicated by the negative P surplus values. Conversely, as indicated by the positive P surplus values, an average net gain of soil Olsen-P of 0·36 mg P/kg/year (ranging from 0·083 to 0·47 mg P/kg/year) was observed with P fertilization application. For example, Olsen-P decreased by averages of 0·096, 0·0081 and 0·11 mg/kg/year when the surplus P values were −6·5 kg (−16·9 to −1·4 kg P/ha/year), −10·1 (−19·8 to −5·0 kg P/ha/year) and −10·2 kg P/ha/year (−21·6 to −4·7 kg P/ha/year), as was the case for the C, NK and N treatments, respectively. Olsen-P accumulated by averages of 0·32 mg/kg/year, 0·62 mg/kg/year and 0·23 mg/kg/year when the surplus P values were 37·5 (6·8 to 52·8 kg P/ha/year), 37·5 (9·8 to 53·5 kg P/ha/year) and 36·5 kg P/ha/year (6·8 to 59·8 kg P/ha/year), as was the case for the NP, NPK and NPKS treatments, respectively (Table 1). The accumulation of P fertilizer was responsible for the positive linear relationship between the Olsen-P content and the P surplus observed in the soil. The results indicated that for every 100 kg/ha of P surplus, Olsen-P increased by an average of 1·1 mg/kg in Xinjiang grey desert soil (Fig. 4).
Relationship between soil P input output balance and changes in Olsen-P content in a wheat, maize and cotton monoculture in a 3-year cycle rotation in China.

DISCUSSION
The results of the current experiment, that the accumulation of Olsen-P in soils could be predicted by model based on the P fertilizer application rate (including organic and inorganic P), crop yield (wheat–maize–cotton) and soil pH, was consistent with those of Ma et al. (Reference Ma, Li, Li, Tang, Liang, Huang, Wang, Liu and Yang2009), Huang et al. (Reference Huang, Ma, Bao, Guo and Zhang2011) and Li et al. (Reference Li, Gao, Liu, Xu and Ma2012a , Reference Li, Li, Cui, Wei and Ma b ). However, the Olsen-P accumulation model, as developed by Ma et al. (Reference Ma, Li, Li, Tang, Liang, Huang, Wang, Liu and Yang2009), is limited to a crop rotation system of either wheat and maize or wheat and soybean (Huang et al. Reference Huang, Ma, Bao, Guo and Zhang2011). When the crop rotation system is changed, the parameters of the model must be revalidated due to the uncertainty associated with the ratio of Olsen-P to the P surplus and the P concentrations under different crop production systems. Nevertheless, Ma et al. (Reference Ma, Li, Li, Tang, Liang, Huang, Wang, Liu and Yang2009) showed that the model developed from a wheat–maize rotation in China was validated by experimental data from Ludhiana, India.
A significant linear relationship was detected between Olsen-P accumulation and surplus P (the amount of fertilizer applied in excess to the amount removed by crops) in grey desert soil in a north-western arid wheat–maize–cotton production area in China, in agreement with results reported in the continuing research of Johnston & Poulton (Reference Johnston, Poulton and Schultz1992), Higgs et al. (Reference Higgs, Johnston, Salter and Dawson2000), Tang et al. (Reference Tang, Li, Ma, Hao and Li2008), Ma et al. (Reference Ma, Li, Li, Tang, Liang, Huang, Wang, Liu and Yang2009), Li et al. (Reference Li, Gao, Ma, Gilkes and Prakongkep2010), Huang et al. (Reference Huang, Ma, Bao, Guo and Zhang2011) and Li et al. (Reference Li, Gao, Liu, Xu and Ma2012a ). The applicability of the model has previously been validated in the 1-year wheat and maize rotation system with both inorganic (Ma et al. Reference Ma, Li, Li, Tang, Liang, Huang, Wang, Liu and Yang2009) and organic P sources (Huang et al. Reference Huang, Ma, Bao, Guo and Zhang2011); the present study validates the model in a wheat, maize and cotton monoculture with a 3-year cycle rotation system for inorganic and organic P sources applied simultaneously. The Olsen-P accumulation model developed by Ma et al. (Reference Ma, Li, Li, Tang, Liang, Huang, Wang, Liu and Yang2009) was completely validated by the soil pH, P fertilizer (including organic and inorganic P resources) application rate and crop yield of the long-term experimental dataset for this system, and it was also validated independently by data from the literature for wheat, maize or cotton monoculture production areas in other dry areas of China, although several outliers were observed. The outliers were found in the experiment in Korla, Xinjiang, China when the application rate of P was > 500 kg P/ha during 1 year, which indicates that the predictive model cannot be applied to the situation of too much P being applied to soil in a relatively short space of time. However, this situation is rare in fertilizer management.
The significant positive relationship between the surplus P (kg P/ha) and Olsen-P (mg P/kg) in the soils (ΔOlsen-P = 0·912 + 0·0113 P surplus, R 2 = 0·73, n = 120; P < 0·01) suggests that changes in Olsen-P content can be predicted from the P input–output balance (the relationship between the fertilizer input and crop production output) in the soil. In the present study, a P surplus of 814 kg P/ha (37 kg P/ha/year × 22 years) from conventional fertilization (including organic and inorganic P sources) and the initial Olsen-P content of 3·9 mg/kg in 1989 resulted in a final Olsen-P content in 2011 (22 years later) of c. 14·0 mg P/kg. The results indicate that for every 100 kg of surplus P/ha in the soil, Olsen-P increases by 1·1 mg P/kg; this result is less than the range of 2·0 to 6·0 mg P/kg previously reported by Shepherd & Withers (Reference Shepherd and Withers1999) and Aulakh et al. (Reference Aulakh, Garg and Kabba2007), and the range of 2·3–5·7 mg P/kg reported in north China by Tang et al. (Reference Tang, Li, Ma, Hao and Li2008), but was close to the 1·4 mg P/kg reported by Cao et al. (Reference Cao, Chen, Cui and Zhang2012). In light of the results reported by Tang et al. (Reference Tang, Li, Ma, Hao and Li2008), the increase in the P fertilizer application rate and decrease in crop uptake of P due to monoculture may be the main reasons why ΔOlsen-P is reduced under conditions of unchanged soil pH and initial Olsen-P.
The average accumulation rate of Olsen-P in the soil (Rateac) from the model in the present study area was predicted to be 0·36 mg/kg/year, which was very similar to the average measured value of 0·39 mg/kg/year (from 0·23 to 0·62 mg/kg/year), for a mean P application rate of 52·6 kg P/ha/year (from 51·5 to 53·1 kg P/ha/year), average soil pH of 8·1 (from 8·0 to 8·2) and average yields of 4·78 t/ha wheat (from 4·33 to 5·14 t/ha), 7·71 t/ha maize (from 7·50 to 8·06 t/ha) and 3·01 t/ha cotton (from 2·77 to 3·18 t/ha). The model is a valuable tool for the optimal management of P fertilization for crop production and environmental protection in the north-western arid region of China.
The prediction model estimates that with the average yearly Olsen-P accumulation of 0·36 mg/kg observed under the study conditions, Olsen-P contents would reach the agronomy threshold of 20–25 mg/kg (Tang et al. Reference Tang, Ma, Hao, Li, Li, Huang and Yang2009), and environmentally critical value of 60 mg/kg (Zhang et al. Reference Zhang, Cui and Cheng2010), in 45–59 and 156 years, respectively, from the initial monitoring year. However, the application rate of P fertilizers should decrease with the increase of Olsen-P content in soils because there is less benefit to be gained from applying P fertilizers to soils above the agronomy thresholds. Although this period represents a comfortable buffer from the environmental and agronomy threshold of P, the model assumes that crop yields and the P fertilizer application rate are constant during this time. Excess P accumulation in the soil surpassing the environmental risk indicator content exacerbates the leaching of P into groundwater or the entrance of P into rivers and lakes through surface runoff and soil erosion, which leads to the eutrophication of water bodies (Sharpley et al. Reference Sharpley, Daniel, Sims and Pote1996, Reference Sharpley, Foy and Withers2000; McDowell & Sharpley Reference McDowell and Sharpley2004; Aulakh et al. Reference Aulakh, Garg and Kabba2007; Tang et al. Reference Tang, Ma, Hao, Li, Li, Huang and Yang2009). Soil Olsen-P content in farmland must be maintained in consideration of both crop production and environmental protection. The Olsen-P accumulation model can serve as a constructive and predictable method for achieving this objective. The model can also decrease the frequency of monitoring Olsen-P in soils and reduce soil testing costs, helping to provide the best P management for both agricultural production and environmental protection.
CONCLUSION
The predictive model, based on the initial Olsen-P in the soil, P fertilizer application rate, crop yield and soil pH, was validated by a long-term fertilizer monitoring experiment in wheat, maize and cotton monoculture in a 3-year cycle rotation system in grey desert soil in China, and was also validated independently using published data from the literature. Olsen-P accumulation rates were predicted for the loss of 0·12 mg P/kg/year on average (from 0·067 to 0·26 mg/kg/year) in soil without P fertilization, and a net gain of 0·36 mg/kg/year on average (from 0·083 to 0·47 mg/kg/year) in soil with P fertilization in wheat–maize–cotton monoculture 3-year cycle rotation system in grey desert soil in Xinjiang arid area of China. Every 100 kg/ha of surplus P can increase Olsen–P by 1·1 mg/kg in Xinjiang grey desert soil.
The authors thank the National Natural Science Foundation of China (41161054), Xinjiang Uygur Autonomous Region Natural Science Foundation of China (2011211B42), Special Fund for Agro-scientific Research in the Public Interest of China (200903001–03) and Key Laboratory of Oasis Nutrient and Utilization of Water and Soil Resources in Xinjiang Academy of Agricultural Sciences of China (xjnkkl–2013–001) for providing funding for this work. The authors also thank all scientists associated with National Long-term Monitoring Network of Soil Fertility and Fertilizer Effects in Grey Desert Soil in China for supplying the historic dataset.