Biochar refers to the biomass-derived black carbon that is generally produced by the burning of biomass in a limited amount of oxygen that turns it into char (Lehmann et al. Reference Lehmann, Gaunt and Rondon2006). It is produced by a similar process to that used to produce general charcoal, but biochar is used solely for environmental purposes to improve soil condition, to facilitate infiltration of percolating groundwater and for carbon storage (Lehmann & Joseph Reference Lehmann, Joseph, Lehmann and Joseph2009). These specific functions differentiate biochar from general charcoal. Biochar's complex mixtures of aromatic compounds generated during carbonisation (Lewis Reference Lewis1982) make it resistant to hydrolytic enzymes (Derenne & Largeau Reference Derenne and Largeau2001). The raw materials used to produce biochar are similar to those used for activated carbon, and a variety of raw materials and production conditions have been evaluated (Yaman Reference Yaman2004).
The final structure and properties of biochar depend largely on its original feedstock (Wildman & Derbyshire Reference Wildman and Derbyshire1991). Some of the original structure will be retained and some will turn into ash that gives rise to individual chemical properties. The traditional feedstock for biochar is woody biomass that consists mainly of cellulose, hemicelluloses and lignin. It has been shown that there is a notable difference in the physical and chemical properties of biochar prepared from a common woody material at different stage of growth (Wingate Reference Wingate2008). This implies that feedstock selection is very specific and should take account of the end use of the biochar.
It is a traditional practice by gardeners in Malaysia to make ‘tanah bakar’, or burned soil, to improve soil fertility. Generally, a shallow pit is dug and waste from the garden or household is burned in the pit. This process is repeated a few times before blackened soil or ‘tanah bakar’ can be scraped from the pit and used for enriching other soils, instead of using mineral fertilisers. This traditional practice is similar to those found in the Amazon that give rise to the dark fertile soil of Terra Preta (Steiner et al. Reference Steiner, Teixeira, Woods, Zech, Woods, Teixeira, Lehmann, Steiner, WinklerPrins and Rebellato2009). Biochar has also been used as a soil conditioner. Its high pH and its cation exchange capacity are valuable in ameliorating acidic soil (Glaser et al. Reference Glaser, Lehmann and Zech2002). However, the direct impacts of biochar production on the soil conditions around the production site have rarely been evaluated (but see studies by Chidumayo (Reference Chidumayo1994) and Ogutunde et al. (Reference Oguntunde, Fosu, Ajayi and van de Giesen2004)).
In recent years, many studies have reported that biochar is able to remove heavy metals either from contaminated water or from soil. It has been used to sequester copper (Uchimiya et al. Reference Uchimiya, Klasson, Wartelle and Lima2011), in the immobilisation and retention of arsenic, cadmium and zinc (Beesley & Marmiroli Reference Beesley and Marmiroli2011) and in reducing the bioavailability of lead (Chen et al. Reference Chen, Zhu, Ma and McKay2006). Biochar has great potential to remediate contaminated soil. Biochar also qualifies as a low-cost adsorbent, defining low-cost adsorbents as those that originate from a by-product of other process or from waste, are abundant in nature and are produced with the lowest possible cost. The uses of low-cost adsorbent for the adsorption of heavy metals in contaminated waters have been widely reviewed (e.g., Bailey Reference Bailey, Olin, Bricka and Adrian1999; Babel & Kurniawan Reference Babel and Kurniawan2003; Gupta Reference Gupta, Carrot and Ribeiro-Carrot2009).
This paper studies the direct impact to the surrounding earth wall of traditional biochar production in an earth pit. The production process was later repeated using TGA-FTIR and the smoke and gases produced during the charring were assessed to evaluate the environmental impact of traditional palm frond biochar production. The palm frond biochar produced in the laboratory was also assessed for its potential as an additive in soil remediation.
1. Materials and method
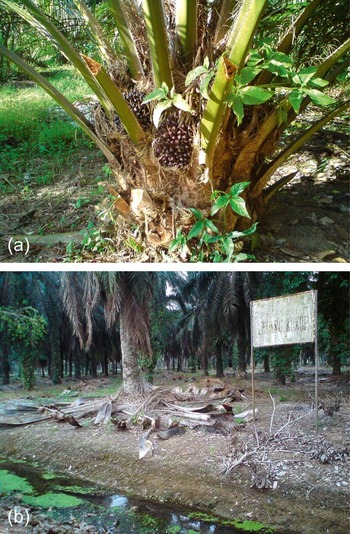
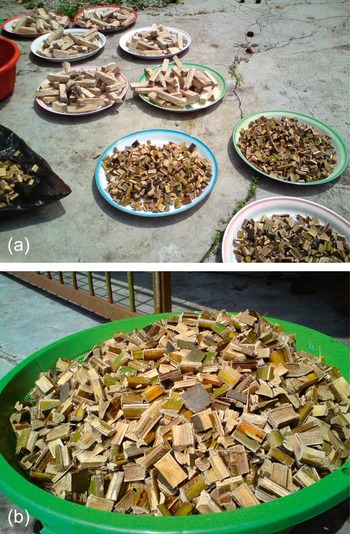
Our production of palm frond biochar followed the traditional practice of making ‘tanah bakar’, but involving the pit-burning of palm fronds instead of waste. Palm fronds were obtained from 3–3·5 year-old oil palm trees (Fig. 1). The frond was about 0·5 cm thick and trimmed into 2·5-cm widths. The fronds were further cut into two different lengths of 25 cm and 2·5 cm and left to dry in the sun to reduce moisture content, to facilitate the carbonisation process (Fig. 2).
Palm oil trees: (a) 3–4 year oil palm oil tree; (b) Palm frond left at the bottom of the palm oil trees to dry and decompose.

(a) Palm fronds drying in the sun. (b) Palm frond (2·5 cm length).

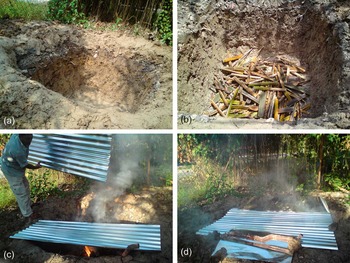
The earth pit of approximately 1 m×1 m×1 m was dug manually in a silty clay soil. Figure 3 illustrates the carbonisation process. Easily combustible garden waste materials, such as dried leaves and twigs were placed at the bottom of the pit. Four bricks measuring approximately 10 cm in height were located at each corner of the pit and metal wire mesh placed on top of the mesh to cover the combustible materials. The 25-cm fronds were loaded directly onto the metal wire mesh and the 2·5-cm fronds were wrapped with several layers of aluminium foil before placing them in as well. More leaves and twigs were put on top of the palm fronds and the fire was started at the bottom of the pit. The pit was covered with tin alloy roofing sheets, and the cover was adjusted to allow air into the pit. This resulted in the 25-cm fronds being completely burned to ashes, but the aluminium-wrapped fronds were converted to biochar after four hours. Irreversible THERMAX Colotemp Crayons were used every hour to determine the approximate carbonisation temperature. Immediately after the pit was dug (prior to the burning), and again after the first carbonisation process, soil samples were collected for physical and chemical analysis based on BS 1377: Part 2 & 3: 1990.
(a) Earth pit (b) Palm oil frond in the pit (c) Covering the earth pit zinc alloy once fire is lighted (d) Fully covered earth pit.

The palm frond carbonisation process was assessed in the laboratory using Perkin Elmer STA 6000 and Perkin Elmer Spectrum 100 FTIR spectrophotometers, with an initial heating rate of 40oC/min to 150oC. The temperature was held constant at 150oC for ten minutes before it was increased at a rate of 10°C/min to 610oC. The flow rate of the N2 carrier gas was set at 50 mL/min. The laboratory carbonisation process aimed to produce biochar for characterisation and a metal adsorption isotherm study, and was undertaken by wrapping the frond in several layers of aluminium foils and heating it at 320oC for four hours using a muffle furnace. The modified compulsive exchange method (Gillman & Sumpter Reference Gillman and Sumpter1986) was used to determine cation exchange capacity, and the pH was determined by heating 0·5 g of biochar in 50 ml water at 90oC with continuous stirring, cooling to room temperature and measuring with a 5500 EUTECH pH meter using an FET solid electrode calibrated with standard buffer solutions. Comparison on the type and amount of cation released by the biochar was conducted by immersing 1 g of each biochar in deionised water and agitating it at 150 rpm for one hour. The solution was filtered by using filter paper Whatman No 1 and tested using the Perkin Elmer 7000 Inductive Couple Plasma Optical Emission Spectrophotometer for Na+, Mg+, K+ and Ca+.
Characterisation of the palm frond and its biochar was also carried out using the FTIR spectrophotometer, followed by the scanning electron microscope JEOL 5800 SEM. Surface area determination was done by the BET (Brunauer–Emmett–Teller) nitrogen adsorption machine TriStar 3000 V6.04 A.
Metal isotherm studies were conducted by immersing 1 g of each biochar in different concentrations of Pb(NO3)2, Cu(NO3)2, Ni(NO3)2 and ZnCl2 agitated at 150 rpm until equilibrium was reached. The solution was filtered by using filter paper Whatman No 1 before testing using the Perkin Elmer 7000 Inductive Couple Plasma Optical Emission Spectrophotometer.
2. Results
2.1. Biochar production
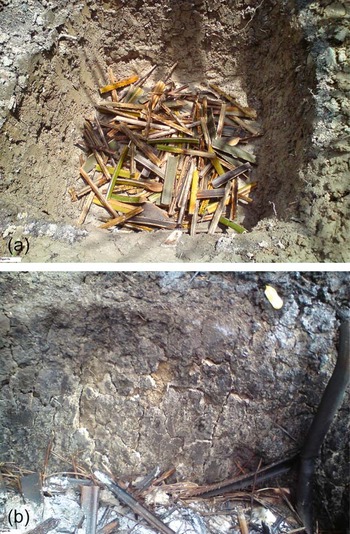
The carbonisation temperature in the earth pit was found to be approximately 320oC. Figure 4 shows the impact of fire on the surrounding earth pit wall.
Impact of carbonisation on the earth pit wall: (a) before carbonisation; (b) after carbonisation.

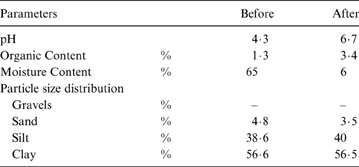
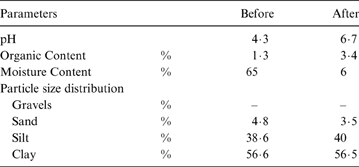
Table 1 illustrates the basic physical and chemical characteristics of the soil before and after carbonisation. The particle size distributions of the soil remained essentially unchanged, unlike in the finding of Ketterings et al. (Reference Ketterings, Bigham and Laperche2000) in a study of the effects of ‘slash and burn’ on forest soil. However, this dissimilarity may have been due to heat loss into the soil, as a function of not just surface temperature but also of the duration of heating, soil water content and soil pore distribution (Steward et al. Reference Steward, Peter and Richon1990). Some of the fine sand might also have disintegrated, increasing the silt content. Increase in organic content was as foreseen (Steiner et al. Reference Steiner, Teixeira, Woods, Zech, Woods, Teixeira, Lehmann, Steiner, WinklerPrins and Rebellato2009) and there was a noticeable rise in pH. Soils under charcoal-making kilns have been reported to have a pH of 7·0 compared to that of the surrounding soil of 5·5 (Chidumayo Reference Chidumayo1994) and 7·6 as compared to 5·8 (Oguntunde et al. Reference Oguntunde, Fosu, Ajayi and van de Giesen2004). However, Steiner et al. (Reference Steiner, Teixeira, Lehmann, Nehls, deMacedo, Blum and Zech2007) reported that the addition of biochar to the soil only increases the pH value by 0·12 units, and Lehmann et al. (Reference Lehmann, da Silva, Steiner, Nehls, Zech and Glaser2003) found that the pH value of soil in a pot experiment increased by 0·36 and 0·75 units after the addition of biochar. Tryon (Reference Tryon1948) reported an increase in pH value from 5·15 to 6·10 only after the addition of 45% charcoal. The increases in soil organic matter and pH values may have been the reasons for the soil becoming more fertile when biochar is used to ameliorate acidic soil.
Chemical and physical characteristic of soil surrounding the earth pit before and after the carbonisation process.
2.1.1. TGA-FTIR of carbonisation process
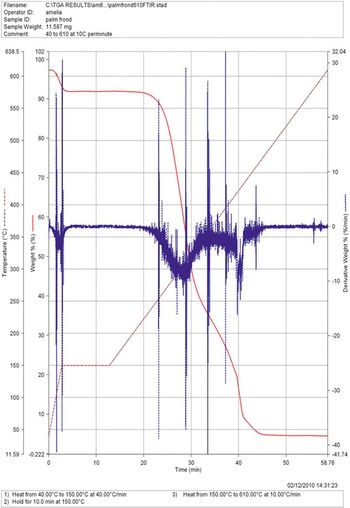
Figure 5 shows the TGA curve and weight percent derivative of palm frond degradation. It shows that the first weight loss occurred at 100oC with moisture loss.
Thermogravimetric curve of temperature (oC), weight percent (%) and weight derivative (%/min) against time (min) during palm frond carbonisation. The weight derivative identifies the point where weight loss is most apparent.

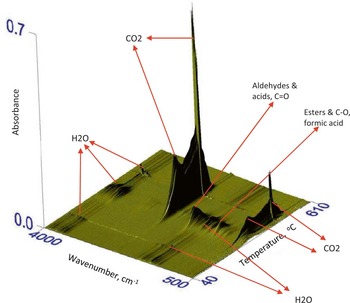
The evolving moisture can also be detected in the FTIR 3D diagram (Fig. 6). There are two peaks of the O–H functional group, stretching at 3600–3000 cm–1 and bending at 1440–1400 cm–1, that signify the presence of water. Moisture continues to evolve up till 150oC, when the weight loss halts (Fig. 5). The weight loss resumes at approximately 220oC, when CO2 and water begin to leave the system again. The evolution of CO2 is identified around the 2200–2400 cm–1 region (Fig. 6), due to the stretching of C=O, and at 666 cm–1. Yang et al. (Reference Yang, Yan, Chen, Zheng, Lee and Liang2006) found that hemicelluloses started to degrade in the 220–315oC temperature range and that depolymerisation of cellulose occurs between 250oC and 350oC. Significant mass loss was observed in the TGA curve. At 250oC, gases other than CO2 also start to de-gas. These gases were detected in the FTIR at the wavelength 1792 cm–1 (aldehyde), and at 1170 cm–1 due to the stretching vibration of C–O–C in ethers or esters. These gases continued to evolve until the temperature reached 350oC. Three other significant mass loss peaks also occurred at 315oC, 350oC and 400oC. These are the periods where amorphous carbon matrix is created during thermal degradation of lignocellulosic biomass. The matrix later grows into a polyaromatic graphene sheet (Paris et al. Reference Paris, Zollfrank and Zickler2005). Large releases of CO2 and water in the FTIR spectrum at 450oC correspond to the final weight reduction to 5% of the palm frond's original weight. This weight remained unchanged until the final temperature of 610oC.
TGA-FTIR 3D diagram of gas evolution during carbonisation of palm frond.

2.2. Characterisation of palm frond biochar
2.2.1. FTIR, SEM and BET
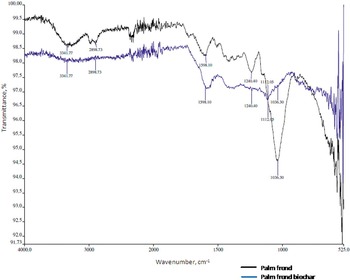
The FTIR spectra of palm frond before and after carbonisation were compared against those in the Infrared and Raman Characteristic Group Frequencies, Tables and Charts (Socrates Reference Socrates2004). IR spectra of palm frond before carbonisation show two distinctive peaks: one at 3341 cm–1 that is indicative of stretching of the O–H functional group; and one at 2898 cm–1 that is cause by the carbon backbone C–H stretching (Fig. 7).
FTIR spectrum of palm frond and palm frond biochar.

The absorption bands at 1240 cm–1 were also observed, arising from the stretching vibration of the C–O group, and, together with symmetrical C–O–C stretching at 1036 cm–1 and 1242 cm–1, confirm the presence of either esters or ethers. These peaks are eliminated after carbonisation. The existence of an aromatic skeleton vibration C–C bond at 1598 cm–1 is clearly visible in the palm frond and it remains intact after carbonisation. This signifies that the aromatic ring of lignin did not disintegrate during carbonisation of the biochar at a temperature of 320oC.
The palm frond biochar was prepared by heating it up to about 320oC. At this temperature, it still retained approximately 50% of its final weight. Based on Yang et al. (Reference Yang, Yan, Chen, Zheng, Lee and Liang2006), the cross-point between hemicelluloses and cellulose degradation is at 315oC. At 320oC, most of the hemicelluloses would have fully disintegrated, but depolymerisation of cellulose would still be incomplete. Most of the lignin aromatic structure would still be available, and this can be seen from the still-intact aromatic vibration at 1598 cm–1 in the biochar's FTIR spectrum. Lignin is the main component in any char production (Yang et al. Reference Yang, Yan, Chen, Zheng, Lee and Liang2006).
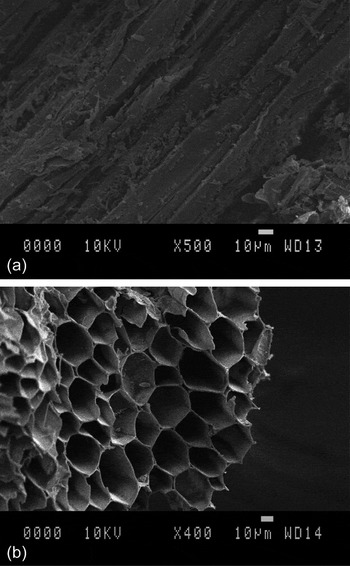
The scanning electron microscope (SEM) images in Figure 8 show palm frond before and after carbonisation; the major components of palm frond would be cellulose, hemicelluloses and lignin (Khalil et al. Reference Khalil, Jawaid, Hassan, Paridah, Zaidon and Hu2012). SEM cross-section images of the biochar show the existence of macropores (>50 nm) that most probably originate from lignin. Lignin has been reported to fuse on pyrolysis and forms macropores of ∼25 µm to ∼100 µm in size (Raveendran et al. Reference Raveendran, Ganesh and Khilar1996).
SEM images of palm frond: (a) before carbonisation; (b) after carbonisation.

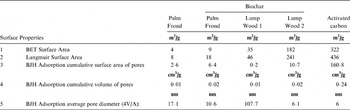
Biochar's porous structure consists of micropores (<2 nm), mesopores (2–50 nm) and macropores (>50 nm) (Wildman & Derbyshire Reference Wildman and Derbyshire1991). The adsorption of small molecules such as gases and common solvents occur at the micropore level, but larger molecules such as colours and probably other organics are adsorbed in mesopores. The BET (Brunauer–Emmett–Teller) surface area and BJH (Barret–Joyner–Halenda) pore volume and width are reported for the palm frond biochar in Table 2. The BET surface area of the palm frond was originally 4 m2/g, and it increased to 8 m2/g upon carbonisation, which is low compared to lump wood charcoal and activated carbon. The average pore diameter measured by BJH adsorption is 10 nm (mesopores).
Surface properties of palm frond, palm frond biochar and the two lump wood biochars.

2.2.2. pH and CEC
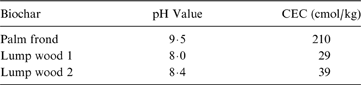
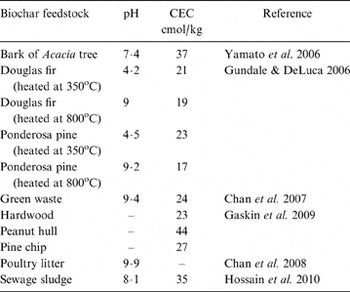
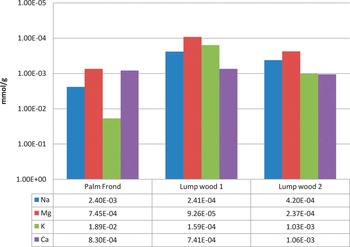
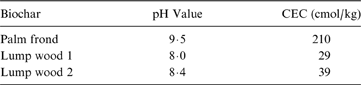
Palm frond biochar has a high pH of 9·5 and a CEC value of 210 cmol/kg (Table 3). The pH and cation exchange capacity of biochar from several sources has been reported by many (Table 4). However, due to differences in the methods of testing, it may not be practical to compare results. Palm frond biochar releases very high concentrations of cations as compared to the other two biochars (Fig. 9), especially K+ ions.
pH and CEC value of palm frond biochar compares to the two lump wood biochar.
pH and CEC value of several biochars.

Comparison of the type of cations released by each biochar after one hour agitation.

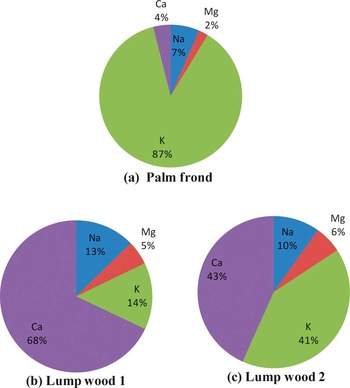
The ratio of K+ released is relatively high as compared to Mg2+, Na+ or Ca2+ ions (Fig. 10a). This ratio is slightly different for lump wood 1, where Ca2+ is the major cation released (Fig. 10b), and lump wood 2, where the ratio between Ca2+ and K+ is about the same as that of the major cations (Fig. 10c). The high K+ ions released from the palm frond biochar may have been due to its original materials. Potassium fertiliser is used extensively in the cultivation of oil palm trees, and the ions might have accumulated in the fronds.
Percentage of cations produced from (a) palm frond (b) lump wood charcoal 1 (c) lump wood charcoal 2.

2.3. Sorption capacity of palm frond biochar
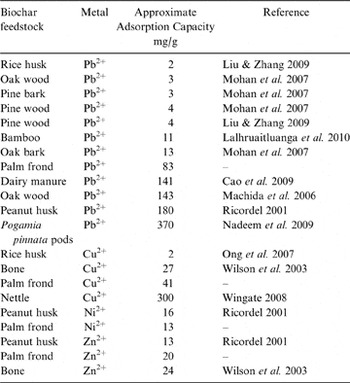
Adsorption isotherm studies were conducted to estimate the maximum adsorption capacity of palm frond biochar for four heavy metals (Pb2+, Cu2+, Ni2+ and Zn2+) at 25oC as compared to two lump wood charcoals; activated carbon was used as a reference adsorbent. The Langmuir (Langmuir Reference Langmuir1918) and Freundlich (Freundlich & Helle Reference Freundlich and Helle1939) models were used to fit the experimental data. Table 5 shows that the experimental data fit the Langmuir model better than they do the Freundlich model, with correlation coefficients of palm frond biochar adsorption for all metals being ≥0·92. The model predicts the following adsorption rates: Pb2+ 83·3 mg/g; Cu2+ 41·4 mg/g; Ni2+ 13·0 mg/g; and Zn2+ 19·7 mg/g. These predictions correlate well with the following experimental data on adsorption rates: Pb2+ 83·7 mg/g; Cu2+ 47·5 mg/g; Ni2+ 13·1 mg/g; and Zn2+ 19·7 mg/g. The palm frond biochar has affinities with metal ions in the following order: Pb2+>Cu2+>Zn2+>Ni2+, which is a similar order to those reported for lignin (Guo et al. Reference Guo, Zhang and Shan2008). The biochar was produced at the maximum temperature of 320oC and, based on cellulose, hemicelluloses and lignin pyrolysis curves, approximately 80–90% of the original cellulose and lignin would still be available in the biochar (Yang et al. Reference Yang, Yan, Chen, Zheng, Lee and Liang2006). The existence of aromatic vibration at 1598 cm–1 in the biochar's FTIR spectrum, similar to that of the original palm frond, signifies the availability of a lignin aromatic benzene ring. Table 6 compares the adsorption capacity of palm frond biochar with other reported findings. The adsorption rates of Pb2+ by the two lump wood biochars were comparable to those cited in the literature for biochars made from woody material (Machida et al. Reference Machida, Yamazaki, Aikawa and Tatsumoto2006; Mohan et al. Reference Mohan, Pittman, Brick, Smith and Yancey2007; Liu & Zhang Reference Liu and Zhang2009).
Summary of adsorptions capacity with correspondent correlation coefficient R2 of the fitted linear curve.

Approximate adsorption capacity of palm frond biochar for heavy metals compares to those of other feedstock.

3. Discussion
The results of this study show that the heat and soots from the burning of palm frond in the earth pit change the pH value and organic content of the earth wall, resulting in a more fertile soil compared to the existing one. The effect on the soil texture is not noticeable, which may reflect the short duration of the fire. Replication of the carbonisation process in the TGA–FTIR indicates that the materials remaining in the biochar are mainly lignin and some cellulose, as is confirmed by the FTIR spectrum of the biochar. The FTIR spectrum from TGA–FTIR analysis also identifies the type of gases released in the smoke during charring of the palm frond as carbon monoxide, esters, aldehyde and ethers. The carbonisation process normally produces substances that can be harmful and pollute the environment (FAO 1983), and simple precautions, such as locating the charring area away from residential areas, will minimise exposure. The pH, CEC and type of cations released indicate whether the biochar would be beneficial as a soil ameliorant. SEM and BET analyses of the structural properties of palm frond biochar indicate the pore types available, which is important for the study of heavy metal adsorptions. Heavy metal adsorption of palm frond biochar showed similarity to the adsorption of heavy metals by lignin.
4. Conclusions
Palm frond biochar has great potential to adsorb heavy-metal contaminants with minimum production costs. It has a porous structure, with large numbers of mesopores that may also be beneficial in adsorbing organic pollution. It has high pH and CEC values that can be used to ameliorate acidic tropical soil. High soluble K+ in the biochar may also prove effective as a source of slow-release fertilisers in tropical countries that receive high rainfalls.