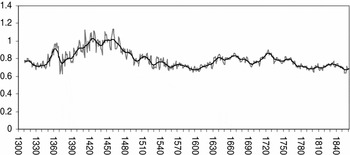


While scholars agree on the rise of product in western Europe over the last two centuries, its trend in the pre-modern age is still poorly known. The opinion of some scholars is that, from 1000 onwards, the western European economy exhibits a slowly rising trend (Maddison Reference Maddison2001, Reference Maddison2003, Reference Maddison2007). Others, by contrast, retain that an age of slow growth, occurring from about 1000 until 1300, was followed by a period of overall stability characterised by a modest rise in some regions and decline in others. In the early modern European economies stability, rather than growth, prevailed (Clark Reference Clark2007).
The Italian case study can contribute to the analysis of pre-modern output. Although the series of data on Italian population, urbanisation, prices and wages, both urban and rural, as from the first years of the fourteenth century, already suggest an outline of the development of the whole economy, however, they allow for further investigation. Here, as a summary view of these, a series of per capita and aggregate product will be built and subsequently tested.Footnote 1
The present reconstruction is based on data concerning the centre and the north of Italy: from the southern borders of the present regions of Tuscany, Umbria and Marche up as far as the Alps (161,000 km2 out of the total of 310,000 km2). Many more quantitative data are available for this part of Italy than for the south, especially before the eighteenth century. I do not intend to suggest, however, that the following GDP reconstruction is representative of the Italian trend as a whole. It is based on data referring to the centre and the north and only represents this part of Italy. Because Italy existed as a single nation from 1861, late medieval and early modern historians do not divide what was united when they focus on the centre and the north. We lack definite evidence on the difference in the average income between north and south during the late Middle Ages and Renaissance. We know, however, that, if some economic disparity did already exist, it was quite modest. The economic north–south divide has been a consequence of modernisation and has deepened with the industrialisation of the northern regions (Daniele and Malanima Reference Daniele and Malanima2007; Felice Reference Felice2007; Malanima Reference Malanima2006).
I will use an indirect method and will follow a two-step procedure, first estimating the agricultural product from the demand side (Section 1) and then the non-agricultural output (Section 2), which is to be added to that of agriculture (Section 3). Subsequently, I will try to test the methods and results (Appendix 1). In recent years, research on Italian national accounting after the Unification of the country in 1861 has notably progressed and we now have series of agricultural and industrial output from 1861 until 1913. I will connect my series to these and build a long-term outline from 1300 until 1913.Footnote 2
1. Agricultural output
1.1. The method
A basic assumption of our method of estimating agricultural output is the equality between consumption of agricultural goods and their production in the area under examination. This equality allows us to estimate output through consumption. In a pre-modern agricultural system such as the Italian one, where the imports and exports of agricultural products were relatively modest, demand for agricultural goods can actually be assumed to equate agricultural product. The centre and north of Italy imported wheat and raw materials from the south and from other non-Italian regions. They also exported agricultural goods. The size of net imports or exports was negligible with regard to the agricultural product of the area.Footnote 3
To estimate per capita agricultural output, I will first calculate an index of the demand for agricultural goods as determined by changes in wages, agricultural prices and industrial prices. According to the previous equality consumption/output, the series of demand will represent output as well. Subsequently, I will connect such an index to the series of agricultural per capita output available for the following period, starting from 1861. This procedure, from the side of consumption, has been employed several times in economic historical research, although generally for shorter periods of time (Crafts Reference Crafts1985, pp. 39–42; Jackson Reference Jackson1985; Prados de la Escosura Reference Prados de la Escosura1988, pp. 95ff., and Reference Prados de la Escosura1989; Allen Reference Allen2000).Footnote 4
The procedure is based on the following equation for demand:

where: Qa is per capita consumption of agricultural goods; W is the real wage per day or wage rate; Pa is the series of real agricultural prices (divided, that is, by the consumer price index); Pi is the series of real non-agricultural prices, and α, β and γ are the elasticities, with α > 0, β < 0 and γ > 0. While agricultural consumption depends positively on real wages and non-agricultural prices, it depends negatively on the level of prices of agricultural goods.
By relying on the Slutsky–Schultz relation, we know that the sum of the demand elasticity to prices and income is 0; that is, crossed elasticity is equal to the difference between agricultural price elasticity and income elasticity. Consequently W, Pa and Pi can be expressed in ‘real’ terms by dividing them by the consumer price index.Footnote 5
By taking the rates of variation (denoted by the low case) of equation 1 we obtain:

or, taking the logarithms: ln q = α ln w + β ln pa + γ ln pi where:

As for any pre-modern economy, our data on wages actually refer to wage rates per day, while we have no information about the number of actual working days (t) in a year. In equation 1, Q would therefore represent daily and not yearly consumption. We know, however, that the strategy of pre-modern working families was aimed at keeping consumption stable by varying the days of work in a year. As a consequence, labour time (t) counterbalanced the upward and downward movement of wage rate, i.e. peasants working less when wages were high and more when wages were low. A fall in W implied a rise in t and vice versa (Dasgupta and Bishwanath Reference Dasgupta and Bishwanath2005; Ranis Reference Ranis1997). Whenever wages per day diminished, women in particular were forced to work longer hours to meet the family needs. This strategy, implying a downward-bent labour supply as to wage rate, has been empirically ascertained in backward and developing economies. Whenever income is low, elasticity of labour supply to wage is negative (Ohtake, Takenaka and Yasui Reference Ohtake, Takenaka and Yasui2006). Otherwise stated: on a yearly basis, a remarkable variation in W is likely to provoke a small change in Q (the yearly demand for agricultural goods) since such a variation in W is partially or totally compensated for by the opposite change in t. If we assume a low coefficient for income elasticity in our calculations, we ‘incorporate’ in our results the effect on demand of agricultural goods deriving from changes in labour time. On a yearly basis, we can assume that wage is the product of wage rate (W) by the working days in a year (t). Equation 4 represents agricultural consumption elasticity with respect to wage per year (Wt):

It will hence be possible to draw information on working time from our series of GDP and observe that the working time ‘embedded’, so to speak, in the procedure I follow is in agreement with the theory (Appendix 1.3).
It may also be assumed that, since consumption of agricultural goods did not reveal drastic changes in the very long period under examination, based as it was on the same basket of commodities and primarily cereals (Malanima Reference Malanima2002, ch. VI), changes in the coefficients of elasticity must have been modest. We know that in Italy the elasticity of cereals and legumes with regard to prices and income remained stable even during the notable growth following World War II, while more expensive agricultural goods underwent considerable changes in elasticity coefficients (Messori Reference Messori1992, pp. 56ff.).Footnote 6
In the following sections, the basis of our indices is always the period 1420–40. These two decades are an epoch of low prices for which there is plenty of quantitative information.
1.2. A consumer price index
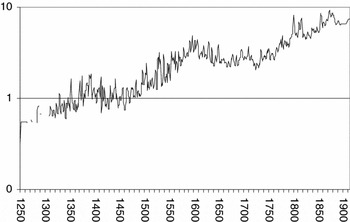
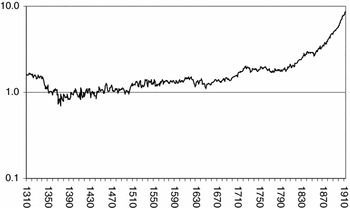
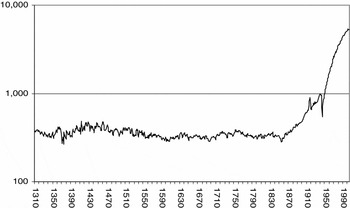
A Laspeyres consumer price index, based on Tuscan prices from 1250 to 1606, and on prices in Lombardy from 1606 until 1861,Footnote 7 presents a long-term trend which is on the whole similar to that of price indexes elaborated for other European countries (Appendix 2, col. 1)(Figure 1).
Consumer price index 1250–1913 (1420–40 = 1; vertical axis in log)

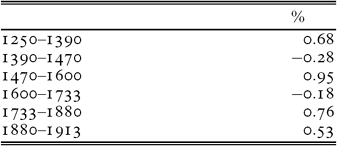
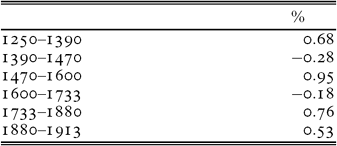
Prices in Italy rose almost seven times from 1420–40 until 1861 and seven and a half times until 1913. For almost six centuries, from 1310 to 1861, prices rose on average at the low rate of 0.35 per cent per year (Table 1).
Yearly rates of increase of the price index 1250–1913 (%)
Sources: Malanima (Reference Malanima2002, app. III; Reference Malanima2007); Fenoaltea (Reference Fenoaltea2002) (years 1861–1913).
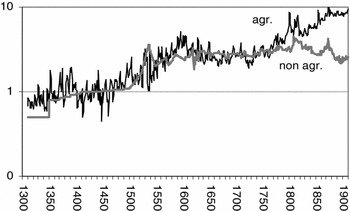
Common to Italy and other European regions is the much sharper rise in agricultural prices (seven- to eightfold from the fifteenth century until the end of the nineteenth century) compared to that of manufactured goods (only two and a half to three times) (Figure 2).Footnote 8 As in England,Footnote 9 in central–northern Italy as well, non-agricultural prices began to diverge markedly from those in agriculture from the eighteenth century on.
Price indices of agricultural and non-agricultural goods 1300–1913 (1420–40 = 1; vertical axis in log)

In pre-modern ages, it is always doubtful how representative prices in a particular region can be, when compared with the price movement in a wider area. This is particularly true in a period, such as the one we are dealing with, when market integration is limited. The consumer price index affects the whole reconstruction of the yearly product. How representative are these annual data with regards to the economy of central and northern Italy?
There is no doubt that, within a particular Italian state, such as the Republic of Florence and Duchy and Grand Duchy of Tuscany, the yearly correlation is very high.Footnote 10 The available data only allow us to examine price correlation for the main series in pre-modern consumer price indexes, i.e. wheat prices (whose weight in any consumer price index is remarkable). We know that some particular crises, such as those in 1590 or 1645–8 or 1815–17, involved a wide area and are documented by the available series referring to different Italian states. When the series are compiled using the same statistical methods, the correlation is higher than expected. A comparison of wheat prices in two distant cities such as Pisa, in Tuscany, and Udine, in the Republic of Venice, from 1500 until 1821, exhibits a correlation of 0.913.Footnote 11
1.3. Prices and population
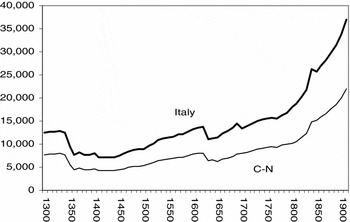
A clear direct relationship exists between the long-term trend of prices and the population movement in Italy from the late Middle Ages onwards (Beloch Reference Beloch1937–61; Del Panta, Livi Bacci, Pinto and Sonnino Reference Del Panta, Livi Bacci, Pinto and Sonnino1996; Galloway Reference Galloway1994; Malanima Reference Malanima2002, app. 1) (Figure 3).
Population in Italy and central–northern Italy (C-N) 1300–1913 (decadal values)

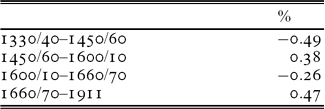
The population of Italy was 12–13 million in 1300 (7.7 million in the centre–north), but fell to 7.5–8 million (4.5 million in the centre–north) in the first half of the fifteenth century, recovering from 1450 to 13.3 million in 1600 (7.8 million in the centre–north)Footnote 12 (Table 2). From the end of the seventeenth century, a modern long-term increase took place in both Italy and elsewhere in Europe. At that time, the inhabitants of Italy still numbered around 13 million, as in 1300. From then on a rise occurred which intensified after 1820. By 1861, the population was 26 million and by the start of World War I it had reached 37 million.
Yearly rates of population growth in the centre and north of Italy 1330–1911 (%)
Sources: Del Panta et al. (Reference Del Panta, Livi Bacci, Pinto and Sonnino1996), Malanima (Reference Malanima2002, app. I).
It can be seen that the decrease in population, between 1348–1450, due to the arrival of the Black Death and subsequent plagues, did not determine a sudden decline in prices. A fall took place after some decades (Munro Reference Munro2004), followed by a recovery when population once again increased after 1450. A new stagnation in prices occurred after the plagues of 1629–30 (in the centre and north) and 1656–8 (in the south). Prices rose again in the eighteenth century, with the new demographic growth.
1.4. Wage rates
Rural and urban daily wage rates dating from the first decades of the fourteenth century are available for the centre and north of Italy (Malanima Reference Malanima2002, app. IV; Reference Malanima2007; Wages in Italy 1290–1990 in www.paolomalanima.it). The wages of masons are assumed to be representative of urban wages.Footnote 13 Rural wages refer to labourers.
It is known that waged labour was very common within the cities. In the countryside it was different. Many peasant families survived on the remaining part of the harvest after having paid the rent (e.g. in the case of sharecroppers). We can therefore assume that, even when wage was not the prevailing form of income, competition among workers pushed towards the equalisation of labour incomes. The reconstruction of the agricultural contracts in the Italian countryside, which had become more and more unfavourable for the peasant population since the late Middle Ages, fits the declining trend of rural wage rates well (Giorgetti Reference Giorgetti1974).
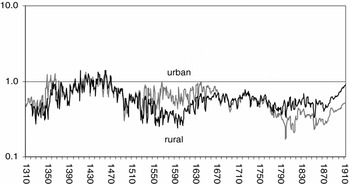
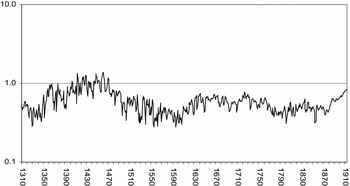
In real terms, wage rates witnessed a downward movement from the fifteenth century onwards; although with some typical differences between town and countryside (Figure 4).Footnote 14 During the sixteenth century, together with the development of urban activities, urban wages rose in comparison to rural wages, whereas, from the seventeenth century onwards, a period of de-urbanisation and weakening of urban industrial activities, these declined more than rural wages.Footnote 15 An overall index of agricultural and industrial wages can be compiled on the basis of the previous curves of urban and rural wage rates, weighted by the urbanisation rate until 1861 and by data on employment in industry and agriculture from then onwards (Figure 5).
Urban and rural real wage rates 1310–1913 (1420–40 = 1; vertical axis in log)
Sources: Malanima (Reference Malanima2002, app. IV; Reference Malanima2007); Wages in Italy 1290–1990 in www.paolomalanima.it

Index of real wage rates 1310–1913 (1420–40 = 1; vertical axis in log)
Sources: Malanima (Reference Malanima2002, app. IV; Reference Malanima2007); Wages in Italy 1290–1990 in www.paolomalanima.it

A downward trend characterises the real wage rate from the fifteenth century onwards. On the eve of World War I, wages per day were still lower than they had been 500 years earlier, but higher than prior to the Black Death. However, this does not mean that wages (that is wage rates multiplied by working days) in 1913 were still lower than five centuries before.
An inverse relationship between this trend and that of population is apparent. Wages recover whenever population declines, as in the fifteenth century, or stagnates, as in the seventeenth, whereas they decline in periods of population growth, such as during the early fourteenth, sixteenth and eighteenth centuries.
1.5. Interest and rent
Other kinds of income are not included in our calculations. C. Alvarez-Nogal and L. Prados de la Escosura (Reference Alvarez Nogal and Prados de la Escosura2007a, Reference Alvarez Nogal and Prados de la Escosura2007b) wondered if the introduction of agricultural consumption deriving from capital and land incomes would modify the indirect calculation of agricultural output based on wages. Some hypothetical calculation of the likely changes to our index of agricultural consumption may be made whenever rent and interest are included.
Let us assume that income from labour represents 70 per centFootnote 16 of the total and incomes from land and capital 20 and 10 per cent respectively. Since we are interested in the demand of agricultural products, we should now compute an index where any form of income is weighted on both the percentage on total output of any production factor and the percentage of agricultural consumption on any form of income. Let us assume that agricultural consumption is equal to 80 per cent of labour income, 10 per cent of capital income and 10 per cent of land income. To our knowledge, the order of magnitude of these data is not unrealistic (Malanima Reference Malanima2009, ch. VII) and small changes in these coefficients do not compromise our calculations.
To calculate yearly agricultural consumption, the final index would be as follows:

where the first coefficient refers to the percentage of income on total output, and the second to the proportion of agricultural consumption on that specific form of income (wage in the first case, rent in the second and interest in the third). The result obtained, of about 60 per cent (56+2+1) of total income devoted to the purchase of agricultural goods, is plausible. The influence on the result deriving from the introduction of rent and interest is negligible (around 5 per cent: 3/59). Even allowing for a decrease of wage in GDP and an increase of the other forms of income, the final change would be hardly different.Footnote 17
1.6. Agricultural GDP
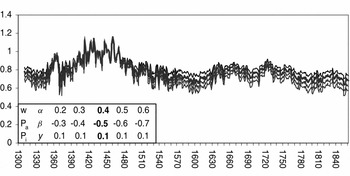
Following the method presented in Section 1.1, through the series of prices and wages it is now possible to outline the curve of per capita agricultural product, thereby testing the coefficients already used in this kind of research (Figure 6).
Sensitivity test of per capita agricultural product 1310–1861 (1420–40 = 1)

Allen, in his estimate of agricultural productivity in Europe, assumes (cross) price elasticity for non-agricultural goods of 0.1, price elasticity for agricultural products of –0.6 and income elasticity for agricultural products of 0.5. Other authors use slightly different coefficients, with income elasticity ranging from 0.3 to 0.9.Footnote 18 I finally chose the following set of values for the elasticity respectively regarding wage, real prices of agricultural goods and real prices of non agricultural goods: 0.4, -0.5 and 0.1. This choice is supported by the level of per capita agricultural GDP in the period from 1861 to 1913 (Federico Reference Federico2003b).
Hence, we can write:

The final result is presented in Appendix 2, col. 2, and Figure 7.
Index of per capita agricultural GDP 1310–1861 (1420–40 = 1)

If a comparison is made between the first half of the fifteenth century, when the curve of per capita agricultural product reached its highest level, and the period between the end of the eighteenth century and the first half of the nineteenth century, we notice a 30 per cent fall. In the first half of the nineteenth century, per capita GDP was 10 per cent lower than in the first half of the fourteenth century. Decline characterised the trend of agricultural product.
Was this decline counterbalanced by the rise of the non-agricultural sectors?
2. Non-agricultural product
2.1. Indirect evidence: urbanisation
For the period before 1861 an estimation of the non-agricultural product is, once again, hard to make from the supply side. Direct information on the level and trend of output in specific industrial sectors and trade in particular cities can only roughly outline the non-agricultural product and is not sufficient for the reconstruction of a continuous series for the centre and north of Italy as a whole. Only from 1861 until the eve of World War I, can we make use of direct series of product in industry (Fenoaltea Reference Fenoaltea2001, Reference Fenoaltea, Ciocca and Toniolo2003b, Reference Fenoaltea2003c, Reference Fenoaltea2006; Ciccarelli and Fenoaltea Reference Ciccarelli and Fenoaltea2009).
We know that in the thirteenth and early fourteenth centuries Italy, and especially central and northern Italy, was advanced. We also know that industry and trades weakened during the fifteenth century (Lopez and Miskimin Reference Lopez and Miskimin1962; Romano Reference Romano1971), recovered in the sixteenth century (Braudel Reference Braudel1966), but declined in the seventeenth century (Cipolla Reference Cipolla1952; Romano Reference Romano1971), rising again in the eighteenth and nineteenth centuries, thanks especially to the spread of the silk industry (Federico Reference Federico1994; Battistini Reference Battistini2003 and Reference Battistini2007, p. 305).
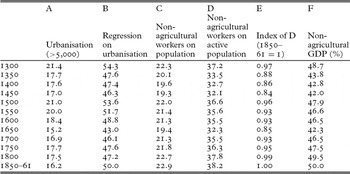
Urbanisation rates reflect this trend; although not perfectly, as will be seen. When considering the centres with over 5,000 inhabitants, in 1330 the urbanisation rate in the part of Italy here in question was 21.4 per cent, while in 1861 it was 16.2 (Table 3, col. A).Footnote 19 It diminished in the fifteenth and seventeenth centuries, that is when, as the literature on the topic suggests, the non-agricultural product also diminished, and it continued to do so from 1750 until 1861.
Urbanisation (A), share of non-agricultural employment out of population (C) and working-age population (D), non-agricultural product out of GDP (B and F) in 1300–1850/61 (%)

Source: see text.
The problem is therefore to quantify output trends outside agriculture. Through a regression of the percentage of the product of the secondary and tertiary sectors on urbanisation rate after Unification (decadal data from 1861 until 1936), we can try to define the necessary coefficients for the estimation of non-agricultural output prior to 1861. After all, urbanisation rates subsequent to 1861 were not far from those of medieval and early modern Italy. The relationship between non-agricultural product (yna) and urbanisation (u) (percentage) is established through the following linear regression:
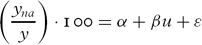
The result is:Footnote 20

2.2. Indirect evidence: employment
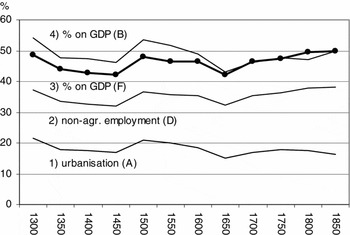
The results of the estimation based on equation 8 are reported in Table 3 (col. B) and in Figure 8 (4).
Urbanisation (1), share of non-agricultural employment out of working-age population (2), non-agricultural product out of GDP (3 and 4) in 1300–1850/61 (%)

Urbanisation is a good starting point for an estimation of non-agricultural output. It is not enough, however! Despite Italy not being a strong proto-industrial area within Europe, there was no lack of proto-industry (Belfanti Reference Belfanti, Ogilvie and Cerman1996). As previously recalled, the progress of the silk industry in particular involved an increase in the number of peasant families in non-agricultural employment (Battistini Reference Battistini1992, Reference Battistini1997, Reference Battistini2003). Raw silk output amounted to 1,300 tons per year in 1700 and reached 3,300 tons in 1850, while the share of central–northern Italy rose from 80 per cent in 1700 to 91 in 1850 (Battistini Reference Battistini2007, pp. 288, 314). While mulberry tree cultivation was a part of agricultural activity, the same did not apply for the several steps involved in the preparation of silk thread, which were industrial activities performed outside the cities.
Furthermore, the equation that correlates the non-agricultural product with urbanisation, based on the post-Unification experience, is influenced by rising productivity in the non agrarian sectors and the presence of non-urban industries (included in yna/y) at that time. Whenever used for the Italian economy before the eighteenth century, we run the risk of overrating the Italian non-agricultural activity in the late Middle Ages and early Modern Age. In fifteenth-century Tuscany, only 6 per cent of the rural families were involved in non-agricultural work (Herlihy and Klapisch Reference Herlihy and Klapisch-Zuber1978, ch. X).
Estimates of the non-agricultural rural population are scarce. The one proposed by R. Allen (Reference Allen2000) is plausible in the light of past and recent research. It suggests that the decline of urbanisation was compensated by the rise of the rural non-agricultural population from the late seventeenth century onwards, which reached 38 per cent of the whole workforce in the first half of the nineteenth century (Table 3, cols. C, D).Footnote 21 This level is supported by the information from the first censuses in post-Unification Italy, from 1861–71 (Maic 1866, 1876) until 1901 (Vitali Reference Vitali1970). In these censuses, the active population not employed in agriculture was 38–40 per cent of the total active population (Daniele and Malanima forthcoming).Footnote 22 We also know that in 1850–61 non-agricultural GDP was around 50 per cent.Footnote 23 It may therefore be established that between 1850 and 1861, 38 per cent of the labour force not employed in agriculture produced half the total output. If we compile an index with base 1861 = 1 (Table 3, col. E) and then multiply the percentage of product 1850–61 (that is 50) by that index, we can establish from 1300 the share of non-agricultural product out of total output. The procedure can be synthesised by the following formula:
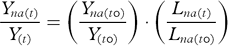
where Yna/Y is the share of non agricultural output out of total output (percentage), Lna is the share of labour force employed in non-agricultural sectors, Yna the non-agricultural product, and t0 is the period 1850–61 (the base of our index).Footnote 24 The same procedure is used for the year t and the years t-50, t-100 and so on for any half century. The result is a complete series of the share of non-agricultural product, out of total output, in the years of the index (represented by col. F in Table 3 and the thick curve 3 in Figure 8). It may be noted that the series based on the regression on urbanisation, represented in col. B and in Figure 8 by the curve 4, results in a higher level in the late Middle Ages. Two epochs of decline in non-agricultural output, the fifteenth and seventeenth centuries, are confirmed by our results. The recovery from 1750 onwards was supported by proto-industrial activities, especially the rural silk industry; while the role of the cities was of diminishing importance.
3. Per capita product
3.1. The calculation
Having computed both ya and yna/y, it is now possible to build the series of per capita product in its yearly values from 1310 until 1861 through the following equation, where (1 − yna) = ya:

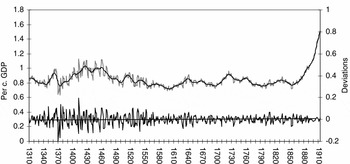
The result is the complete series of per capita GDP (Appendix 2, cols. 3, 4, 5).Footnote 25 In the following graph, it has been connected to a revised series of Italian GDP, over the period 1861–1913, based on the ongoing work of G. Federico (Reference Federico, Ciocca and Toniolo2003a, Reference Federico2003b) on the Italian agricultural product, of S. Fenoaltea (Fenoaltea Reference Fenoaltea2001, Reference Fenoaltea2003a, Reference Fenoaltea, Ciocca and Toniolo2003b, Reference Fenoaltea2003c, forthcoming) on the industrial product, and the results of V. Zamagni and P. Battilani on services in the years 1891 and 1911 (Zamagni for 1911 and Zamagni and Battilani for 1891, in I conti economici dell'Italia). In order to provide a homogeneous series, per capita product from 1861 has only been computed for the north and the centre (on the basis of Daniele and Malanima Reference Daniele and Malanima2007; Felice Reference Felice2007). Therefore, the series in the graph is not the national series (Figure 9).
Per capita GDP in central and northern Italy 1310–1913 (1420–40 = 1)

3.2. The trend
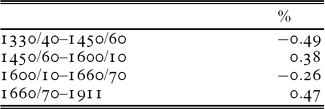
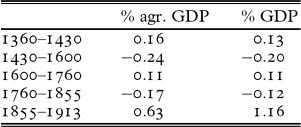
The resulting series witnesses a decline of about 20–25 per cent from 1420–40 until the decade between 1860 and 1870. If a comparison is made between the beginning of the series in 1310 and the first decade after Unification, the decline is about 10 per cent. This long-term decline was interrupted by two periods of recovery, the fifteenth century, and, albeit more modest, the century between 1650 and 1750 (Table 4). During both periods, the urban sectors declined, while agricultural output per capita grew.
Yearly rates of growth of per capita agricultural GDP and per capita GDP 1360–1913 (%)
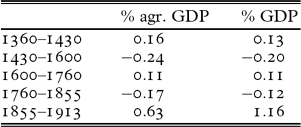
Note: rates of growth are computed from the Hodrick-Prescott trend.
Total product is heavily influenced by population trend. It grew from the second half of the seventeenth century and growth intensified during the nineteenth century, albeit with a period of stability during the second half of the eighteenth century and the first half of the following century (Figure 10).
Index of GDP in Italy CN 1310–1913 (1420–40 = 1; vertical axis in log)

3.3. Three epochs
If instead of looking at the rates of growth (as in Table 4), we look at the levels of per capita GDP, we single out the following periodisation:
1. From 1300 until the second half of the sixteenth century: the period of the Italian Renaissance. The Italian economy enjoyed a position of leadership in Europe. Its per capita GDP was high: between 1300 and 1570 the level was around 1,600 international 1990 PPP dollars.
2. From the second half of the sixteenth century until 1880: the period of the Italian decline. The level was generally 10 per cent lower. It was about 1,400 1990 international dollars in 1690–1710 (and therefore the same as that of the United Kingdom, but lower than that of England and Wales).Footnote 26 It was, however, about 30 per cent less than that of England in 1820.Footnote 27
3. From the 1820s and, more precisely, from the 1880s: the beginning of modern growth in Italy. While per capita GDP was about 1,400 1990 international dollars in 1850–80, it exceeded 2,000 in 1900; was 3,500 immediately after World War II and reached 20,000 in 2005.
In the long-term perspective, the Hodrick-Prescott filter helps single out phases lasting about 100 years (1392–1504; 1504–1606; 1606–98; 1698–1802), cycles of about 30 years and the short-term oscillations, whose intensity declined from the late Middle Ages onward.
3.4. The European background
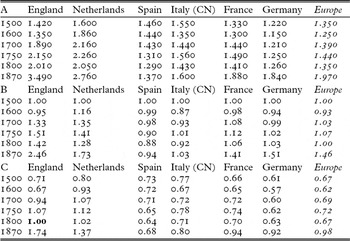
Data on GDP per head in western Europe help set the Italian case study in a wider perspective as from 1500 (Table 5).Footnote 28
Per capita GDP in six European countries and the whole of Europe 1500–1870 (1990 international Geary-Khamis dollars PPP) in A; indices 1 = 1500 in B and 1 = 1800 England in C

Source: Malanima (Reference Malanima2009, ch. VI).
Around 1500, central–northern Italy was the most advanced European region together with the Netherlands. During the sixteenth century, however, its position in the European hierarchy weakened. In 1600, the Netherlands were already much wealthier than Italy, while Spain also enjoyed a higher level of per capita GDP.Footnote 29 During the two following centuries, Italy not only lost its primacy, but also declined in absolute terms, while England strengthened its position and the Netherlands still held their supremacy. Against a stable European background, the centre, represented by France and Germany, hardly progressed; the north, that is the Netherlands and England, gained and the Mediterranean countries, Spain and north Italy, weakened.Footnote 30 In a European perspective, Italy, like Spain (Alvarez-Nogal and Prados de la Escosura Reference Alvarez Nogal and Prados de la Escosura2007, p. 359) exhibited a sustained decline.
The series of per capita GDP shows a clear upward trend from the 1880s on, which has recently been noticed by G. Federico (Reference Federico, Ciocca and Toniolo2003a, Reference Federico2003b) and S. Fenoaltea (Reference Fenoaltea2002). From then until the eve of World War I, product per head rose by 90 per cent in the centre and north and by 75 per cent on the national scale. The level reached by per capita GDP in the fifteenth century was surpassed around the year 1900.
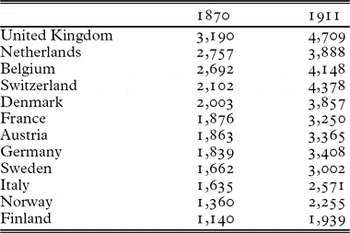
Table 6 helps set Italy (all of Italy, not only the centre and north) in the western European context between 1870 and 1911.
Per capita GDP in Italy and Western European nations in 1870 and 1911 (Geary-Khamis 1990 PPP international dollars)

Note: the source of the table is Maddison (Reference Maddison2003). Data for Italy are those of app. II, cols. III and IV. The position of Italy in the hierarchy is hardly different using the database by Prados de la Escosura (Reference Prados de la Escosura2000).
We can now distinguish the two main phases of the long history, from 1300 until today (Figure 11), and the rise in productive capacity in the 150 years preceding the recent reduction of the rate of growth. While decline has characterised the Italian economy from the Renaissance onwards, per capita GDP rose 16 times between 1861 and 2005 in the centre and north, 14 times on the national scale in this same period, and 9.5 times in the south and the islands.
Per capita GDP 1310–2005 in central and northern Italy (1911 prices; vertical axis in log)

4. Conclusion
Italy is one among the few European regions for which we have long series of prices, wages and urbanisation: from as far back as the beginning of the fourteenth century. Another advantage is that both its population level and trend from the late Middle Ages are relatively well known. Only in the case of England is it possible to go as far back in time. Recent work has allowed the elaboration of the long series presented in the previous pages. These series already suggest the trend of the Italian economy. The method proposed in the previous pages is, in a sense, a condensed outline of all this information.
The result is a slowly declining profile supporting the pessimistic view of the European pre-modern economy. Italy was rich during the Renaissance, when its population was 7–12 million (4–8 million in the centre–north), but was poor at the end of the Renaissance, in the second half of the sixteenth century. It recovered in the seventeenth century, when the population was 11–13 million (6.6–8 million in the centre–north), but became poor once more from half way through the eighteenth century, while the population grew to 18 million in 1800 and 26 million in 1861 (16 million in the centre–north). Italy came back to the centre of the European economy during the second Industrial Revolution, in the last decades of the nineteenth century, and was able to strengthen its position in the economic world hierarchy only after the middle of the past century (Zamagni Reference Zamagni1993; Malanima and Zamagni Reference Malanima and Zamagni2010).
Acknowledgements
Angus Maddison encouraged me to undertake this research on Italian GDP in the early 1990s and I concluded the present article in his final days. I dedicate this work to him with friendship and admiration.
The final series of GDP in central–northern Italy has been elaborated within the research project Historical Patterns of Development and Underdevelopment: Origins and Persistence of the Great Divergence, supported by the European Commission's 7th Framework Programme for Research, Contract Number SSH7-CT-2008–225342, coordinated by S. Broadberry. I thank Steve Broadberry, Leandro Prados de la Escosura and the other participants in the research group for their suggestions during the meeting held in Venice, 15–16 April 2009 (The University of Warwick in Venice, Palazzo Pesaro Papafava).
I thank in particular two anonymous referees for their keen comments on a previous draft of this article. Their suggestions helped me specify two central points of my elaboration.
S. Capasso and V. Daniele suggested changes to a preliminary draft of the paper. My thanks to them as well.
Appendix 1: Three tests
Three tests are presented in the following pages:
1. conversion of per capita GDP into current prices and comparison of the results with quantitative information on the late medieval and early modern ages;
2. the method followed for the period 1300–1861 is used for the period 1861–1913 and the results are compared with the available series based on direct information;
3. the internal consistency of our procedure is tested through the calculation of yearly marginal product, then compared to the series of real wage rates.
A1.1. Current prices
The first test of our results consists in the conversion of the output series into current prices for the long period in question and the comparison of the results with the direct information available on prices, incomes, taxes, consumptions etc. This test is always recommended when historical series of GDP are elaborated. We must provide future scholars with the possibility of easily comparing their results with ours and, when necessary, modify our series.
The series in Florentine lire is reported in Appendix 2, col. 7, together with the formula used for its calculation and the weight of the Florentine lira (col. 8) to allow the conversion into the different currencies of central–northern Italy and also non-Italian countries.
Although for the long period under examination several comparisons with data in current money would be possible,Footnote 31 only three examples are presented here.
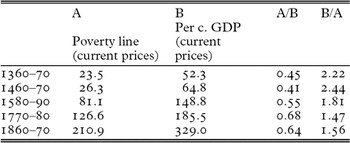
A first comparison is made with a poverty line, based on a basket including essential food (about 2,000 kilocalories), especially cereals (mainly minor cereals) and a limited yearly expense for textiles and housing (Malanima Reference Malanima2003). It is about 700–800 Geary-Khamis 1990 international dollars. This poverty line is about half the Italian per capita product for the long epoch in question; closer to the level of per capita output in the last phase and farther from that in the late Middle Ages (Table A1.1).
Poverty line and per capita GDP 1360–1870 (current prices; Florentine lire)

Source: Malanima (Reference Malanima2003).
A second comparison is made between our series and direct information relating to the period between 1420 and 1450. For the Republic of Florence, both the Catasto and information on prices and wages, together with the statistical calculations by Lodovico Ghetti (Reference Ghetti and Roscoe1816),Footnote 32 led historians (Herlihy and Klapisch Reference Herlihy and Klapisch-Zuber1978; Rutenburg Reference Rutenburg and Guarducci1988; Goldthwaite Reference Goldthwaite1980; Goldsmith Reference Goldsmith1987, pp. 145ff.) to suggest a value of per capita income between 55 and 75 Florentine lire, estimated from the consumption side. ‘This estimate is not out of line with the 14 florins (or 56 lire) that the Catasto officials considered the cost of maintenance of a single adult’ (Goldthwaite Reference Goldthwaite1980, p. 348). Our average is 64 lire in 1420–40.
A third comparison can be made with the fiscal revenue of 1492 and 1852 in the centre and the north. For the fifteenth century, we have information on fiscal revenue issued by the Italian states in the year 1492 (Felloni Reference Felloni and Felloni1999, p. 256; Malanima Reference Malanima2002, ch. 6). For the centre and the north, these amounted to about 17,500,000 Florentine lire. According to our series this value corresponds to a plausible fiscal pressure of about 5 per cent in the decade 1485–95. We know that the fiscal pressure in the Italian northern and central states in 1852 was 352,887,000 Italian lire (Correnti and Maestri 1864, II, pp. 616–17): about 7 per cent of gross output; that is a little higher than at the end of the fifteenth century.
A1.2. The period 1861–1913
Our results can also be tested by reconstructing the output for the period following the end of our series, using the same methods as for the period 1300–1861. Here I will refer to the whole of Italy and not only the centre and north, and will use series of prices and wagesFootnote 33 elaborated by statisticians and historians for the years 1861–1913. Our results then can be compared with those recently reached in the revision of product from Unification until World War I.
The series of agricultural product has been recently worked out by G. Federico (Reference Federico, Ciocca and Toniolo2003a, Reference Federico2003b) and is not yet definitive. Series for industry have almost been completed by S. Fenoaltea. Services are only known for the years 1891 and 1911, thanks to the research of V. Zamagni and P. Battilani.
The available series of GDP in the years 1861–1913 are, however, still conjectural, although certainly much better than the old Istat series (Istat 1976; Ercolani Reference Ercolani and Fuà1969; Vitali Reference Vitali and Rey1991). S. Fenoaltea has recently defined his own series of GDP, published in 2005, ‘premature in every sense’ (Fenoaltea Reference Fenoaltea2005a, Reference Fenoaltea2005b). Even his revision of these series is only likely to provide ‘highly preliminary, frankly conjectural ersatz-third-generation production series’ (Fenoaltea, forthcoming).
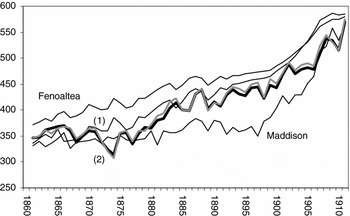
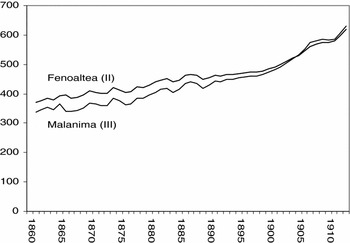
The series calculated through equations (6) – agriculture – and (8) – non-agricultural sectors –Footnote 34 (the thick curve, number 2, in Figure A1.1) is not so dissimilar to the series presented by Fenoaltea (Reference Fenoaltea2005a, Reference Fenoaltea2005b), the alternative proposed by Malanima (Reference Malanima2006) (number 1 in the graph) and that by Maddison (Reference Maddison1991), based on the previous Istat series and on the series by O. Vitali (in Ercolani Reference Ercolani and Fuà1969).
Estimates of per capita GDP in Italy 1861–1911 (1911 prices)

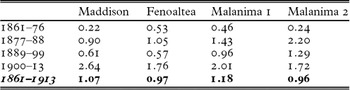
Differences between the yearly rates of growth of these four series are presented in Table A1.2.
Rates of growth of four series of per capita GDP 1861–1913 (% per year)

Sources: Maddison (Reference Maddison1991); Fenoaltea (Reference Fenoaltea2005a, Reference Fenoaltea2005b); Malanima (Reference Malanima2006a); see text for Malanima 2.
Note: the four series are the same as those presented in the previous graph and reported in Appendix 3.
The series seems to capture well long-run trend. As to short-run fluctuations, the series reveals the 1873 crisis, the 1881–7 growth, the crisis from 1888 until 1895 and the recovery after 1895. Short-term trend corresponds well to the conjuncture recorded by coeval observers (Bachi Reference Bachi and Bachi1914, pp. 298–313). The higher volatility suggested by this series from 1890 onwards is not necessarily less plausible than the smooth profile resulting from the direct reconstruction.Footnote 35
Since, as already seen, a demand-side approach assumes equality between demand and production of agricultural goods, the reliability of this assumption for a period after Unification, when the importation of agricultural goods and especially cereals was significant, can also be tested. Thus, the difference between importation and exportation of agricultural goods is added to our curve of product.Footnote 36 The grey curve in the graph represents the result, which determines a negligible difference from the curve obtained through the procedure followed in this article. This analysis does not dismiss the assumption of equality between demand for agricultural goods and the agrarian product.
A1.3. Working time
While previous analyses are useful to check the correlation between our results and data proposed by coeval observers or modern historians, the following one is aimed at demonstrating the internal consistency of our series by using it to calculate marginal and average product, the ratio of wages to GDP and, finally, working time and its elasticity to wage rate.Footnote 37 Previous results are used in order to analyse, in a circular way, their internal compatibility from a theoretical and empirical viewpoint.
Since our series of GDP is annual, the yearly marginal product of labour can be calculated on its basis. Then, dividing it by the wage rate per day, we obtain the number of days worked in a year. The denominator, the wage rate, has also been employed to define the nominator. However, the nominator, that is the yearly marginal product of labour, has been calculated using the series of wage rates, together with series of prices, coefficients of elasticity and finally data on employment.
Formally our procedure consists in solving the following equation:

where: t are the working days in a year; ∂Y/∂L is the yearly marginal product of labour (the partial derivative of output as to labour force) and W is wage rate per day. According to the theory, in pre-modern backward economies, the relationship of wage rate to working days, is inverse. We would therefore expect to find a negative elasticity of labour supply to changes in wage per day.Footnote 38
It is known that population between 15 and 65 years of age was about 55–65 per cent in pre-modern Italy (Beloch Reference Beloch1937–61, vol. I, ch. I). Almost everybody in this age group worked, although with different intensity, thus devoting more or less time to work.Footnote 39 In the first Italian national census in 1861, 62 per cent of the population was at working age and 96 per cent of this share was employed (Daniele and Malanima forthcoming). I have therefore assumed that labour (L) is equal to 60 per cent of the whole population.
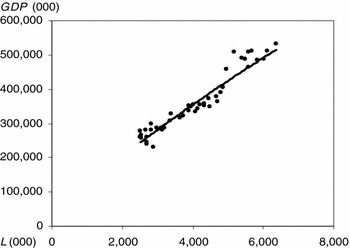
The relationship between GDP and labour is represented in Figure A1.2.
Output (in 1420–40 Florentine lire) and active population 1350–1820 (000; decadal data)

The best interpolating curve is represented by the following power equation:Footnote 40

The yearly marginal product of labour can be computed as the partial derivative, that is:

The series of the annual marginal product of labour can now be calculated. The resulting ratio between marginal and average labour product, which is the relative weight of wage as a form of income, is 69 per cent, that is:
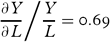
It is now hard to assess the average wage rate (the denominator of our previous equation 11). Our estimated average between the wage rate of a mason and that of an agricultural worker is only an approximation and nothing more. As a consequence, we can not hope to find the true level of days worked in Italy in the long period under examination, but only to suggest an order of magnitude and a plausible trend.
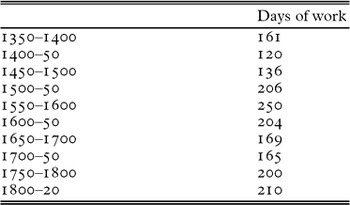
The result of equation 11 provides the average number of working days: 183 per year during the period from the fourteenth century to the beginning of the nineteenth century. This average may seem too low when compared to what we know about working time in northern Europe (summarised by de Vries Reference Vries2008, pp. 73ff.). However, it must be considered that the results referring to working days would be higher if reliable figures were available for the part of the population actually employed, instead of assuming, as I have, that the entire population of a working age, i.e. 60 per cent of the total, were employed. Our purpose is, however, to draw the trend rather than the level of days of work (which is difficult to specify in any case). Nevertheless, the result that working time was low in the fifteenth century (about 120–36 days per year) is plausible (Table A1.3).
Implicit working time in our GDP calculation 1350–1820 (days per year)

Source: see text.
The number of working days rose conspicuously in the sixteenth century, in conjunction with the decline in real wage rates, until 1550–1600.Footnote 41 A drop occurred in the seventeenth century, but the days of work rose again in the second half of the eighteenth century together with the decline in real wage rates, without, however, ever reaching the level of the sixteenth century. From the beginning of our curve, in the second half of the fourteenth century, to the end, days of work increased from about 150 to 200. As the English evidence seems to suggest this trend is probably the same as that which is to be found in other European regions over the same period (Voth Reference Voth1998, Reference Voth2001). An ‘industrious revolution’ was in progress in Italy and in northern Europe, determined by the need to survive. People were forced to be industrious.Footnote 42
The working time-wage relationship is negative, as expected, and the most appropriate equation is a second degree polynomial where t are days of work and W real wage per day (1420–40 Florentine lire):Footnote 43

Elasticity can be here defined by the following equation:

where:
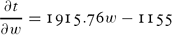
Elasticity is not the same at different levels of wage rate. It is relatively high (from -0.70 to -0.75) when the daily wage is low (around 0.25 1420–40 Florentine lire) and low (from –0.40 to –0.45) when wage rate is high (around 0.55 Florentine lire). Similar elasticity coefficients have been found in the Philippines, Egypt and India (Dessing Reference Dessing2002; Assaad and El-Hamidi Reference Assaad, El-Hamidi and Sirageldin2002; Sharif Reference Sharif1991).
Appendix 2: Per capita GDP in central–northern Italy, 1310–1913
The following series refer to the most developed regions of the country: the centre and the north (from the southern borders of Tuscany, Umbria, Marche until the Alps; 161,000 km2 out of the total of 310,000 km2). See Appendix 3 for the series concerning the whole of Italy in 1861–1913. In 1420–40 the average value of per capita agricultural GDP is 246 1911 lire. This value allows the calculation of the series of per capita agricultural output in 1911 lire and the comparison with the series of GDP in col. 5.
In www.paolomalanima.it (section on the Italian economy) you find information on the procedure used to build the basic Italian series of prices, wages, urbanisation, and population for the calculation of output.
In order to convert the series into 1990 international Geary-Khamis dollars PPP and make comparisons with other countries and with data provided by A. Maddison, the index in column 4 has only to be multiplied by 1,486 (the value of 1861 per capita GDP in this nominal money). In col. 9 the results of the Hodrick-Prescott filter are reported and can be used as average values to smooth the index of GDP in col. 3.
A conversion of the entire series into current prices is useful to make comparisons with data expressed in the currency of any Italian state. In the following col. 7, the nominal money chosen is the Florentine lira (whose weight is reported in col. 8 on the basis of Goldthwaite Reference Goldthwaite1980, pp. 429–30). Conversions into the currencies of other Italian states can be made through the weight in silver of any currency. I have chosen the decade before Unification; when the currencies of the Italian states still existed. They were replaced by the Italian lira (4.5 silver grams) from 1861 onward. Then the result is multiplied by the consumer price index and subsequently by the index of per capita GDP. The procedure in order to convert per capita GDP in 1861 lire into the Florentine current lire is summarised by the following equation:
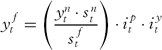
where:
yft is per capita GDP in Florentine (f) lire in the year t;
ynt per capita GDP in national (n) Italian lire in the year t;
snt the weight in silver of the Italian lira in the t year;
sft the weight in silver of the Florentine lira in the same year;
ipt the index of prices and iyt the index of per capita GDP in the t year.
The year chosen as the basis of this reconstruction is 1861 and the same procedure is used for the years t–1 (1860), t–2 (1859). . . t–n.

Appendix 3: Four series of per capita GDP in Italy 1861–1913 (1911 prices)
The following Figure A3.1 allows to grasp the differences between the series in column II (Fenoaltea Reference Fenoaltea2005a and Reference Fenoaltea2005b) and III (Malanima Reference Malanima2006a). Both series are based on the same evidence for agriculture and industry, but on different shares of the service sector on GDP. Fenoaltea estimates the output of services through data and assumptions on transportation, communication, trade and credit. In his estimate, the share of services on GDP is almost stable in the years 1861–1913 (from 34.8 to 36.8 per cent). However, more recently, Fenoaltea revised the share apportioned to services (Fenoaltea forthcoming, table 1). In this revision, services represent 31 per cent and 32 per cent (in two diverse series) in 1861 and 37 per cent in 1913. In Malanima, following Maddison (Reference Maddison1991) from 1861 until 1891, and Zamagni-Battilani in 1891 and 1911 (Conti (I) economici dell'Italia, 1, Reference Rey, Vitali, Federico, Fenoaltea, Marolla, Roccas, Vitali, Zamagni, Battilani, Rey, Federico, Fenoaltea, Bardini, Zamagni, Battilani and Rey1991; 3, 2002) services represent 27 per cent in 1861 and 38 per cent in 1913. The higher starting point of Fenoaltea's series implies a different position of Italy in the European context around 1870. Although the series by Maddison is based on the Istat series, the structure of GDP is not the same. In the recent Battilani (Reference Battilani2010), the percentage of services is 26 in 1861 and 38 in 1911. The only difference between the series by Fenoaltea and Malanima depends on the diverse estimate of the tertiary sector. The correlation is 0.996.
Two series of per capita GDP in Italy 1861–1913 (1911 prices)

The following series are computed at factor prices, present borders and 1911 constant prices.