Implication
The Welfare Quality® (WQ®) assessment system for fattening cattle mainly uses animal-based parameters for on-farm evaluation, which can be aggregated stepwise to an overall farm score. This paper investigated WQ® scores resulting from consecutive farm assessments in terms of consistency of animal- and resource-based measures. Consistency over time was partially low and further decreased with longer intervals between assessments. Especially when used for certification and labelling purposes, animal welfare classification should therefore not be based on single assessments. Possible reasons for lack of consistency are discussed and recommendations for future approaches are given.
Introduction
One of the main aims of Welfare Quality® (WQ®) was to develop on-farm welfare assessment systems that focus primarily on animal-based measures and that are scientifically sound and feasible (Blokhuis et al., Reference Blokhuis, Jones, Geers, Miele and Veissier2003). The assessment protocols that have been developed for several animal species and categories aim at providing feedback to farm managers on the welfare state of their animals and at translating this information into understandable messages for consumers, for example, for labelling purposes. Following a multidimensional concept of animal welfare, the protocols comprise several animal-based welfare parameters that are complemented with information on farm management and housing structures (Botreau et al., Reference Botreau, Veissier, Butterworth, Bracke and Keeling2007; Blokhuis, Reference Blokhuis2008; Kirchner et al., Reference Kirchner, Schulze Westerath, Knierim, Tessitore, Cozzi, Vogl and Wincklersubmitted). The protocol for fattening cattle is based on 28 measures that are integrated into the so-called criterion and principle scores, finally leading to an overall classification of the farm (Botreau et al., Reference Botreau, Veissier and Perny2009; Welfare Quality®, 2009).
Apart from validity and feasibility, reliability is a central criterion for the selection of measures for (on-farm) welfare assessment (Waiblinger et al., Reference Waiblinger, Knierim and Winckler2001). Reliability relates to the reproducibility or repeatability of results and this can be considered at different levels. Interobserver reliability refers to the agreement between two or more observers assessing the same animals in the same situation. Intraobserver reliability means the extent of agreement when the same observer carries out assessments repeatedly, for example, using video clips or pictures (Martin and Bateson, Reference Martin and Bateson2007). Test–retest reliability indicates that repeated tests with the same subjects produce similar data (Windschnurer et al., Reference Windschnurer, Boivin and Waiblinger2009).
A special case of test–retest reliability is the consistency of outcomes over time (COT). COT is especially important if assessments are intended to be used for certification purposes, meaning that results should be representative of the longer-term farm situation and not too sensitive to changes in the farming conditions or the internal states of the animals as long as the situation has not changed significantly. High levels of consistency have therefore been regarded essential for on-farm welfare measures and assessment systems (Capdeville and Vessier, Reference Capdeville and Veissier2001; Winckler et al., Reference Winckler, Brinkmann and Glatz2007). They will ensure fairness for the farmer and credibility of the system (Knierim and Winckler, Reference Knierim and Winckler2009; Sørensen and Fraser, Reference Sørensen and Fraser2010). At the same time, an on-farm measure should be sensitive enough to detect variations in welfare state within farms. An additional aspect of COT is the determination of the necessary number of repeated assessments, that is, of farm visits. Indicators that do not change significantly over a long period of time, if farm conditions remain constant, do not require frequent visits to obtain reliable estimates.
COT has been investigated with regard to individual differences in behaviour (reviewed in Bell et al., Reference Bell, Hankison and Laskowski2009), for example, for ‘behavioural traits’ (Spoolder et al., Reference Spoolder, Burbidge, Lawrence, Simmins and Edwards1996; Kralj-Fišer et al., Reference Kralj-Fiser, Scheiber, Blejec, Moestl and Kotrschal2007), but studies on consistency of both animal- and resource-based (on-farm) measures of animal welfare are generally rare (Sundrum and Rubelowski, Reference Sundrum and Rubelowski2001). In dairy cattle, Winckler et al. (Reference Winckler, Brinkmann and Glatz2007) investigated the correlation of selected animal-related welfare parameters between consecutive farm visits. Consistency was found to be moderate to good with regard to lameness incidence, skin lesions at the tarsal joint and avoidance distance towards an approaching human. However, variability for measures of social behaviour and animal cleanliness was high. The development of the WQ® assessment protocol for fattening cattle (Welfare Quality®, 2009) also included some work on COT at the measure level, focussing on behavioural measures such as behaviours around resting (e.g. time needed to lie down; Brörkens et al., Reference Brörkens, Plesch, Laister, Zucca, Winckler, Minero and Knierim2009) or agonistic and socio-positive interactions (Laister et al., Reference Laister, Brörkens, Lolli, Zucca, Knierim, Minero, Canali and Winckler2009; Schulze Westerath et al., Reference Schulze Westerath, Brörkens, Laister, MacKintosh, Winckler and Knierim2009). Measures were suggested for inclusion in the protocol only if correlations between farm visits were higher than 0.7 and variance within farms was lower than variance between farms. However, not all measures included in the final protocol were tested for COT and so far such studies have not been carried out at the level of criterion and principle scores. The latter is a key factor for credibility of the welfare judgement and it has been highlighted as an important task and perspective for further investigations (Knierim and Winckler, Reference Knierim and Winckler2009).
It was therefore the aim of the present study to investigate COT for the single measures used in the WQ® protocol for fattening cattle as well as for the aggregated criterion and principle scores across short-term (1 month) and longer-term periods (6 months). It was hypothesized that the aggregated criterion and principle scores were more consistent over time than the single measures. Furthermore, consistency was expected to be lower with longer intervals between assessments.
Material and methods
Data collection was carried out on 63 bull-fattening farms with alternative housing systems, that is, with straw-bedded lying areas or cubicles with rubber mats. The farms were located in Austria (n=21), Germany (n=21) and Italy (n=21). The average number of animals per farm ranged between 102 (Austria) and 233 (Italy) (for details see Kirchner et al., Reference Kirchner, Schulze Westerath, Knierim, Tessitore, Cozzi, Vogl and Wincklersubmitted and Supplementary Table S1). Three assessments were carried out on each farm. An interim assessment was carried out about 1 month after the initial assessment and the final assessment took place about 6 months after the interim assessment. All assessments followed the WQ® assessment protocol for fattening cattle (Welfare Quality®, 2009) and they were carried out by three trained assessors (one per country), who had reached at least satisfying interobserver agreement (Kendall’s coefficient of concordance >0.7) during a joint training session.
On the basis of total 28 measures (19 animal, three resource and six management based), WQ® criterion and principle scores were calculated (for an overview on achieved values on all levels, please consider Supplementary Tables S1 to S5). These scores can range from 0 to 100 for each criterion and principle and were calculated for each farm at each assessment separately as described in the WQ® protocol (Welfare Quality®, 2009) using updated formulas and coefficients (Welfare Quality®, 2011).
Statistics
Two methods were used to assess consistency of results over time for the level of measures, criterion and principle scores. First, Spearman’s rank correlations between initial and interim assessment and between interim and final assessment were calculated. Second, between- and within-farm variability was compared using covariance parameter estimates for the farm (random factor) and the residual component. Analysis was based on the following linear mixed effects model:
 $$y_{{ijkl}} =\mu {\plus}b_{i} {\plus}\alpha _{k} {\plus}\beta _{l} {\plus}{\varepsilon}_{{ijkl}} $$
with the intercept μ, the fixed effects α k assessment (factor with two levels: initial or interim assessment and interim or final assessment, respectively), β l country (factor with three levels: AT, DE and IT) and the random effect b i farm. All models were computed using R 2.13.1 (R Development Core Team, 2008). Residuals were checked for normal distribution (Kolmogorov–Smirnov test; Q–Q, scatter and box plots). Frequencies of the measures ‘% of animals with severe integument alterations’, ‘% of animals with bloated rumen’, ‘% of animals died or euthanized on farm’ and of the resource-based measures ‘% of groups with dirty water point’, and ‘% of days outdoor loafing area available’ were too low for statistical analysis.
For the measures ‘% of very lean animals’, ‘% of animals with mild integument alterations’, ‘% of animals with hampered respiration’ and ‘% of animals with diarrhoea’ as well as the criterion scores regarding ‘Absence of prolonged hunger’, ‘Absence of prolonged thirst’ and ‘Absence of pain induced by management procedures’ normal distribution of residuals was not achieved after transformation. Therefore, a generalized linear mixed model in R 2.13.1 (R Development Core Team, 2008) assuming a Poisson distribution was used; the factors included in the model were the same as described above.
Consistency of measures, criterion scores and principle scores was judged as acceptable if correlation coefficients were equal or higher than 0.7 (Martin and Bateson, Reference Martin and Bateson2007) and if the variance explained by the random factor (=variance between farms) was greater than the variance of the residuals describing the variance within farm (thus corresponding to an intra-class correlation coefficient >0.5; Dohoo et al., Reference Dohoo, Martin and Stryhn2009). This evaluation was only possible for 19 of the 28 measures and 10 of the 11 criteria (see also Tables 1 and 2).
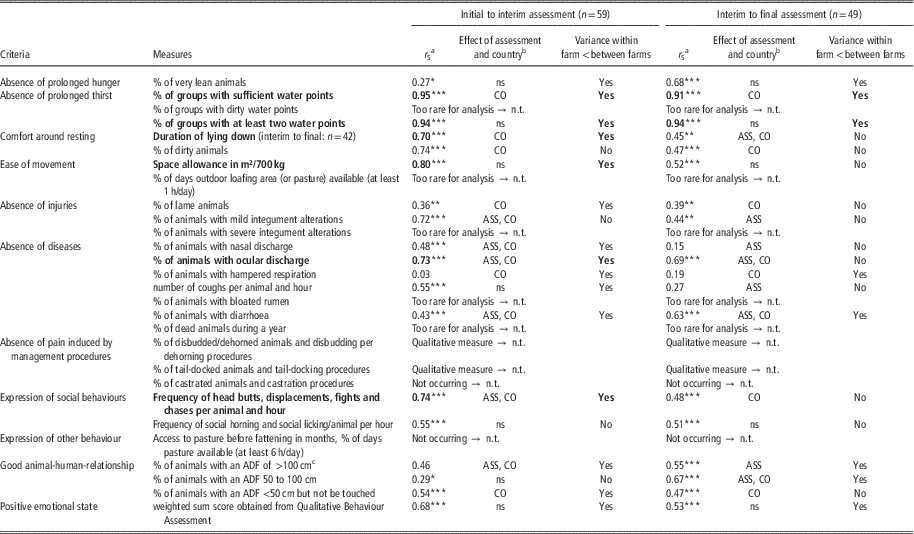
Consistency of the welfare measures from initial to interim assessment and interim to final assessment of the farms without ‘major deviations’ expressed as correlations between the welfare measures (r s), as effect of assessment (ASS) and/or country (CO) on the welfare measure and comparison of the variance within and between farms

ns=not significant; n.t.=not tested.
Measurements in bold letters met the COT criteria: correlation coefficients equal or higher than 0.7 and the variance explained by the random factor (=variance between farms) greater than the variance of the residuals describing the within-farm variance.
a Spearman’s correlation coefficient r S.
b Significant effect of assessment (ASS) and country (CO).
c Avoidance distance at feed rack (ADF).
*P<0.05, **P<0.01, ***P<0.001.
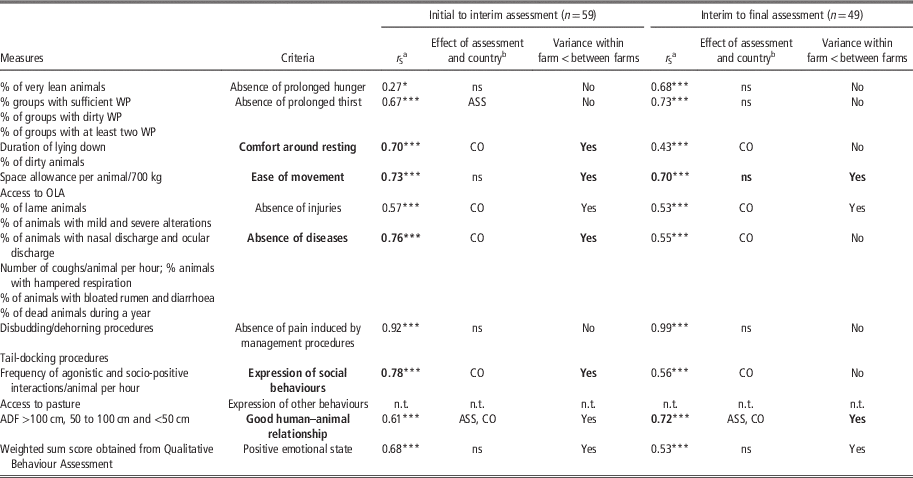
Consistency of the welfare criteria scores from initial to interim assessment and interim to final assessment of the farms without ‘major deviations’, expressed as correlations between the welfare criteria scores (r s), as effect of assessment and/or country on the criteria scores and comparison of the variance within and between farms

WP=water points; OLA=outdoor loafing area; ns=not significant; n.t.=not tested.
Criteria in bold letters met the COT criteria: correlation coefficients equal or higher than 0.7 and the variance explained by the random factor (=variance between farms) greater than the variance of the residuals describing the within-farm variance.
a Spearman’s correlation coefficient r S.
b Significant effect of assessment (ASS) and country (CO).
*P<0.05, ***P<0.001.
To investigate consistency only in farms that provided rather stable conditions for the animals, farms that showed major deviations throughout the study were excluded from the calculations. ‘Major deviations’ were defined as alterations of resources or management exceeding changes that can be commonly expected over time. Examples for such management changes are ‘substantial increase in amount of litter used’, ‘increased number of animals bought in’ or ‘switch to total mixed ration feeding’. Owing to ’major deviations’, in total, 16 (AT: 9, DE: 5, IT: 2) of the 189 assessments had to be excluded from statistical analysis. Consequently, 59 farmvisits were included in the analyses comprising initial and interim assessments, and 49 farmvisits for interim and final assessments.
Finally, the proportion of farms in the four WQ® welfare classification categories (Excellent, Enhanced, Acceptable and Not classified) were determined, and the percentage agreement between initial and interim, interim and final, and initial and final assessment was calculated for those farms that had not undergone substantial changes as described above (n=48).
Results
Consistency of results over time (COT) at measure, criterion and principle level
Regarding the initial and interim assessment, covariance parameter estimates for the factor farm (between-farm) were higher than for the residuals (within-farm) and correlations exceeded the 0.7 threshold for six measures (Table 1). These measures were either resource-based (‘% of groups with sufficient water points’, ‘% of groups with at least two water points, ‘Space allowance’) or animal-based (‘Duration of lying down movements’, ‘% of animals with ocular discharge’, ‘Frequency of head butts, displacements, fights and chases per animal and hour’). Measures not fulfilling both COT criteria at least matched the criterion regarding the ratio of variance within and between farms except for ‘% of dirty animals’, ‘% of animals with mild integument alterations’, ‘Frequency of social horning and social licking/animal per hour’ and the ‘% of animals with an avoidance distance at the feeding rack (ADF) of 50 to 100 cm’ (Table 1). The respective correlation coefficients varied largely ranging from 0.03 for ‘% of animals with hampered respiration’ to 0.68 for the weighted sum score obtained from Qualitative Behaviour Assessment (‘Positive emotional state’).
Two measures regarding the provision of water showed high consistency between the interim and final assessment. All the other measures did not fulfil at least one of the predefined consistency criteria. Greater between-farm than within-farm variance was found for measures such as ‘% of very lean animals’, ‘% of animals with diarrhoea’ or measures belonging to the principle ‘Appropriate behaviour’ (e.g. ‘% of animals with an avoidance distance of >100 cm’); however, correlation coefficients ranged from 0.19 to 0.67 (Table 1).
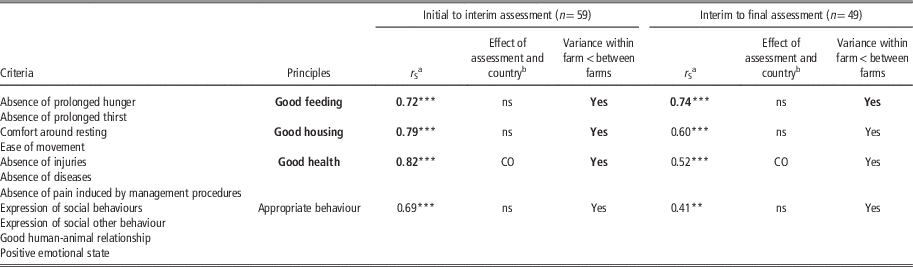
At the criterion level, the four criteria ‘Comfort around resting’, ‘Ease of movement’, ‘Absence of disease’ and ‘Expression of social behaviours’ showed larger variance between farms than within farms and additionally correlations between initial and interim assessment exceeded the threshold of 0.70 (Table 2). Partial fulfilment of the COT criteria (comparison of between- and within-farm variance) was achieved for the three criteria ‘Absence of injuries’, ‘Good human–animal relationship’ and ‘Positive emotional state’. Regarding interim and final assessment, with 6 months in between, two criteria were judged as having good COT: ‘Ease of movement’ and ‘Good human–animal relationship’ (Table 2). The variance criterion was fulfilled by only two other welfare criteria: ‘Absence of injuries’ and ‘Positive emotional state’. Variance within farms was smaller than between farms for all principle scores. However, correlation coefficients were above threshold only for three principles (Good feeding, Good housing and Good health) from initial to interim assessments and for one principle from interim to final assessments (Good feeding) (Table 3).
Consistency of the welfare principle scores from initial to interim assessment and interim to final assessment of the farms without ‘major deviations’, expressed as correlations between the welfare principle scores (r s), as effect of assessment and/or country on the scores and the comparison of the variance within and between farms

ns=not significant.
Principles in bold letters met the COT criteria: correlation coefficients equal or higher than 0.7 and the variance explained by the random factor (=variance between farms) greater than the variance of the residuals describing the within-farm variance.
a Spearman’s correlation coefficient r S.
b Significant effect of assessment (ASS) and country (CO).
**P<0.01, ***P<0.001.
Consistency of results over time concerning the overall welfare classification
Agreement in the overall welfare classification between initial and interim assessment and between interim and final assessment was 79% and 75%, respectively. Sixty-five per cent of the farms maintained the same classification from the first to the last assessment. Farms improved and decreased classification across assessments in approximately equal shares by almost exclusively one category (Table 4).
Consistency of the welfare classifications from initial to interim assessment, interim to final assessment and initial to final assessment of the farms without ‘major deviations’ as ’percentage agreement of the welfare classifications’ (in bold) and percentages of farms that ‘improved’ and ‘decreased’ by one or two categories (no farms switched more than two categories)

Discussion
Consistency at measures level
We used two methods to assess consistency over time (COT) of single welfare parameters and criterion/principle scores: the ratio of variance components (between and within farms) and a measure of association (rank correlations between consecutive visits). This may appear rather restrictive, but it recognizes that perfect association can exist, despite absolute differences (Watson and Petrie, Reference Watson and Petrie2010). In the WQ® evaluation system, the absolute values, for example, at the level of measures, rather than the relative position of farms to each other, are important. High coefficients of correlation alone may only indicate that farms would be ranked consistently irrespective of actual changes recorded for single measures, and consequently for criterion and/or principle scores. This also means that reaching the variance ratio criterion alone provides a better estimate of consistency as compared with correlations, as it can only be achieved if changes within farms are moderate.
At the measure level, COT was not satisfactory for the majority of the parameters included in the assessment scheme. In line with our expectations, and with results from Bell et al. (Reference Bell, Hankison and Laskowski2009), correlation coefficients mostly decreased when the time interval between assessments was prolonged (6 months v. 1 month), whereas the ratio of variance within and between farms increased. Several reasons may account for the rather low level of consistency. Although the farms that had reported changes in housing or management or for which such changes had been identified by the assessors were discarded from the calculation of COT, management routines or handling of the animals may still have changed in some farms and thus may have had an impact on the welfare measures. However, the general impression during farm visits did not indicate that conditions substantially changed throughout the study period. Further but less well-defined factors such as seasonal effects, weather conditions or events such as visits of the veterinarian may have induced changes in the measures of welfare. Season likely played a role for measures related to respiratory disorders (nasal discharge, coughing, ocular discharge), as reflected by a significant effect of number of the assessment in the linear model of these measures. However, even less is known on short-term fluctuations and their possible effects. Behavioural measures may change at very short intervals. For example, Laister (Reference Laister2009) investigated the day-to-day variation in the incidences of agonistic and socio-positive behaviours on 10 Austrian beef bull farms and found correlation coefficients of single measures as low as 0.09 (but also up to 0.90). The lower value refers to horning that pertains to the social behaviours included in the WQ® protocol for fattening cattle. Although these results have to be interpreted carefully because of the small sample size, they give an idea of which day-to-day fluctuation within ‘normal’ farm conditions may be expected. Assessing clinical parameters in dairy cattle at five bimonthly intervals, Winckler et al. (Reference Winckler, Brinkmann and Glatz2007) also found that correlations between consecutive visits varied considerably, for example, 0.48 to 0.78 for lameness and 0.05 to 0.37 for skin lesions at the carpal joint.
In the present study, besides the changes that appear to be the result of normal fluctuation of farm routines, some other possible reasons were identified. Low correlations between the initial and interim assessments occurred mainly for measures of health status with low prevalence, that is, up to 1% (principle ‘Good health’). In this case, the estimated prevalences often arise from one or two animals showing the symptoms that may be either treated or removed from the fattening pens. In addition, for some clinical measures, it was difficult to achieve the proposed sample sizes, for example, owing to difficulties in approaching the bulls for the assessment. However, the sample sizes proposed in the WQ® assessment protocol (Welfare Quality®, 2009) refer to a prevalence scenario of 0.5, which can be regarded a worst case in terms of sample size (i.e. relatively larger sample sizes than would be necessary to precisely estimate a lower/higher prevalence). Thus, considering that the true prevalences were much lower in the present study, the precision reached is likely to be high. On the other hand, the calculation of sample size relates to the overall number of animals, but does not take into account the pen structure of farms. Variation in prevalence between pens may therefore lead to a bias if the sample is drawn from selected pens only, especially in larger farms. A relatively large influence of sample size on estimated prevalence at farm level has recently been shown for selected welfare indicators in finishing pig farms using a bootstrapping method (Mullan et al., Reference Mullan, Browne, Edwards, Butterworth, Whay and Main2009). Owing to large deviations among pens, even large (and not feasible) sample sizes consisting of up to 80% of the pens were unable to reflect the true situation of the whole farm for measures with low prevalence. Although sampling strategies in the present study with random selection of pens stratified for age class and location in the barn were not completely identical with those of the study on pigs (full random sampling), considering the expected prevalence when calculating appropriate sample sizes as suggested by Mullan et al. (Reference Mullan, Browne, Edwards, Butterworth, Whay and Main2009) also deserves further investigation with regard to beef cattle.
Finally, one may argue that significant differences between countries, as revealed from the analysis of variance for the majority of measures, reflect poor interobserver agreement, thus leading to inflation of correlation. However, all assessors had achieved at least satisfactory interobserver agreement (Kendall’s coefficient of concordance >0.7) and there was also no indication of observer drift in the course of the study based on interobserver testing after data collection. Furthermore, measures showing differences between countries were not necessarily highly correlated. Independent from the strength of the correlation, the distribution of data was fairly even (within country and across countries) so that we do not expect effects on the correlations because of clustering of data by country.
Resource- or management-based measures have been described to have a high repeatability (Johnsen et al., Reference Johnsen, Johannesson and Sandøe2001). However, to the best of our knowledge, COT of design or management criteria has never been tested before. In our study, the measures of water provision have been found to be consistent, but this was true to a lesser extent for the measurement of space allowance (at the 6-month interval). Stocking density is affected by management decisions depending on, for example, market conditions, the availability of animals and feed, or simply variable strategies in moving animals sooner or later into another pen. This indicates that also management-related measures may change considerably over time and cannot always be assumed as stable as they are often regarded.
COT at the measure level may be less important if the results are used for weak point analysis or for advisory activities carried out shortly after the assessment. In this case, the focus lies more on identifying the most prevalent welfare problems on a given farm. Even if outcomes fluctuate, they refer to the actual state regarding the different components of welfare. In addition, it can be assumed that problems that are not evident in a single assessment will be detected in consecutive assessments if they really represent a consistent welfare problem, affecting a meaningful proportion of animals. However, the present results demonstrate that it is inappropriate to base farm animal welfare evaluation only on single assessments at welfare measure level. In a commercial, for example, welfare-labelling setting, repeated assessments need to take place. Even if this would require a longer baseline assessment period until sufficient reliable data have been gathered, the use of rolling averages to smoothen short-term fluctuations or the verification of assessments that would cause reclassifications of farms may be a potential approach.
Consistency of aggregated scores
Consistency slightly improved with aggregation. At the criterion level, scores for four and two of the 10 criteria were considered consistent for initial to interim and interim to final assessments, respectively. Combining two or more measures into a criterion score may smoothen undirected fluctuations, for example, for the criterion ‘Ease of movement’. The criterion scores were consistent even after an interval of 6 months, although the corresponding measure ‘Space allowance’ did not meet the criteria for consistency over time, whereas ‘% of days outdoor loafing area available’ remained constant in the majority of the farms. Deviations in space allowance between consecutive visits were larger in farms that already provided rather spacious housing conditions (i.e. >7 m2 per 700 kg live weight), whereas changes were less pronounced when space allowance was lower. Therefore, we do not think that the smoothening effect was at the expense of sensitivity in terms of welfare evaluation.
Similarly, sensitivity is not impaired for criterion scores that are calculated using thresholds, for example, ‘Absence of disease’. If in this case prevalence stayed below the ‘warning’ or ‘alarm’ thresholds (Welfare Quality®, 2009), even relatively large variation does not lead to changes in the criterion score. On the contrary, rather small oscillations around a given threshold may lead to a substantially lower consistency at the criterion level. This was apparently the case for the criterion ‘Absence of prolonged thirst’.
The general effects described for the criterion level also apply to the principle scores. Integrating information based on the multi-criteria evaluation model used by Welfare Quality® (2009) revealed sufficient consistency for three and one of four principles for initial to interim and interim to final assessments, respectively. Again, COT markedly declined over the 6-month period also for the aggregated scores, thus challenging single applications of the tool for certification purposes.
Taking the overall classification into account, 79% and 75% of the farms remained in the same category when comparing initial with interim (1 month) and interim with final assessment (6 months), respectively. Considering the fact that only farms without major changes in housing and management were used for this analysis, it is questionable whether such a high proportion of shifts between categories even within rather short periods truly reflects changes in the welfare state and would be accepted by the farming community. Although none of the farms was ‘Not classified’ at any assessment, switching between the two categories ‘Enhanced’ and ‘Acceptable’ might already be sufficient to lose a certification status, depending on the thresholds set by future welfare-labelling systems. Obtaining a different overall classification may, however, also reflect that not all criteria and principles were judged consistent and that changes in welfare relevant parameters of individual farms may lead to a different overall evaluation.
Conclusions
The rather low COT at the measure level, especially for many behavioural and health measures, may be considered a minor problem if the information is given to the farmers and subsequently used for advisory purposes. However, our results demonstrate that animal welfare classification should not be based on single assessments. A higher proportion of criterion and principle scores showed promising consistency over time, indicating that the integration to criteria and principles reduces variance within farms. Nevertheless, the repeatability over 6 months was not sufficient for reliable welfare classification as it would probably be used for certification purposes. Repeated assessments appear to be necessary, either to generate rolling averages or to verify assessments that would cause reclassification of farms. Our results also provide first evidence for the differentiation of assessment intervals, depending on the expected COT for different measures. However, further long-term studies on the effects of different sample sizes and feasible sampling strategies on consistency, as well as on appropriate number, interval, schedule and analysis of repeated assessments are recommended.
Acknowledgements
The authors thank the farmers participating in the study for their collaboration and feedback during and after the assessment. The present study was part of the Welfare Quality® research project that has been co-financed by the European Commission, within the 6th Framework Programme, contract No. FOOD-CT-2004-506508. The text represents the authors’ views and does not necessarily represent a position of the Commission who will not be liable for the use made of such information.