When calculating quality-adjusted life-years (QALYs), a crucial question is how validly the values for health states produced by health-related quality of life (HRQoL) instruments reflect the true trade-off between length and quality of life. There is no gold standard of how (by which valuation method) and from whom the valuations should be derived. Typically direct and holistic valuation methods are used, in which the health states to be valued are described in a written form in their entirety to those, from whom the valuations are elicited (the respondents, usually samples of “general population”) and they have to imagine themselves in those hypothetical states even if the valuation takes place in different ways. However, which direct method to use? There are proponents for standard gamble (SG) (Reference Torrance24), time trade-off (TTO) (Reference Nord15), and rating scale (Reference Parkin and Devlin17).
The 15D is widely used for measuring HRQoL and calculating QALYs (18). Due to the vast number of health states that the 15D defines, the cognitive overload makes it impossible to use direct and holistic valuation methods as typically applied. Instead, the 15D valuations were derived with an indirect three-stage procedure based on a combination of rating scale and magnitude method. This has given rise to questions about how the 15D scores compare with those elicited with SG or TTO, which try to measure the trade-off between length and quality of life directly.
Recently, doubts have also been raised about whether valid valuations can be elicited without the respondents being themselves in those health states to be valued or that they at least have sometimes experienced them (Reference Menzel, Gold and Nord13;Reference Nord, Pinto Prades and Richardson16). Swedish guidelines for economic evaluation explicitly prefer valuations by the persons in the health states to be valued to those of hypothetical health states by the population (9).
At least theoretically, TTO valuations of patients’ own health should meet the requirements of validity for QALY calculations and patient experience, because these valuations measure the patients’ trade-off between length and experience-based quality of life explicitly. This study reports on an empirical study in which patients assessed their health status with the 15D and valued their own health with TTO. The purpose is to compare these two sets of values and to estimate an empirical relationship between. Should there be a solid relationship and if one considers TTO valuations based on patient experience a gold standard for QALY calculations, one could, instead of asking patients difficult holistic TTO questions, simply ask them to fill in the 15D questionnaire, apply the 15D scoring (and possible transformation) formula, and obtain estimates of TTO valuations.
METHODS
The 15D
The 15D is a generic, self-administered measure of HRQoL, which combines the advantages of a profile and single index measure. The health state descriptive system includes fifteen dimensions: breathing, mental function, speech, vision, mobility, usual activities, vitality, hearing, eating, elimination, sleeping, distress, discomfort and symptoms, sexual activity, and depression, with five levels on each.
The valuation system is based on an application of the multi-attribute utility theory. The single index score (15D score) represents the overall HRQoL and ranges from 0 (being dead) to 1 (“full” health). It is calculated by using, in an additive aggregation formula, a set of preference or utility weights, elicited from representative samples of adult population through a three-stage valuation procedure. The development process of the instrument, its valuation methodology, and the properties of the valuations are described in detail elsewhere (Reference Sintonen20;Reference Sintonen21).
Sample and Study Design
The majority of patients were recruited from the hospital outpatient clinics and wards of the Hospital District of Helsinki and Uusimaa, and also from Orton Orthopaedic Hospital, Sleep Clinic of Rinnekoti, Iiris Visual Rehabilitation Centre, and Käpylä Rehabilitation Centre (spinal injury and stroke patients). The healthcare units were selected so that their patients would have their main health problems in one of the dimensions of the 15D. Thus, for example the lung clinic was selected, because the patients probably have their main problems with breathing.
In the units, the head nurse identified in randomly selected days the patients aged 18 and over, whose mental and physical condition was deemed adequate for completing an interview (intensive care, infection, and confusion were exclusion criteria). The Coordinating Ethical Committee of the Hospital District of Helsinki and Uusimaa approved (623/EO/02) the study protocol.
Interviews
The interviews were carried out between April 2003 and May 2004 by eighteen nurses, who were specially trained by one of the authors (T.H.). The interview technique and wordings were piloted and fine-tuned earlier with approximately sixty patients. The plan was to recruit at least sixty patients per unit. On average, the interviewers carried out fifty interviews (range, 2–177).
The interviewers requested whether the patients were willing to participate in the study, explained its purpose, and handed an information leaflet. Those willing to participate signed the informed consent and the interview commenced.
First, the respondent self-administered the 15D questionnaire and reported some background and health-related data. Then the interviewer checked from life tables the life expectancy of a person of that age and sex in the population (= X years) and said:
“I asked your age, because in the following questions you have to think of life X years ahead. This is the number of remaining life-years that according to the life table of Statistics Finland a person of your age and sex on average has. This statistical life expectancy does not need to have anything to do with your real life expectancy.
When we now speak of your health status, think of it as a whole and not just from the viewpoint of the illness because of which you are now in this clinic/ward. In the following question we ask you to compare your present health status to being completely healthy and to the length of life. Completely healthy refers to a person, who has no illnesses or health problems, for example such that were mentioned on the previous questionnaire.
Let us assume that your present health status would last to the end of your expected life span, that is, X years. Let us assume further that there would be a treatment that would make you immediately completely healthy. How many years of life in full health would be equally good as X years in your present health status?” (A card with this text was also given to the respondent).
Assessment of Preferences
A visual aid with a scale from 0 to 60 years was used to indicate the remaining life-years X. The interviewer halved the number of years and asked, whether X/2 years in full health would be equally good as X years in your present health state. If yes, X/2 was recorded. If not, the person was asked: More or less? If the answer was more, the segment X-(X/2) was halved and the equality question was repeated. This halving upward or downward was repeated until the indifference point Y was reached. The resulting TTO score is Y/X. If the respondent was unwilling to forgo any of X, the score is 1, and 0, if he/she was willing to forgo all of X.
Statistical Analysis
The sixty-four missing data entries on the 15D questionnaires were replaced with a regression technique (Reference Sintonen20). Chi-squared test was used to test differences in distributions. Paired samples t-test and Kolmogorov-Smirnov test were used to explore, whether the difference between the sets of scores deviates from zero and whether the difference is normally distributed, respectively. As the difference turned out statistically significant and distribution non-normal, two conventional ways of testing the agreement between two sets of scores were excluded: intra-class correlation coefficient (Reference Müller and Büttner14) and Bland-Altman limits of agreement (Reference Bland and Altman3). Therefore, paired samples Wilcoxon signed rank test was used to test the null hypothesis that there is no tendency for one set of scores to be higher or lower than the other set, and the Spearman rank correlation coefficient to measure the association between the sets. These analyses were performed with SPSS 15.0.
Empirical relationships between TTO and 15D scores were estimated with Tobit models for two reasons. The distribution of dependent variable (TTO score) was skewed and censored at 0 and 1 and besides a considerable proportion of observations was at 1 (Reference Austin2). Several functional forms were estimated as potential representations of the relationship: linear, quadratic, and cubic. In the linear model, 15D score (D15SCORE) was entered as the sole explanatory variable with a constant (model 1), in model 2 D15SQUARED, and in model 3 D15CUBED was added.
In model 4, variables describing the demographic and socioeconomic status and health state of the respondent were entered in addition to D15SCORE. Dummies for gender, education, and marital status were entered, because sometimes they have been found to affect valuations (Reference Dolan and Roberts5). The duration of the illness, injury, or health problem, because of which the respondent was seeking or getting treatment was entered, as with longer duration the patient may adjust to the health problem and consequently valuations may be affected (Reference Menzel, Dolan and Richardson12;Reference Menzel, Gold and Nord13). It is expected that with longer duration, other things equal, higher valuations are provided. Dummies for having another illness or injury diagnosed by a physician than the one due to which he/she was seeking or getting treatment, and for having health problems that did not come up on the 15D questionnaire were included. If the coefficients of these variables become statistically significant, they suggest that the 15D does not provide a complete description of the respondent's health state that he/she is valuing with TTO.
Statistical life expectancy at the respondent's age was included, because some evidence suggests that the expected duration of health states to be valued affects valuations. This variable can also be used to test, whether the constant proportional time trade-off applies, that is, whether the respondents are willing to sacrifice a constant proportion of their remaining lifetime to achieve a given improvement in their health. This is required for the QALY model to hold (Reference Dolan4;Reference Dolan and Stalmeier6).
Finally, the dummies for the healthcare units were entered in turn in addition to D15SCORE. The idea is that, to the extent that their coefficients turn out statistically significant, the place of recruitment may carry information on the type or nature of respondent's health problems that the 15D is not able to completely reveal.
As a further test of agreement between the two sets of scores paired samples t-test was used to test, whether the constant deviates from 0 and the coefficient of 15DSCORE (slope) deviates from 1. If they do not, these statistics indicate that the two sets agree quite well.
Two specification tests were performed. For a modified RESET test, the linear prediction is calculated from the Tobit models. The prediction is squared and added to the models. The t-statistics of this variable serves as a test for the functional form of the original Tobit models. For testing heteroscedasticity, the difference between the linear prediction and observed value was calculated and squared. Then the square is regressed (OLS) on a constant term and the square of the linear prediction. The significance of the squared linear prediction serves as a test for general heteroscedasticity, and it may also indicate general misspecifiation (Reference Dolan and Sutton7). The models were estimated using maximum likelihood in LIMDEP 7.0 (Reference Greene10). A p value ≤ .05 was considered statistically significant.
RESULTS
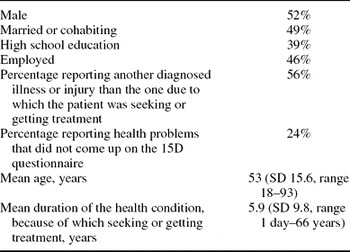
Altogether 1,283 patients were invited to participate in the study, but 390 refused or the interview was interrupted. Typical reasons for refusal were being too busy, tired, or confused. In sixteen cases, the interview had to be interrupted because the doctor's consultation commenced. The age structure of these 390 differed from that of those interviewed (χ2 = 15.4; df = 3) with the youngest and oldest age group being over-represented among refusers. For 30 patients, the TTO task was too difficult or they did not want to answer, leaving 863 pairs of TTO and 15D scores. The respondent characteristics are given in Table 1.
Sociodemographic and Other Characteristics of the Respondents (n = 863)

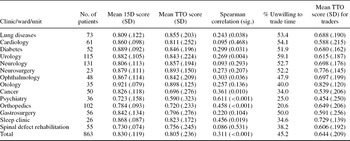
The distribution of patients between the healthcare units is shown in Table 2. For the whole sample, the mean 15D score was .830 (SD = .119) and TTO score .805 (SD = .236). The difference was statistically significant (p = .001) and its distribution non-normal (p < .001), probably due to the fact that 45.2 percent of respondents were unwilling to forgo life time at all, receiving thus a TTO score of 1. This can be clearly seen from Figure 1. In this case, a more suitable Wilcoxon test indicated that the null hypothesis of no tendency for one set of scores to be higher or lower than the other set cannot be rejected (p = .192). The Spearman correlation coefficient between the TTO and 15D scores in the whole sample was 0.311 (p < .001). The coefficients varied between the patient groups from .086 (p = .531) to .611 (p < .001) (Table 2).
The Distribution of Patients between Clinics/Wards/Units, Where They Were Recruited and Their Mean 15D and TTO Scores (SD), Spearman Correlation between the Sets of Scores, the Percentage of Patients Unwilling to Trade Time and the Mean TTO Score (SD) of Those Willing to Trade

The scatter plot of 863 pairs of time trade-off (TTO) and 15D scores (the diagonal represents full agreement).

The mean 15D and TTO scores differed quite a lot between the patient groups. These differences derive both from marked differences between the patient groups in the percentage of patients unwilling to trade time (20.6–59.1 percent) and in the mean TTO scores among those willing to trade (Table 2).
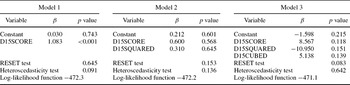
The results of Tobit models 1–3 are in Table 3. The coefficient of D15SCORE was statistically significant only in model 1, in other models all coefficients were nonsignificant. This suggests that the quadratic and cubic model do not fit the data better and the almost identical values of log-likelihood functions confirm that. The specification test statistics were in all models insignificant suggesting again that the other specifications were not superior to the linear one. In model 1, the constant did not deviate from 0 (p = .743) and the coefficient of 15DSCORE from 1 (p = .456).
The Linear, Quadratic, and Cubic Tobit Models for Explaining the Variance in TTO Scores (Coefficients and Their p Values in t Test)

The predicted TTO scores from Tobit model 1 (conditional mean functions with the range restricted to 0–1, not the linear predictions) against the 15D scores are shown in Supplementary Figure 1 (which is available at www.journals.cambridge.org/thc2010008). The 15D scores tend to be slightly higher than the TTO scores for mild health states (15D score > 0.8), whereas for worse health states the situation is the opposite.
The results of model 4 are in Supplementary Table 1 (which is available at www.journals.cambridge.org/thc2010008). Although a lower value of the log-likelihood function in comparison to model 1 suggests that the additional variables bring extra explanatory power, none of them brings it individually enough to be statistically significant. This suggests that model 1 does not need to be amended with these variables. The constant did not deviate from 0 (p = .550) and the coefficient of 15DSCORE from 1 (p = .459).
In none of the models with the 15DSCORE and a single healthcare unit dummy as explanatory variables did the constant deviate from 0 (p = .330–.940) and the coefficient of 15DSCORE from 1 (p = .349–.905). However, the coefficients of the following units were significant: lung diseases (marginal effect .070; p = .012), cancer (−.094; p = .003), orthopedics (−.075; p = .001), neurology (.075; p = .001), and psychiatry (−.106; p = .004). This suggests that these units may carry information on the type or nature of respondent's health problems that the 15D is not able to completely re veal.
DISCUSSION
This study set out to explore to what extent the 15D scores of a large number of heterogeneous patients agree with their TTO valuations of own health and to estimate an empirical relationship between these two sets of scores. The patients were recruited from outpatient clinics or wards of fourteen different healthcare units in randomly selected days. Within the time window for data collection the original aim of recruiting at least 60 patients from each unit was not fulfilled, as the number of respondents varied between 23 and 131. The patients are neither consecutive nor randomly selected, as only those patients were invited to participate, who were deemed by the head nurse to be physically and mentally capable for interview.
It is well established that the framing and administration of TTO valuation tasks affect the resulting valuations (Reference Arnesen and Trommald1). We searched the indifference point with a halving upward or downward procedure. This was more convenient than often used ping–ponging with fixed values, because the duration of health states to be valued varied individually rather than was fixed as usually (e.g., at 10 years). Therefore, the ping–pong schemes would have been different depending on the statistical life expectancy of the respondent. Further studies are needed to explore whether our way of phrasing and administering the TTO task produces different results from other ways, but the gold standard way is still to be established (Reference Arnesen and Trommald1).
The Spearman correlation in the whole sample was statistically highly significant, but in absolute value fairly low and varied quite a lot between patient groups. This is probably at least partly explained by the considerable and varying proportion of TTO scores of 1. The agreement was not good at the individual level and in some patient groups. However, in the light of several tests the agreement is quite good at the aggregate level and after testing several Tobit models and functional forms and carrying out diagnostic tests it turned out that a simple linear model describes best the relationship between the two sets of scores. Although the Tobit model may not be suitable for analyzing censored HRQoL scores in all circumstances (Reference Austin2;Reference Saarni, Härkänen and Sintonen19), the specification tests showed that, in this case, the model did not suffer from heteroscedasticity and misspecification.
Apart from the 15D score none of the explanatory variables describing the demographic and socioeconomic status and health state of the respondent affected statistically significantly the TTO scores. The insignificance of LIFEXP suggests that on average respondents are willing to sacrifice a constant proportion of their remaining lifetime to achieve a given improvement in their health. This means that the constant proportional time trade-off applies and the QALY model seems to hold.
Duration of health states has usually been found to affect valuations in studies, where hypothetical health states with different fixed durations have been valued. However, in practice, the duration is usually uncertain and, therefore, was left unspecified and uncertain, when valuations for the 15D were elicited. The mean values obtained thus reflect the average attitude to uncertainty in duration. This study indicates that the mean 15D scores thus generated agree on average well with the mean TTO scores of patients own health states with varying, but unknown durations.
The coefficient of the duration of the illness (DURILL) did not reach statistical significance. This suggests that, other things equal, adjustment does not affect the TTO valuations. Because the average duration was 5.9 years (range, 1 day to 66 years), one can argue that adjustment has already taken place and further increase in duration does not matter. A model, in which DURILL was replaced by a dummy taking a value of 1, if the duration was ≤7 days (“acute condition”) and 0 otherwise, produced the same result. However, DURILL is not the same as the duration of the present health state that was valued—we do not know its past duration before valuation. Thus, this study does not necessarily provide an answer to the issue of adjustment regarding the health state that was valued.
The coefficients of ILLINJ and PROBLEM did not turn out to be significant. This suggests that these variables may not carry additional information on the type or nature of the respondents’ health problems to that embodied in the 15D score so as to affect TTO valuations significantly. However, the significant coefficients of some healthcare units (lung diseases, cancer, orthopedics, neurology, and psychiatry) suggest that these units may carry such information. It is hard to say whether these differences would be clinically important as well, because the minimal clinically important difference may not be similar in different diagnoses and may also depend on the level of HRQoL on a 0–1 scale. It is also possible that there exists additional extraneous and situational, non–health-related determinants not captured by the 15D, which affect the TTO valuations.
A similar agreement as in this study between the TTO valuations of patients’ own health and their 15D scores has been found in three earlier studies. Among epilepsy patients, the mean 15D and TTO scores were 0.89 and 0.92, respectively (Reference Stavem23). Among COPD patients, the mean TTO score was 0.01 higher than the mean 15D score (Reference Stavem22). In a mixed group of outpatients and inpatients, the 15D scores explained 28.9 percent of the variance in the self-rated TTO scores, whereas SF-6D, AQoL, HUI3, and EQ-5D (with the UK TTO ‘tariff’) scores explained 23.8 percent, 20.4 percent, 16.6 percent, and 11.9 percent, respectively. Moreover, the magnitude of the change in the TTO score predicted by the 15D was almost identical to the magnitude indicated by the self-rated TTO (Reference Hawthorne, Richardson and Day11).
However, the picture is not quite as clear-cut as these results might suggest. One problem is a great proportion of patients (probably also in the studies mentioned above, although not reported), who were unwilling to trade time at all, and this proportion varied considerably between patient groups. This phenomenon has been observed even among seriously ill patients (Reference Tsevat, Cook and Green25). This may have several implications.
First, the good agreement at the mean level seems to stem from two opposite effects: almost half of the group reject TTO and obtain a score of 1, and the rest tend to have lower TTO scores than 15D scores (Figure 1 and Table 2). Moreover, at least in some patient groups, the relationships may be different and need to be explored in more detail in larger data sets. An interpretation is that the empirical practices used so far for eliciting TTO valuations on patients’ own health in cross-sectional settings are insensitive especially to mild and moderate health losses and thus raises doubts about their validity and usefulness (Reference Fowler, Cleary and Massagli8).
Second, if the TTO elicitation is insensitive in cross-sectional settings, it cannot be responsive to change, either, because of the strong ceiling effect. Therefore, finding out, what factors are associated with unwillingness to trade lifetime would be of great interest and an important research agenda itself. A study by Fowler et al. (Reference Fowler, Cleary and Massagli8) gives already one answer. On the basis of such research new, more sensitive approaches to TTO elicitation might be developed. The 15D valuation algorithm is based on the use of rating scales, which may be a road to follow as Parkin and Devlin (Reference Parkin and Devlin17) argue.
CONCLUSIONS
The agreement between the 15D and TTO scores as elicited turned out quite good at the aggregate level. To the extent that mean TTO valuations of patients are valid for QALY calculations, the mean 15D scores are valid without any transformation in a large group of heterogeneous patients. This suggests that the mean 15D scores can be substituted for patients’ mean TTO scores. However, in certain patient groups the agreement was not good and extra information needs to be brought to bear to get a better estimate. It would be interesting to see, how the other instruments of the same type as the 15D would perform in this validity test.
SUPPLEMENTARY MATERIALS
Supplementary Figure 1
Supplementary Table 1 journals.cambridge.org/thc2010008
CONTACT INFORMATION
Tarja Honkalampi, MSc, (tarja.honkalampi@tehy.fi) Director, Development unit, Tehy ry, Asemamiehenkatu 4, 00060, Tehy, Helsinki, Finland; PhD Student, Harri Sintonen, PhD (harri.sintonen@helsinki.fi) Professor of Health Economics, Department of Public Health, University of Helsinki, P.O. Box 41, 00014 Finland; Research Professor, Finnish Office for Health Technology Assessment, National Institute for Health and Welfare, P.O. Box 30, 00271 Helsinki, Finland