

The formation of coalition governments following parliamentary elections determines who will be prime minister and what policy guidelines they will pursue. There has been much debate as to whether the large parties leading coalition formation (formateurs) or the smaller parties joining them (non-formateurs) have an advantage in coalition negotiations.
Smaller parties have often been seen as having disproportionate power. By deciding which of the larger parties to join in a coalition, they are able to tip the balance of power and decide who will rule. This gives them a kingmaker role that, critics complain, provides them with disproportionate gains in coalition negotiations. By contrast, smaller parties within a coalition are often criticized by their constituents as being powerless, forced to support policies of a ruling party that they spent years criticizing.
One of the most significant aspects of coalition formation is the allocation of ministers as payoffs to parties that agree to join the government. Here too there is debate as to which parties are able to wrangle the most important ministerial positions during coalition negotiations. The results of ministerial allocation have important consequences due to ministers’ control of the government agencies that form and implement public policies.
The important consequences of coalition formation on governing and policymaking have spurred an abundance of research on portfolio allocation during the past six decades. Quantitative studies have shown the allocation of ministers to be proportional to parties’ size within a coalition. However, this article builds on recent qualitative research that challenges what has come to be known as the ‘Law of Proportionality’ and analyses whether different types of parties are more successful in obtaining payoffs that are more salient to their policy goals. This work also examines salience in the allocation of two additional types of coalition payoffs that have been overlooked in most previous coalition studies: junior ministers and parliamentary committee chairs.
The analysis in this study examines data on the allocation of 314 payoffs – ministers, junior ministers and committee chairs – in eight Israeli coalition governments from 1992 to 2015. The use of a single-country study enables the determination of each payoff’s salience for the party obtaining it, something not measured in cross-national and longitudinal coalition allocation studies. In examining coalition allocation salience, this article posits that the smaller non-formateur parties have an advantage and that niche parties, whose main policy concerns focus on existential danger, obtain the highest proportion of policy-salient payoffs. These hypotheses were partially confirmed by the research data and, contrary to expectations, non-formateur parties were found more likely to obtain policy-salient junior ministerial positions than formateur parties.
Progression of coalition payoff research
Payoff proportionality
Most quantitative coalition allocation research during the past seven decades has confirmed William Gamson’s (Reference Gamson1961) findings: that ministerial allocation for formateurs and non-formateurs is proportional to their coalition share (Browne and Franklin Reference Browne and Franklin1973; Warwick and Druckman Reference Warwick and Druckman2001, Reference Warwick and Druckman2006).Footnote 1 By contrast, theoretical research has found that formateurs receive a disproportionately larger share of ministerial portfolios, based on the assumption that the party powerful enough to form a government will negotiate a coalition that leaves it with the greatest payoff (Baron and Diermeier Reference Baron and Diermeier2001; Baron and Ferejohn Reference Baron and Ferejohn1989; Diermeier et al. Reference Diermeier, Swaab, Husted Medvec and Kern2008).Footnote 2
Some researchers have asserted the need to move beyond quantitative analysis and qualify parties’ payoffs based on their value or salience. However, determinations of salience have varied greatly. Eric Browne and Karen Ann Feste (Reference Browne and Feste1975), for example, proposed weighting portfolios according to whether they were chosen by formateurs, presuming that the strongest party would receive the most important payoffs. Paul Warwick and James Druckman (Reference Warwick and Druckman2006, Reference Warwick and Druckman2001) employed two different methods to integrate quantitative and qualitative coalition allocation analyses. In their first article (2001), ministries were weighted based on Michael Laver and Ben Hunt’s (Reference Laver and Hunt1992) ranking of major portfolios in 12 European countries. In their second article, Warwick and Druckman (Reference Warwick and Druckman2006) used expert surveys to interpret the values of ministerial portfolios allocated in 14 European countries from 1945 to 2000. In both articles, they found that while there is a slight advantage for smaller non-formateur parties, Gamson’s proportionality basically held true and is ‘still deserving of its law-like status’ (Warwick and Druckman Reference Warwick and Druckman2006: 660).
One of the problems with cross-national and longitudinal research is that the values attached to different portfolios remain constant across countries and time periods. Several recent coalition allocation studies have sought to focus on payoffs’ salience for different parties. Both Johannes Raabe and Eric Linhart (Reference Raabe and Linhart2015), and Hanna Bäck et al. (Reference Bäck, Debus and Dumont2011), for example, find that parties pursue coalition payoffs according their policy priorities. Similarly, Alejandro Ecker et al. (Reference Ecker, Meyer and Müller2015) contend that while quantitative allocation is proportional, the sequence of coalition negotiations enables larger parties to gain the positions most important to them.Footnote 3 This article tests previous findings of proportional allocation through a focused single-country analysis of the policy salience of coalition allocation for formateurs and non-formateurs.
Broadening the scope of payoff analysis
Analyses of coalition payoffs have mainly examined the allocation of government ministers who, due to their policymaking power, have been characterized by researchers as virtual dictators in their policy domains (Martin Reference Martin2004; Thies Reference Thies2001). Yet, post-election coalition negotiations also determine the allocation of deputy (junior) ministers and parliamentary committee chairs. While studies have discussed the importance of deputy ministers (Giannetti and Laver Reference Giannetti and Laver2005; Lipsmeyer and Pierce Reference Lipsmeyer and Pierce2011; Thies Reference Thies2001) and committee chairs (Carroll and Cox Reference Carroll and Cox2012; Kim and Loewenberg Reference Kim and Loewenberg2005) in influencing legislation and monitoring ministers from rival coalition partners, these payoffs have not been included with ministers in a coalition allocation analyses.
However, deputy ministers have access to the same agency personnel and resources as ministers. In some circumstances, a prime minister holding an additional portfolio may appoint a deputy minister to deal with issues for which the prime minister does not have time. In this capacity, a deputy minister’s influence on policymaking may be as important as a minister’s. Moreover, a deputy in an especially important ministry (e.g. education or finance) may have more impact on policy issues of great public interest than a minister from a lesser ministry (e.g. energy). Similarly, committee chairs have a powerful role in advancing or stalling legislation and increasing public interest in particular policy issues by holding hearings and choosing who will be called to testify. Thus, by including deputy ministers and committee chairs in the analysis, this article broadens the scope of research on the salience of payoffs in coalition allocation.
Hypotheses
In order to expand on previous allocation analyses, this article begins with the assumption that the consensus in previous research is correct and that overall (quantitative) payoff allocation – not taking into consideration the (qualitative) salience vis-à-vis each recipient’s policy goals – is proportional to parties’ coalition share. The three hypotheses in this work look beyond quantitative results and focus on payoffs’ salience in terms of their utility to the receiving parties’ policy goals. Based on research on parties and coalitions, different outcomes are anticipated for coalition formateurs and non-formateurs in obtaining payoffs that are most salient for their policy objectives. To this end, the first hypothesis posits:
Hypothesis 1: Non-formateur parties obtain a greater share of policy-salient payoffs relative to their coalition share.
This hypothesis is based on research on party behaviour in coalition negotiations. Parliamentary governments are usually led by larger, centrist parties that form coalitions with smaller parties which advocate for particular issues or segments of the population. The larger formateur parties aiming to lead a government are, according to Browne and Franklin (Reference Browne and Franklin1973: 461), ‘willing to surrender a portfolio or two in order to obtain the support of a small coalition partner which is no threat to their leadership position’. By contrast, smaller parties, defined by one or two specific policies, have been shown to prioritize more adamantly their policy goals (Adams et al. Reference Adams, Clark, Ezrow and Glasgow2006; Meguid Reference Meguid2005) and seek the ministries germane to those policies in coalition formation negotiations (Bäck et al. Reference Bäck, Debus and Dumont2011; Evans Reference Evans2018b; Raabe and Linhart Reference Raabe and Linhart2015; Strøm and Leipart Reference Strøm and Leipart1993). Consequently, Hypothesis 1 expects that smaller non-formateur parties are more likely to either emerge from coalition bargaining with tangible payoffs in their policy area, or show their electorate that they maintained their principles by joining the opposition.
The second hypothesis also builds on literature on party behaviour and focuses on the distinction between payoff allocation to different types of non-formateur parties:
Hypothesis 2: Non-formateur parties whose primary policy goals concern existential danger obtain the highest proportion of policy-salient payoffs relative to their coalition share.
This hypothesis integrates coalition research with studies on smaller parties. The larger, centrist, formateur parties are often joined in government coalitions by smaller, less centrist, parties that have been characterized as extreme parties (Kedar Reference Kedar2005) or niche parties (Adams et al. Reference Adams, Clark, Ezrow and Glasgow2006; Meguid Reference Meguid2005). Such parties have been found to be more steadfast and less flexible in policymaking than larger centrist parties (Adams et al. Reference Adams, Clark, Ezrow and Glasgow2006). Based on these findings, this hypothesis expects these parties to pursue more doggedly coalition payoffs that are policy salient.
Thus, while the first hypothesis discerns differences between formateurs and non-formateurs, the second hypothesis distinguishes between different types of non-formateur parties. The parties in the case study (below) are sorted into four groups. The first three groups are characterized by the fact that the primary policy goals that they advocate seek to avoid existential danger. There is extensive literature on the perception of existential threats from war, terrorism, infringement on ethnic identity, immigration, climate change or religious beliefs (Abulof Reference Abulof2009; Alexseev Reference Alexseev2011; Fritsche and Häfner Reference Fritsche and Häfner2012; Sheikh Reference Sheikh2012; Thomas Reference Thomas2007).
The first two groups comprise right-wing parties that emphasize national security, and left-wing parties that advocate territorial compromise to achieve a peace settlement. Both party groups – through different approaches – seek to protect the state’s citizens from the existential danger of war and terror attacks. The third group is religious parties, whose members’ and electorate’s perceptions of existential dangers are based on fear of divine wrath if righteous behaviour and education are not pursued.
The fourth party group is the socioeconomic group, whose policy goals are less concerned with existential dangers. Therefore this group is contrasted with the other three groups. Historically, some socioeconomic concerns present existential threats, such as the need for food and shelter. However, most contemporary socioeconomic parties focus more on middle-class policies to improve living standards.Footnote 4 Lacking the fear of threats to body or soul, parties in this group are expected to be less single-minded in negotiating policy-salient payoffs.
Finally, this work expands coalition research by including deputy ministers and committee chairs. Research has primarily focused on these two payoffs’ importance for monitoring ministers (Martin Reference Martin2004; Thies Reference Thies2001). Based on prior studies of these positions and party behaviour, the third hypothesis posits:
Hypothesis 3: Formateur parties obtain more policy-salient deputy ministers and committee chairs than non-formateurs in order to monitor coalition partners.
Thus, when formateurs are forced to surrender certain ministries to their smaller partners, they use their superior position to allocate deputy ministers or chairs of related parliamentary committees to one of their own members in order to monitor their coalition partners’ ministers.
Methodology
Study framework
Analysing the policy salience of ministries and committee chairs allocated in coalition negotiations requires an understanding of the influence and power of each of the payoffs and the priorities of the parties to whom they are allocated. The salience of these payoffs differs among parties, according to their policy priorities, and it varies from country to country. Consequently, this work uses a single-country study to identify each payoff’s policy salience for particular party groups, rather than cross-national and longitudinal data found in most prior allocation research.
Cross-national studies frequently categorize parties based on party manifestos in the Comparative Manifesto Project (CMP) database. One drawback to using manifestos for determining parties’ policy objectives is that these documents are often intentionally vague in order to appeal to marginal voters beyond the core electorate. Many smaller niche parties focus on one core issue. However, in order to gain legitimacy, avoid criticism of being one-issue parties, or attract additional voters, such parties will add topics of general consensus to their manifestos (Meguid Reference Meguid2005). A second problem with manifestos is that parties often cloak policy goals in coded language in order to blunt criticism or to draw voters who might not feel comfortable with the parties’ clear, but unstated, position.Footnote 5 Code words that are obvious to a country’s electorate may not be apparent in cross-national studies of manifestos and thus skew analysis of payoffs’ salience.
Longitudinal studies have similar drawbacks for analysing payoffs’ salience. Warwick and Druckman (Reference Warwick and Druckman2006: 660), for example, note methodological problems of longitudinal research that spans too large a period to make qualitative inferences about payoffs’ salience or ‘fail reality because they abstract away essential contextual features’. Such studies frequently fail to account for the evolution of parties, electorates and political debates over time (Bäck et al. Reference Bäck, Debus and Dumont2011; Laver Reference Laver2008; Strøm Reference Strøm1990). For example, the defence portfolio in several European countries had a different salience for parties at the height of the Cold War than in the late 1990s or 2018. Similarly, the agriculture and industry portfolios no longer have the salience for parties that they did in the 1950s through the 1980s. As new issues gain prominence, parties’ policy goals change, and with them the degree to which they value different payoffs.
The use of a single-country study, in a time frame defined according to that country’s political history, is in line with Kaare Strøm’s (Reference Strøm1990: 594) call for research to account for institutional frameworks with ‘intensive and theoretically guided research on a country to country basis’. Institutional frameworks, formal and informal, affect the decision-making of political leaders and the electorate (Hall and Taylor Reference Hall and Taylor1996; Kedar Reference Kedar2005; Streeck and Thelen Reference Streeck and Thelen2005). Single-country studies enable inductive analyses that incorporate contextual and institutional factors (Gerring Reference Gerring2004; Hall Reference Hall2004). The few coalition studies that have been based on single-country analyses have helped test theories and advance understanding of political behaviour. Examples include Carol Mershon’s (Reference Mershon1996) study of Italian coalition stability, Kaare Strøm and Jørn Leipart’s (Reference Strøm and Leipart1993) analysis of Norwegian coalition avoidance, and Terry Clark et al.’s (Reference Clark, Larson, Mordeson and Wierman2008) model of policy preference in Lithuanian portfolio allocation.
Israel, the setting for this study, offers a particularly useful framework to examine the policy salience of coalition payoffs. Its vibrant parliamentary system has been included in numerous comparative analyses of parties, coalitions and legislatures (Adams and Merrill Reference Adams and Merrill2009; Browne and Franklin Reference Browne and Franklin1973; Evans Reference Evans2014; Laver and Shepsle Reference Laver and Shepsle1990; Lijphart Reference Lijphart2012; Martin and Stevenson Reference Martin and Stevenson2001). Additionally, similar to the Netherlands, its low electoral threshold and single nationwide electoral district produce highly proportional outcomes and coalitions that require multiple partners. Moreover, the diversity of political parties and intensity of political debates facilitate identification of the most salient policy issues for each of the dozens of parties in parliament during the study period.
The time period in this study is defined in accord with shifts in Israel’s historical political framework. The policy space within which the different parties are currently aligned became clearly defined with the 1992 elections (Arian and Shamir Reference Arian and Shamir2008; Evans Reference Evans2007). Hence, the hypotheses are tested through an analysis of coalition payoffs in eight Israeli governments from 1992 to 2015.
Payoffs: ministers, deputy ministers and committee chairs
This study examines the allocation of roles in eight Israeli coalition governments, each of which comprised from three to six parties. Each of the coalitions was formed following national elections that produced between 10 and 15 parties in parliament.Footnote 6 Only the first coalitions formed through post-election negotiations are analysed. Subsequent changes were often the result of issues unforeseen in the elections, such as military conflict, resignations due to personality conflicts or scandals, and parties splintering. Hence, in order to avoid exogenous variables and build on previous coalition research, mid-term personnel shifts were not included.
This work broadens the scope of payoff analysis in two ways: First, contrary to previous research that excluded ministries deemed unimportant (e.g. Bäck et al. Reference Bäck, Debus and Dumont2011; Laver and Hunt Reference Laver and Hunt1992), this work analyses allocation of all ministerial positions, including ministers without portfolio. Since all ministers vote in cabinet decision-making, all ministers have some qualitative value. Additionally, inclusion of all payoffs enables a comparison of each group’s proportion of payoffs that were policy salient. Second, while most previous coalition studies have only examined the allocation of ministers, payoffs in this article include deputy (junior) ministers and committee chairs.
The coalitions studied in this work comprised from 17 to 30 ministers and 0 to 11 deputy ministers.Footnote 7 In many instances an individual was designated head of more than one ministry.Footnote 8 However, since ministers have only one vote in cabinet decision-making, no matter how many ministries they head, analysis is based on the number of ministers, not the number of ministries. Hence, the study encompasses a cumulative 188 ministerial and 61 deputy ministerial positions, together with 65 committee chairs from among the 12 permanent standing parliamentary committeesFootnote 9 – 314 payoffs in all – divided among 38 coalition partners, comprising parties with a total of 536 MPs.Footnote 10
Classification of parties’ and groups’ payoff salience
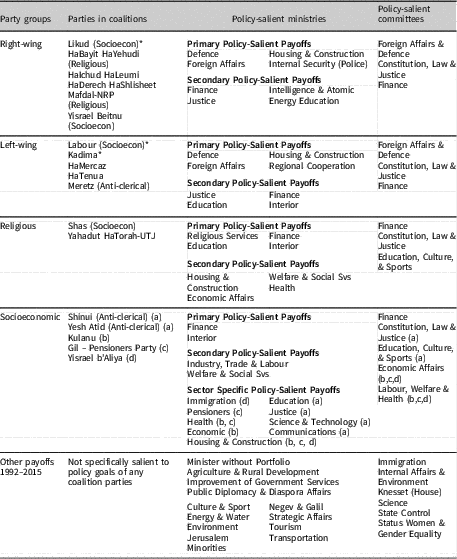
The salience of payoffs for the parties receiving them was determined based on a survey of Israeli political scientists.Footnote 11 In order to avoid selection bias, in which identification of payoff preferences is affected by parties having previously held particular payoffs, the expert survey was divided into two stages. First, respondents were asked to sort each of the parties that were in at least one of the coalitions into four groups (Table 1), akin to party families used in previous research (Bäck et al. Reference Bäck, Debus and Dumont2011; Budge and Keman Reference Budge and Keman1990; Pedahzur and Perliger Reference Pedahzur and Perliger2004; Raabe and Linhart Reference Raabe and Linhart2015). The group categories were determined by Israeli public polling during the study period, which showed the most important political issues to be security/peace, economics and religion (Arian and Shamir Reference Arian and Shamir2008; Hermann et al. Reference Hermann, Heller, Cohen and Bublil2015; Yaar and Hermann Reference Yaar and Hermann2005).
Party Groups

Notes:
* Formateur party in at least one of the coalitions studied.
( ) Parentheses indicate important secondary policy issues for parties.
Consequently, in accord with the country-specific framework, parties were sorted into four political groups (families): right-wing, left-wing, religious and socioeconomic. In Israeli politics, left and right are determined by security/peace policy, not economic policies. Parties on the political right have often supported active intervention in the economy and public subsidies for housing and other goods and services, while parties on the left have advanced economic liberalization and have received more support from affluent voters. Corresponding to Hypothesis 2, parties in both groups prioritize policies concerned with existential dangers: parties on the right stressing security policies and parties on the left advocating peace through territorial concessions (Arian and Shamir Reference Arian and Shamir2008; Evans Reference Evans2018a; Hazan and Diskin Reference Hazan and Diskin2009; Peretz and Doron Reference Peretz and Doron2000).
The third party group advocates policies supporting religious laws and institutions. This group comprises two parties representing the ultra-orthodox public, who strictly adhere to religious precepts and demand funding for religious institutions. For this group policies that affect religious observance, in accordance with Hypothesis 2, are an existential danger.Footnote 12
Public opinion polling shows socioeconomic issues to be the third (sometimes second) area of greatest concern (Hermann et al. Reference Hermann, Heller, Cohen and Bublil2015; Yaar and Hermann Reference Yaar and Hermann2005). Political parties in this group have prioritized a variety of policies, such as increased funding for pensioners or immigrants, or reducing funding for religious institutions to benefit middle-class taxpayers. In contrast with the other three groups, this group’s policy priorities are not associated with existential danger. As explained above, parties in this group primarily promote policies to improve their constituents’ living standards and economic standing.
In the first stage of the expert survey, parties were sorted according to primary and secondary policy priorities. The categories for secondary priorities were determined by party manifestos, public statements and prior research (Arian and Shamir Reference Arian and Shamir2008; Hazan and Diskin Reference Hazan and Diskin2015; Schofield and Sened Reference Schofield and Sened2005). This distinguished, for example, between right-wing parties HaBayit HaYehudi, which promotes traditional religious values, and Yisrael Beitenu, a secular party that advocates support for immigrants.
In the second stage, respondents were asked to identify the ministries and committees most salient to the policy priorities of each party group. Linking the payoffs to groups rather than individual parties helped further reduce selection bias. This determined the four primary and four secondary ministerial preferences, and the three committee chair preferences for each group.Footnote 13 Some modifications were made for strong secondary preferences for parties within those groups and for payoffs to the heterogeneous socioeconomic group (as explained above).
Coding payoffs
After determining payoff preferences for each party group, all of the positions allocated during the study period were coded based on the expert survey results. All ministerial and deputy ministerial payoffs were coded as: primary salience, secondary salience, or not salient, according to their policy value to the receiving party. Committee chairs – due to the smaller number of payoffs in this category – were coded as either salient or not salient. In cases where a minister was in charge of more than one ministry, and at least one of the payoffs was policy salient, then that position was coded salient and the rest of that minister’s positions were not coded.Footnote 14 As indicated above, each minister and deputy minister could only be counted once.
Hence, contrary to previous coalition studies, in which payoffs’ values remained constant, in this work payoffs’ salience varied according to the policy preferences of the party to which they were allocated. Consequently, some ministries were coded salient when held by one party and not salient when held by a different party. Additionally, coding of secondary policy objectives differentiated payoff salience for parties within the same family group.Footnote 15
It is worth noting that many ministries not coded salient for any of the coalition parties have important societal value. The Ministry of Environmental Protection, for example, is of great importance in any country. However, if a party has not seriously promoted or campaigned on environmental issues, the expert survey did not categorize that ministry as policy-salient for that party.Footnote 16 Thus, salience in this study does not indicate intrinsic value, size, budget or prominence, but relevance vis-à-vis a specific party group’s policy goals.
Determining the salience of the prime minister in coalition allocation requires weighing additional factors. Although it is the most powerful position in government, it is not focused on any specific policy area and the prime minister does not directly preside over policy implementation (Martin Reference Martin2004). In some countries prime ministers rule like chief executives in a presidential system, and in others they are more or less on an equal footing with other cabinet members (Lijphart Reference Lijphart2012). While the prime minister has the same vote as any other cabinet minister, he or she has a number of additional powers, such as party leader and agenda setting. The prime minister’s power to influence policy is further affected by personality, coalition composition and myriad institutional factors.
Thus, determining the salience of this position vis-à-vis a party’s policy objectives is complex and previous research has varied in the weights assigned to the prime minister.Footnote 17 In this work, the prime minister was automatically coded salient. If the prime minister held an additional portfolio its policy relevance was also assessed.Footnote 18 In seven of the eight governments prime ministers held at least one additional ministry, increasing the number of ministerial payoffs evaluated.Footnote 19
The data
Payoffs and coalition share
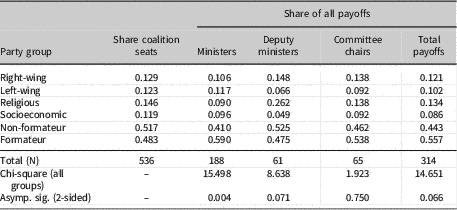
The analysis of the coded payoffs produced results that differ from previous empirical research. Formateur parties comprised 48.3% of coalition members in the eight governments studied (based on the number of MPs in each party), but received 59% of ministerial positions, 47.5% of deputy ministers and 53.8% of committee chairs, for a total of 55.7% of all payoffs (see Table 2). Non-formateur parties varied in size, but cumulatively comprised 51.7% of the coalitions and received 41% of ministers, 52.5% of deputy ministers and 46.2% of committee chairs, for a total of 44.3% of coalition payoffs. Chi-square tests indicate a significant variance in ministerial payoffs (p < 0.05) and deputy ministers and total payoff allocation (p < 0.1) relative to coalition share for the different party groups.
Allocation of Payoffs in Israeli Governments 1992–2015

Hence, contrary to previous empirical research, formateur parties enjoyed a significant, disproportionate quantitative advantage in payoffs allocated in coalition negotiations. The data also reveal that payoff allocation was not uniform among non-formateur party groups. Right-wing parties were the only group to exceed their coalition share in both deputy minister and committee chair payoffs. Religious parties had the greatest deficit in ministers, relative to coalition share, but received almost half of all non-formateur deputy ministers. The lowest proportional gains in total payoff allocation went to left-wing and socioeconomic parties, both of which received a lower proportional share of quantitative allocation in all three categories.
Payoff salience
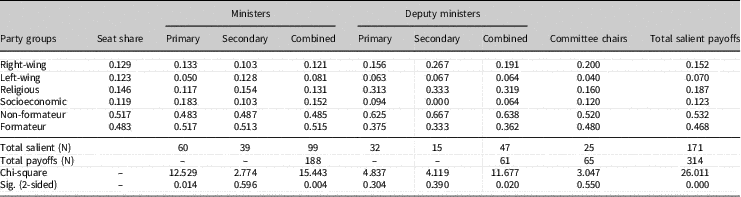
The fact that this analysis produced results that differed from the proportional findings of previous quantitative coalition studies is interesting. However, the primary focus of this article is the salience of payoffs to the different parties. As explained above, payoffs were coded according to their policy value to the receiving parties (Table 1). Cumulatively, 171 of the 314 payoffs (54.5%) were of primary or secondary salience for the parties that held them (Table 3). Deputy ministerial payoffs were far more policy salient (77%) than ministerial (52.7%) or committee chair (38.5) payoffs.
Salient Payoffs

In contrast to the quantitative results, formateurs obtained a lower proportion of policy-salient payoffs than their coalition share, while non-formateurs exceeded their coalition share in total salient payoffs. However, there are noteworthy differences in where policy-salient payoffs were acquired. Formateurs had a distinct advantage (relative to coalition share) in ministerial payoffs, while non-formateurs had an almost two-to-one advantage in policy-salient deputy ministers (committee chairs were almost exactly proportional to coalition share). Chi-square tests show significant variances (p < 0.05) in policy-salient payoff allocation for ministers, deputy ministers and total payoffs.
There were also disparities in allocation among the different non-formateur groups. Three of the four groups obtained policy-salient payoffs that were proportionately greater than their coalition share. Socioeconomic parties were the only non-formateur group to receive more policy-salient ministerial payoffs than their coalition share, while right-wing and religious parties were especially successful in obtaining policy-salient deputy ministers and committee chairs. The only non-formateur group that received less than its coalition share in every category was left-wing parties. One of the advantages of a single-country study is that it enables further investigation of idiosyncratic outcomes, such as the disproportional allocation of policy-salient payoffs. In this case the results are somewhat distorted by one religious party’s preference, for ideological reasons, to receive deputy positions rather than full ministries.
Payoff proportionality
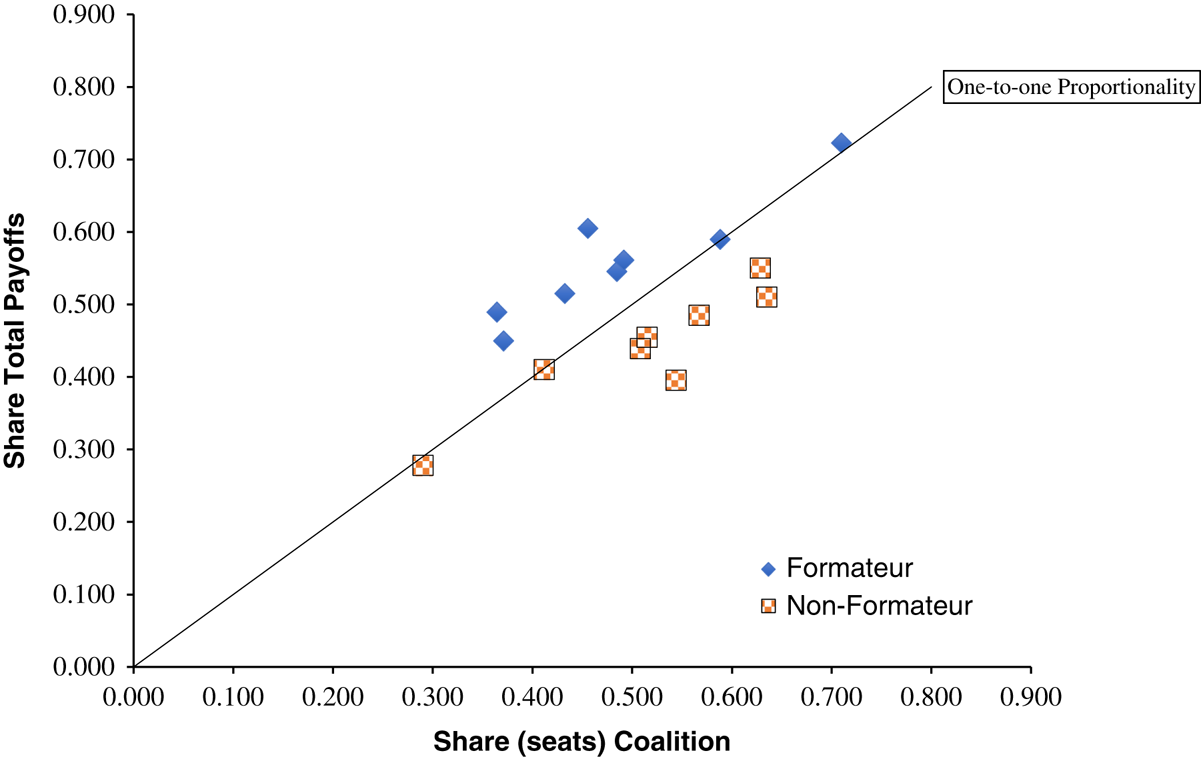
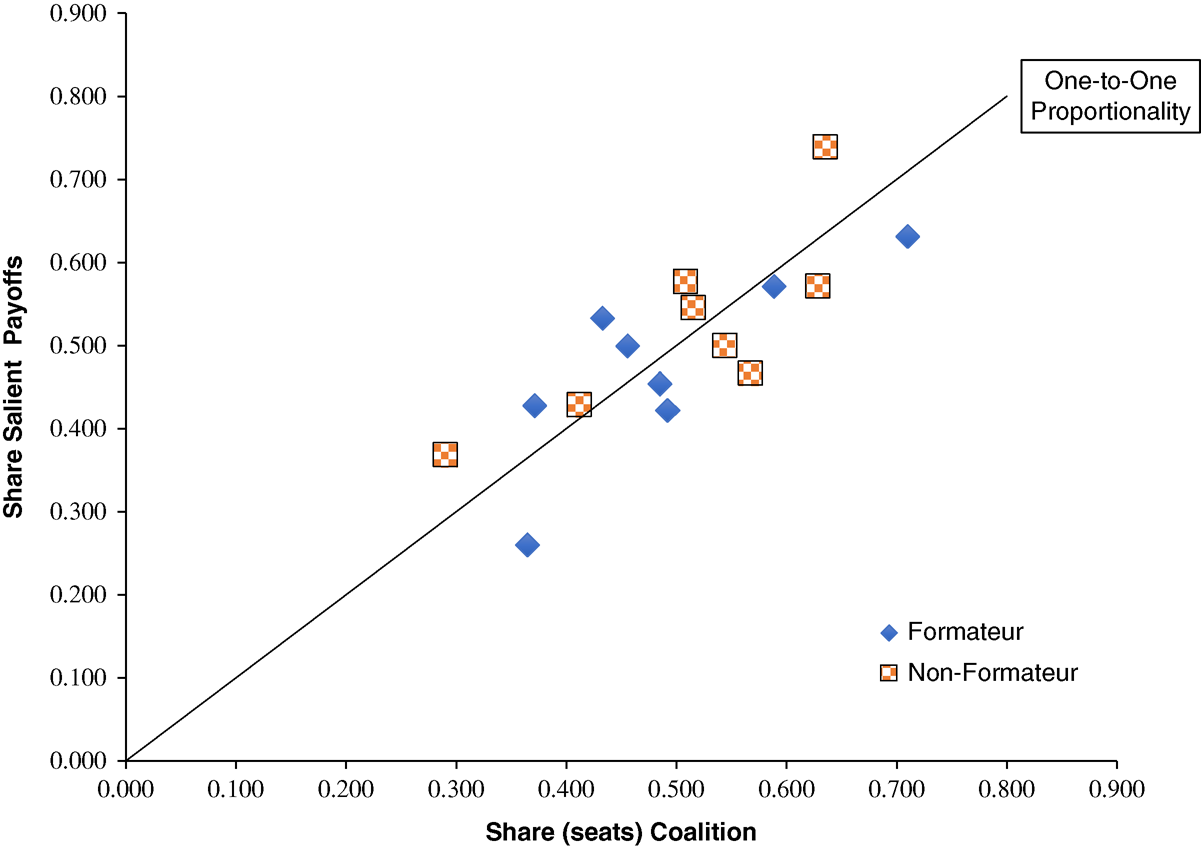
In their cross-national study, Warwick and Druckman (Reference Warwick and Druckman2006: 651) elucidated the correlation between payoffs and coalition share through a scatterplot. This tool is used below to compare quantitative and qualitative payoff allocation in each of the coalitions. While there was a moderately high correlation (R = 0.565, significant at p < 0.05) between coalition share and total payoff allocation, as indicated in Figure 1, in all eight coalitions formateur parties received a higher share of total payoffs than their coalition share, while non-formateurs were under-compensated.Footnote 20
Total Payoffs vs Coalition Share

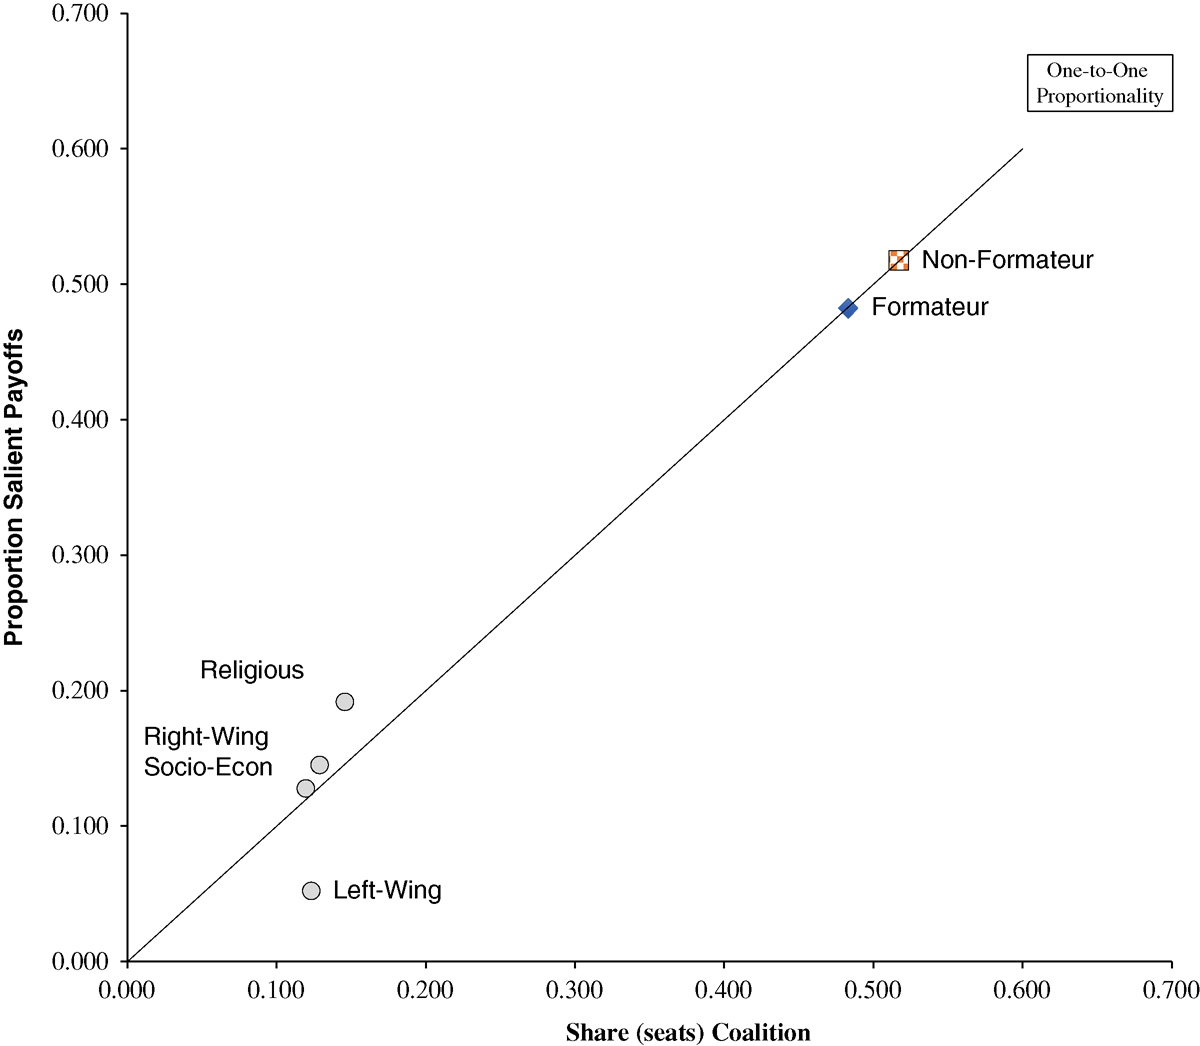
Examination of policy-salient payoff allocation in the eight coalitions (Figure 2) reveals a slightly greater correlation (R = 0.634, significant at p < 0.01). However, the contrast between the two figures illustrates the difference in the quantity and quality of allocated payoffs. While in Figure 1 all of the formateurs are above the line of proportionality, in Figure 2 the outcome is somewhat reversed. In five of the eight governments formateur parties obtained a proportion of policy-salient payoffs below their coalition share. Conversely, while non-formateurs were below proportionality in total payoffs in all coalitions (Figure 1), they were above proportionality in policy-salient payoffs in a majority of governments (Figure 2).
Policy-Salient Payoffs vs. Coalition Share

As noted above, the single-country study facilitates examination of outcomes for different party types. Based on the above data, Figure 3 indicates that while combined allocation of policy-salient payoffs in the eight coalitions slightly favoured non-formateurs, some party groups were more successful than others in obtaining payoffs that advanced their policy objectives. Religious parties’ policy-salient payoffs, followed by right-wing and socioeconomic parties, sit above the line of proportionality, while left-wing parties’ share of policy-salient payoffs places this group well below proportionality.
Proportionality of Policy-Salient Payoffs by Party Group

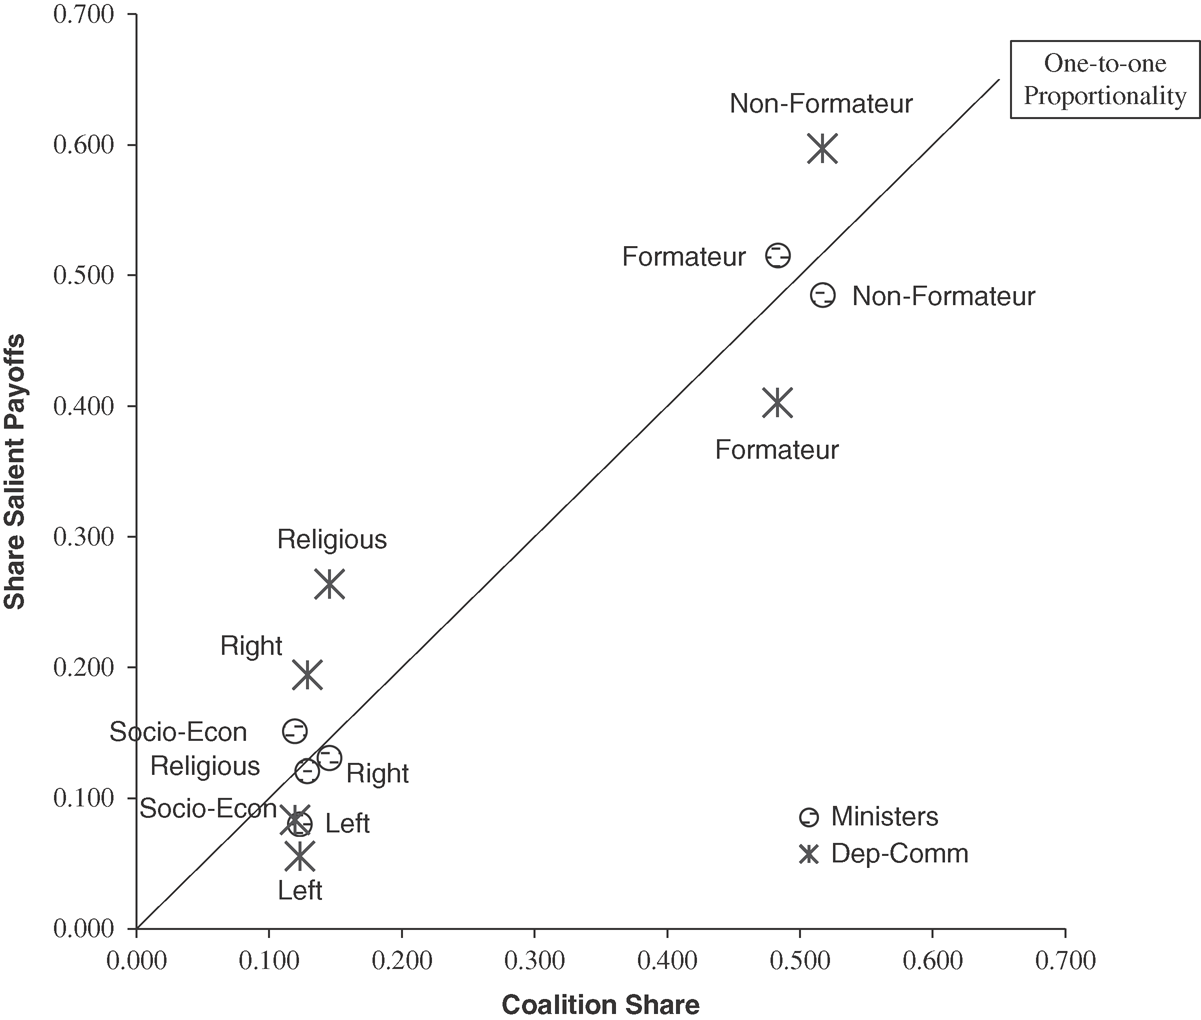
The allocation of different types of policy-salient payoffs was not uniform. As shown in Figure 4, formateurs obtained policy-salient ministerial payoffs in greater proportion than their coalition share and combined deputy ministerial and committee chair payoffs below their coalition share. For non-formateurs the reverse was true. Among non-formateurs, socioeconomic parties were the only group allocated policy-salient ministerial payoffs above the line of proportionality. However, this group’s share of policy-salient deputy and committee payoffs was well below proportionality. Religious and right-wing parties obtained policy-salient ministerial payoffs slightly below their proportion of coalition share, but their overall positive allocation of combined policy-salient payoffs (in Figure 3) was based on deputy ministerial and committee chair payoffs well above proportionality. Figure 4 highlights left-wing parties’ disproportionately poor results, as the only group whose policy-salient allocation was below the line of proportionality in every category.
Policy-Salient Payoffs by Type and Party Group

Evaluation
This work began with the assumption that the findings of proportional allocation in previous empirical research, from Gamson (Reference Gamson1961) on, would hold true in this study for quantitative, but not qualitative, measures of coalition payoffs. However, the data in Table 3 reveal that in the eight governments from 1992 to 2015 there was a significant difference in the allocation of the 314 total payoffs. Despite comprising only 48.3% of the coalitions, formateur parties obtained 59% of all ministerial positions and 55.7% of total payoffs. Thus, contrary to previous empirical research findings, and Gamson’s Law, but supporting most earlier theoretical work, the results do not support this assumption. There are a number of possible explanations for the divergence from earlier empirical studies. For example, cross-national and longitudinal studies may average proportional differences that are more apparent at a national level or during specific time periods. Also, previous works have either excluded ministries or valued ministries differently, which also may have resulted in different findings. This discrepancy, though not the focus of this work, is worth further investigation.
Based on research indicating behavioural differences between larger centrist parties and smaller niche parties, it was hypothesized (Hypothesis 1) that non-formateur parties would obtain a greater share of policy-salient payoffs relative to their coalition share. The data in Table 3 partially validated this hypothesis. Non-formateur parties were allocated a slightly (though statistically significant) greater share of combined policy-salient payoffs than their coalition share. However, the results were not uniform across non-formateur groups and (except for socioeconomic parties) were based on greater deputy ministerial gains compensating for underperformance in policy-salient ministerial payoffs. Non-formateurs’ slight proportional advantage in policy-salient payoffs is more noteworthy in the context of their disadvantage in total payoffs (Figure 2 vs Figure 1). Additionally, it may be argued that without left-wing parties non-formateurs’ advantage in policy-salient payoffs would have been greater. It is also worth noting that these results include formateurs’ allocation of additional policy-salient payoffs in each government for prime ministers, which comprised approximately 16% of formateurs’ policy-salient ministerial payoffs. This means that non-formateurs’ allocation of the payoffs directly responsible for policy implantation was even greater. Hence, while the data support Hypothesis 1, they also highlight the complexity of calculating payoffs’ policy salience.
Based on research on niche or extreme parties, it was posited (Hypothesis 2) that non-formateur parties whose primary policy goals concern existential danger would obtain the highest proportion of policy-salient payoffs relative to their coalition share. Three of the four non-formateur party groups in this study – religious, right-wing and left-wing parties – advocate policies concerned with perceived existential danger (security, peace, divine judgement) and were compared with socioeconomic parties, which generally campaign on policies to improve voters’ living standards. As illustrated in Figure 3 (based on the data in Table 2), there were significant differences in policy-salient payoff allocation among the different party groups. Consistent with Hypothesis 2, religious parties, followed by right-wing parties, received the greatest proportion of policy-salient payoffs. However, left-wing parties obtained the lowest proportion of policy-salient payoffs relative to their coalition share and were surpassed by socioeconomic parties, who obtained the highest proportion of policy-salient ministerial payoffs. Consequently, Hypothesis 2 was not validated.
Finally, it was expected that while coalition negotiations may lead formateurs to surrender some ministries to smaller parties, they are able to use their advantage to secure payoffs that allow them to keep an eye on coalition partners in the ministries they relinquish. Thus, it was hypothesized (Hypothesis 3) that formateur parties would obtain more policy-salient deputy ministers and committee chairs than non-formateurs in order to monitor coalition partners. The data in Table 2 and Figure 4 showed this to be incorrect. Non-formateurs obtained a much greater proportion of policy-salient deputy ministers and committee chairs than formateurs.
However, the results were not uniform, with non-formateurs’ advantage based on payoffs to religious and right-wing parties. The failure to validate fully all three hypotheses highlights the gap between this work and previous studies upon which these hypotheses were based. Similar studies in other countries will increase the understanding of policy salience in coalition allocation for different types of parties and different types of payoffs.
Discussion
This work makes several contributions to furthering the development of coalition allocation theory. First, the analysis of payoff salience builds on a progression of coalition research that has advanced from Gamson’s quantitative measure of proportionality to recent integrated qualitative and quantitative approaches.
The single-country study in this work supports assertions in previous research of the need for coalition analyses to recognize institutional differences between countries. Formal frameworks, such as type of electoral system, electoral threshold and legislative rules, affect the number and variety of political parties, which has an important impact on coalition dynamics. Consequently, coalition formation in Britain’s first-past-the-post system, Japan’s mixed electoral system, and the Netherlands’ proportional system, involve different types of parties whose incentives in negotiating payoffs vary greatly. Informal frameworks, including countries’ culture, demography, geography and whether the country is grappling with existential threats, also affect parties’ negotiating behaviour and the values of different payoffs. Thus, for example, the salience of certain coalition payoffs varies for ethnic separatist parties in Spain or Belgium and nationalist parties in Japan concerned with threats from China. Similarly, some parties in Europe have presented immigration and climate change as existential dangers. The intensity with which such parties negotiate for particular portfolios differs from, for example, parties focused on industry or agriculture in the 1970s.
This article’s single-country study of coalition payoffs within a country-specific, defined time period provides a more focused contextual analysis of payoffs’ salience for the parties receiving them than cross-national and longitudinal studies that incorporate hundreds of parties in dozens of countries during a 50-year period. In so doing, this study seeks to advance qualitative analyses of coalition allocation. Replication of this work’s method in other single-country analyses will further development of a comprehensive theory of coalition allocation that takes into consideration the context of time and place, and accounts for differences in policy salience for different types of coalition payoffs among different parties.
Additionally, this article contributes to the under-studied value of deputy (or junior) ministers and committee chairs in coalition allocation. Whereas previous research has examined these positions primarily in terms of their utility for monitoring ministers, this work indicates that non-formateur parties frequently obtain these payoffs in the areas of highest policy salience. These findings strengthen assertions in previous studies of the need to include these positions in coalition research.
This article also contributes to research on party families. Grouping the parties by ideology helped elucidate differences in outcomes among non-formateur parties. Future single-country studies should refine party groupings in accord with different countries’ policy space. Left-wing parties’ disproportionately low allocation raises some interesting questions. For example, are different types of parties’ coalition negotiation goals and methods affected by their ideology? In this case, were parties that advocate compromise in order to achieve peace more likely to compromise coalition payoffs in order to achieve their policy objectives of preventing the existential danger of war? Further studies of party families in coalition bargaining will provide greater insight into the relationship between party type and negotiation behaviour.
Acknowledgements
The author would like to express his gratitude to Professor Reuven Hazan, Professor Orit Kedar and Dr Matan Sharkansky of the Hebrew University in Jerusalem for their valuable suggestions.