Depressive symptoms are a public mental health concern in older adults(Reference Lu, Xu and Huang1), exacerbating chronic illness outcomes, and increasing mortality, suffering, family disruption and disability, thereby impairing quality of life(Reference Chen and Mui2). Life satisfaction, defined as an individual’s perception of their cultural and value systems relative to their goals, expectations, standards and concerns(3), is another key indicator of mental health(Reference Cosco, Howse and Brayne4,Reference Koivumaa-Honkanen, Kaprio and Honkanen5) . Studies have shown a gradual decline in the life satisfaction of older adults, highlighting the need for improved mental health promotion(Reference Cosco, Howse and Brayne4).
Dietary intake is identified as a modifiable health determinant(Reference Emanuel, McCully and Gallagher6–Reference Shi, Rundle and Genkinger10), influencing frailty(Reference Zhang, Wang and Hao11), hypertension(Reference Gao, Wang and Shen9), breast cancer(Reference Shi, Rundle and Genkinger10) and depressive symptoms(Reference Chen, Cao and Hou12). Moreover, plant-based diets (PD), characterised by low frequency of animal food consumption, are increasingly recommended for their health benefits(Reference Qi, Yang and Sheng13). Chen et al. found that PD, particularly when rich in high-quality plant foods, such as whole grains, fruits, vegetables and nuts, was associated with a lower risk of cardiovascular outcomes and intermediate risk factors in older adults(Reference Chen, Shen and Xuan14). Although numerous studies have investigated the association between diet and health(Reference Zhang, Wang and Hao11,Reference Chen, Cao and Hou12,Reference Chen, Shen and Xuan14,Reference Wu, Gu and Meng15) , the relationship between PD and mental health outcomes remains inconclusive, with existing evidence yet to reach a definitive conclusion. In addition, the relationship between dietary patterns and life satisfaction also remains inconclusive, warranting further exploration(Reference Govindaraju, Sahle and McCaffrey16), particularly regarding PD and depression in China(Reference Lai, Hiles and Bisquera17). A Global Burden of Disease study showed that China ranks first in the world regarding diet-related diseases and unhealthy effects(Reference Afshin, Sur and Fay18). As China faces an accelerating ageing process, understanding the association between diet and mental health problems will promote healthy ageing. Recently, Wu et al. found that PD was associated with dementia and depression in a UK Biobank cohort(Reference Wu, Gu and Meng15).
Moreover, despite dietary habits being recognised in previous studies as modifiable(Reference Emanuel, McCully and Gallagher6–Reference Shi, Rundle and Genkinger10,Reference Hilger, Loerbroks and Diehl19) , whether these habits change in real situations over time remains unclear, and the trajectory of dietary habits in older adults is underexplored(Reference Chong20). Finally, variables at different times are lagged, and cumulative cross-sectional studies cannot circumvent the problem of phenomenal contingency. Concerning PD, previous studies were mostly cross-sectional and did not adequately consider long-term PD impact on mental health(Reference Zhang, Wang and Hao11,Reference Chen, Cao and Hou12,Reference Chen, Shen and Xuan14,Reference Wu, Gu and Meng15) . Group-based trajectory modelling is widely used to study the trajectories of factors, identifying subgroups of individuals based on their different trajectories, such as dietary behaviours(Reference Charnigo, Kryscio and Bardo21,Reference Nagin and Odgers22) .
This study aimed to explore plant-based dietary pattern trajectories (PDPT) in older adults using group-based trajectory modelling and their associations with depression and life satisfaction. The findings will offer insights for older adults to adjust their dietary habits to prevent mental health problems.
Methods
Study design and data collection
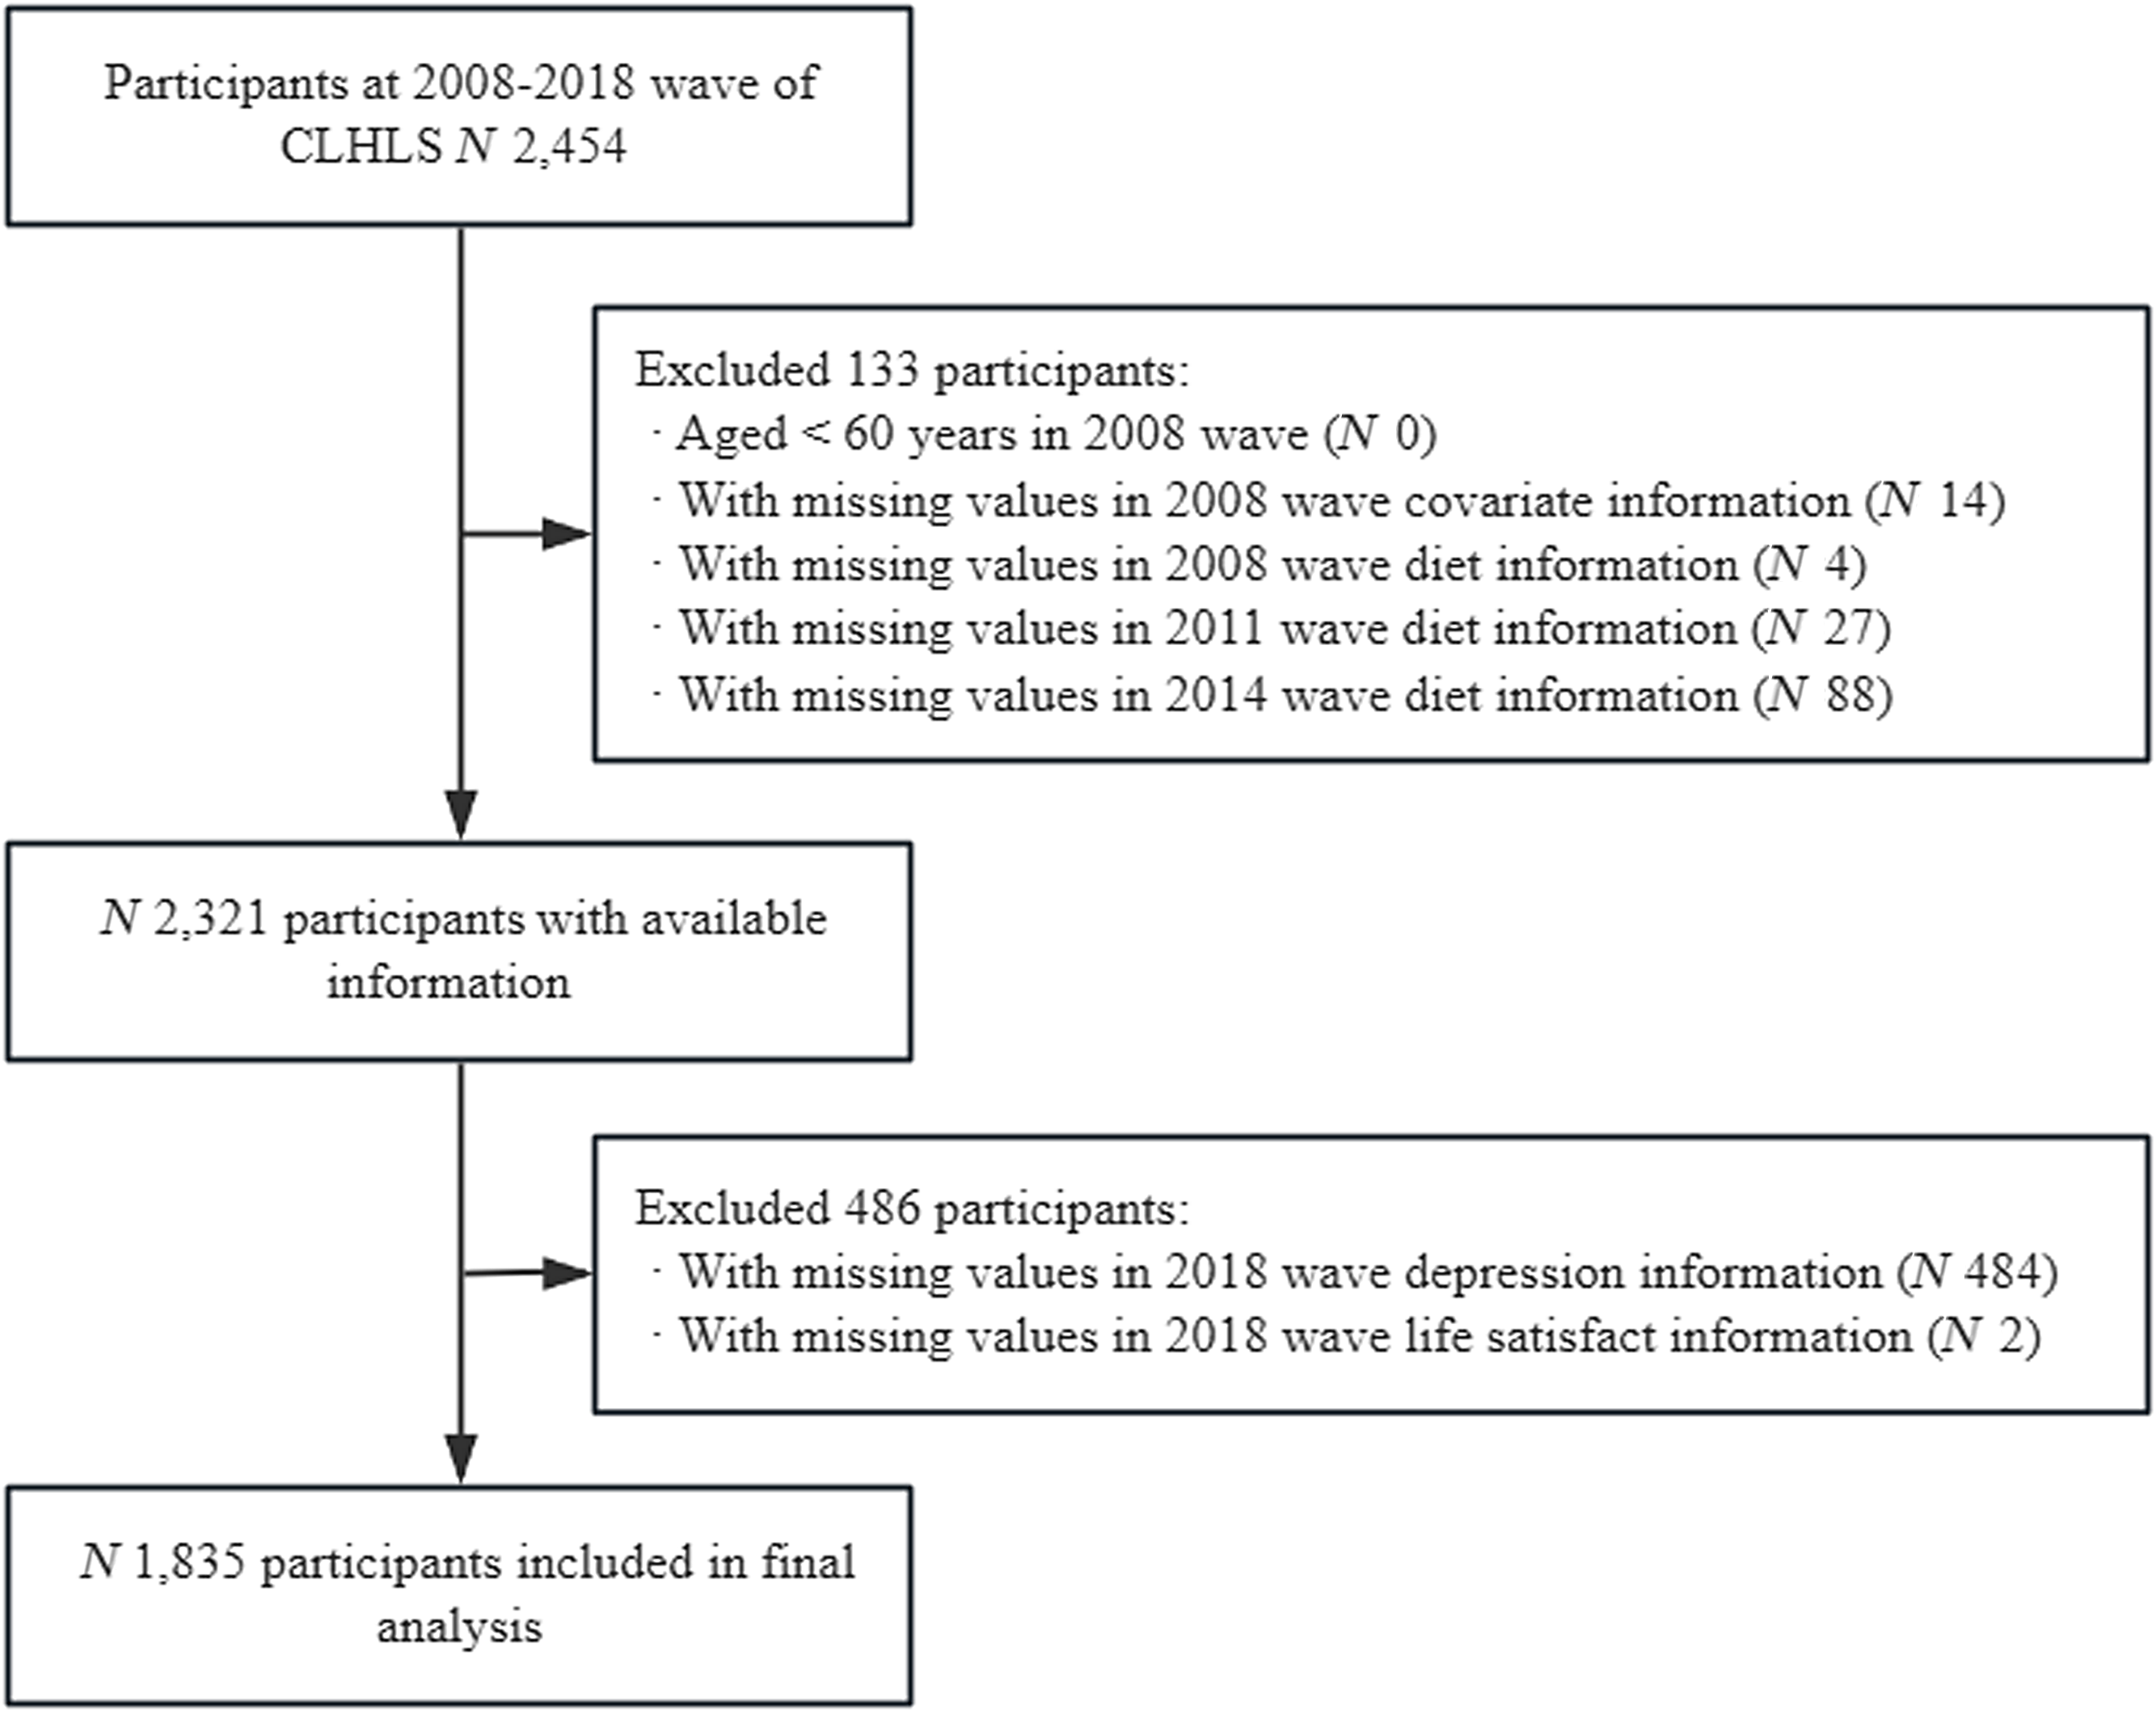
Data were obtained from the Chinese Longitudinal Healthy Longevity Survey (CLHLS)(23), which used a multistage, unequal proportional target random sampling method, covering twenty-three provinces, cities and autonomous regions in China. The data were collected through questionnaire surveys, and the detailed information on CLHLS has been previously reported(Reference Zeng24). The respondents participated in the 2008–2009 (Wave 1), 2011–2012 (Wave 2), 2014 (Wave 3) and 2017–2018 (Wave 4) surveys. Dietary intake measured three times between 2008 and 2014, covering a period of 6 years. Inclusion criteria were (1) aged 60 years or older at the time of Wave 1; (2) valid dietary record assessment in Wave 1, Wave 2 and Wave 3; (3) valid covariate assessment in Wave 1 and (4) valid depression and life satisfaction assessment in Wave 4. A total of 1835 participants were included in the analysis. Additional details on participant inclusion and exclusion are shown in Figure 1. The CLHLS was approved by the Institutional Review Board of Duke University (Pro00062871) and the Biomedical Ethics Committee of Peking University (IRB00001052–13074).
Flowchart of participant screening.

Variables
Calculation of plant-based dietary indices
We evaluated PD patterns by constructing an (1) overall plant-based dietary index (PDI), (2) healthy plant-based dietary index (HPDI) and (3) unhealthy plant-based dietary index (UPDI) based on previous studies(Reference Qi, Yang and Sheng13,Reference Baden, Shan and Wang25–Reference Satija, Bhupathiraju and Spiegelman27) . We included sixteen common food groups in the Chinese diet for assessment using a simplified FFQ. Foods were categorised into three groups based on their intrinsic characteristics and existing knowledge on the association between plant food components with intermediate physiological states and health outcomes(Reference Qi, Yang and Sheng13,Reference Baden, Shan and Wang25–Reference Satija, Bhupathiraju and Spiegelman27) : healthy PD foods (whole grains, vegetable oils, fruits, vegetables, soya products, garlic, nuts and tea), unhealthy PD foods (refined grains, preserved vegetables and sugar) and animal-based foods (animal fats, meat, fish, other aquatic products, eggs and dairy products). The CLHLS recorded the intake frequency as ‘almost everyday’, ‘≥ 1 time/week’, ‘≥ 1 time/month’, ‘occasionally’ or ‘rarely or never’. The intake frequency of fruits and fresh vegetables was recorded as ‘almost everyday’, ‘quite often’, ‘occasionally’ or ‘rarely or never’.
For the PDI, scores were assigned based on the frequency of consumption of healthy and unhealthy plant-based foods (five points for most frequent, one point for least frequent) and animal-based foods (one point for most frequent, five points for least frequent). Theoretically, the PDI scores ranged from 16 to 80 points. Higher PDI scores indicated more frequent consumption of plant-based foods. Regarding HPDI, a higher frequency of healthy plant-based foods consumption garnered a higher score (five points for the most frequent consumption and one point for rarely or never consumption), while unhealthy plant-based foods and animal-based diets were inversely scored (one point for the most frequent consumption and five points for rarely or never consumption). The HPDI highlighted the high consumption of healthy plant-based foods and the low consumption of unhealthy plant-based foods and animal-based foods. The UPDI assigned a higher score to more frequent consumption of an unhealthy plant-based foods (five points for the most frequent consumption and one point for rarely or never consumption), with an inverse score for healthy plant-based foods and animal-based diets (one point for the most frequent consumption and five points for rarely or never consumption). The UPDI focused on the high consumption of unhealthy plant-based foods and the low consumption of healthy plant-based foods and animal-based foods. Detailed information regarding food grouping and assignment is provided in online Supplementary Table S1.
Depression
The 10-item Center for Epidemiologic Studies Depression Scale was used to assess depressive symptoms, as previously reported and validated in older adult respondents in China (online Supplementary Table S2)(Reference Chen and Mui2). The total score ranged from 0 to 30 points, with higher scores indicating a greater severity of depressive symptoms. A score ≥ 10 in the 10-item Center for Epidemiologic Studies Depression Scale indicated depression(Reference Chen and Mui2).
Life satisfaction
Life satisfaction was determined by asking, ‘How do you feel about your life now?’ It was rated as 1 = very bad, 2 = bad, 3 = fair, 4 = good or 5 = very good.
Other covariates
The covariates included age (60–74, 75–89 or 90– years), sex (male or female), resident (country, town or rural), education (without or with formal education), marital status (single or married), smoking status (never, former or current smoking), alcohol consumption (no or yes), BMI (BMI < 18·5 kg/m2 is underweight, 18·5 kg/m² ≤ BMI < 24 kg/m² is normal and 24 kg/m² ≤ BMI < 28 kg/m² is overweight, BMI ≥ 28 kg/m² is obesity) and baseline life satisfaction. Annual household income was categorised into four classes according to quartiles.
Statistical analysis
We used the Group-Based Trajectory Modelling to identify, for each PD score, groups that exhibited different trajectories of change from 2008 to 2014. This statistical approach yields discrete trajectory groups that exhibit statistically unique patterns of change over time(Reference Charnigo, Kryscio and Bardo21,Reference Nagin and Odgers22) . PROC TRAJ(Reference Jones, Nagin and Roeder28) was used in SAS statistical software (Version 9.4; SAS Institute Inc.). Since the appropriate number of trajectory groups was not known a priori, we used the Bayesian information criterion (lower values preferred) and Akaike information criterion (lower values preferred) for selecting best-fitting group numbers, examining one, two and three groups for each symptom (more groups were not expected and could replicate groups given our moderate sample size(Reference Nagin and Odgers22)). Similarly, for each group, we used Bayesian information criterion and Akaike information criterion to select the polynomial orders of mean-level symptom changes across the timeline (examining 0 = flat/absent, 1 = linear, 2 = quadratic and 3 = cubic). Fit indices for the best-fitting models are presented in online Supplementary Table S3–S5.
Baseline characteristics were summarised using descriptive statistics. Continuous variables were expressed as mean (sd) or median (quartiles), and count (proportion, %) was used for categorical variables. Differences in the basic characteristics of participants by dietary habits were analysed using ANOVA, t tests or χ 2 tests. Spearman’s correlation coefficient was used to test variable correlations. Logistic and linear regression models were used to analyse the associations between dietary habits, depression and life satisfaction, with effect estimates presented as OR (95 % CI) and coefficients (β) (95 % CI), respectively. Model 1 is an unadjusted model, whereas model 2 adjusts for covariates, including age, sex, resident, annual household income, education, marital status, smoking status, alcohol consumption, BMI and baseline life satisfaction (only in the life satisfaction analyses). A two-sided P < 0·05 was considered statistically significant. All statistical analyses were performed using SAS version 9.4.
Sensitivity analysis
First, to explore the effect of plant-based foods only on mental health, we excluded animal-based foods when evaluating the PDI, HPDI and UPDI. Second, respondents who reported either depression or life satisfaction data alone were excluded from primary analyses, which may have introduced an unmeasured bias. Therefore, to mitigate potential bias from missing data, we implemented strict exclusion criteria: Specifically, respondents with missing depression assessments in Wave 4 were excluded from depression-related analyses, whereas those lacking life satisfaction data in Wave 4 were omitted from life satisfaction analyses. Both sensitivity analyses involved reconstructing PD scores and trajectories, followed by conducting the primary analyses.
Results
Plant-based dietary pattern trajectories
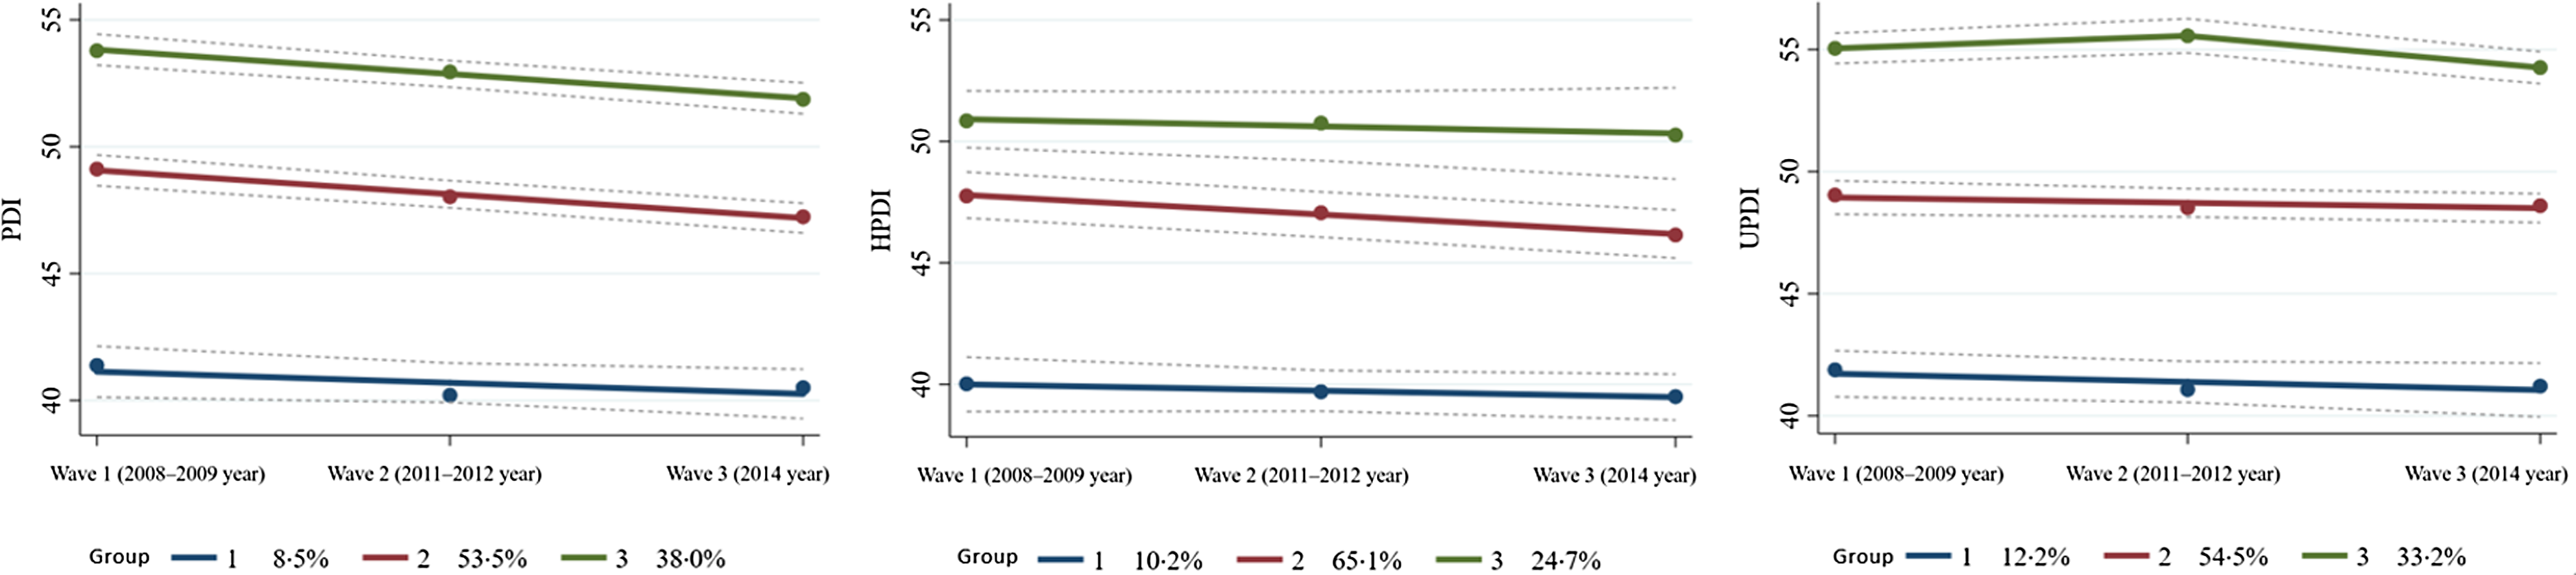
The 1835 participants were divided into three groups based on the trajectory characteristics of the PDI, HPDI and UPDI, as shown in Figure 2. The 2008–2014 PDPT of the participants, whether PDI, HPDI or UPDI trajectories, remained stable at high, medium or low levels. Per trajectory characteristics, these PDPT were labelled as high, medium or low groups. The PDI trajectory groups consisted of 135 (7·36 %), 1, 058 (57·66 %) and 642 (34·99 %) patients in the low, medium and high groups, respectively. The HPDI trajectories were classified as follows: low, 161 (8·77%), medium, 1356 (73·90%) and high, 318 (17·33%). The UPDI trajectories are classified as low 193 (10·52%), medium 1056 (57·55%) and high 586 (31·93%).
Wave 1–3 PDI, HPDI, and UPDI trajectories. Group 1 generation represents low level (blue lines), group 2 represents medium level (red lines) and group 3 represents high level group (green lines). PDI: plant-based dietary index; HPDI: healthy plant-based dietary index; UPDI: Unhealthy plant-based dietary index. Detailed Characterisation: Low PDI (Group 1) have been at a low level, with an overall slow downward trend; Medium PDI (Group 2) have been at a medium level, with an overall slow downward trend; High PDI (Group 3) have been at a high level, with an overall slow downward trend. Low HPDI (Group 1) have been at a low level and the overall trend has remained almost constant; Medium HPDI (Group 2) have been at a medium level, with an overall slow downward trend; High HPDI (Group 3) have been at a high level, with an overall slow downward trend. Low UPDI (Group 1) have been at a low level, with an overall slow downward trend; Medium UPDI (Group 2) have been at a medium level and the overall trend has remained almost constant; High UPDI (Group 3) have been consistently high, with an overall upward and then downward trend.

Baseline characteristics
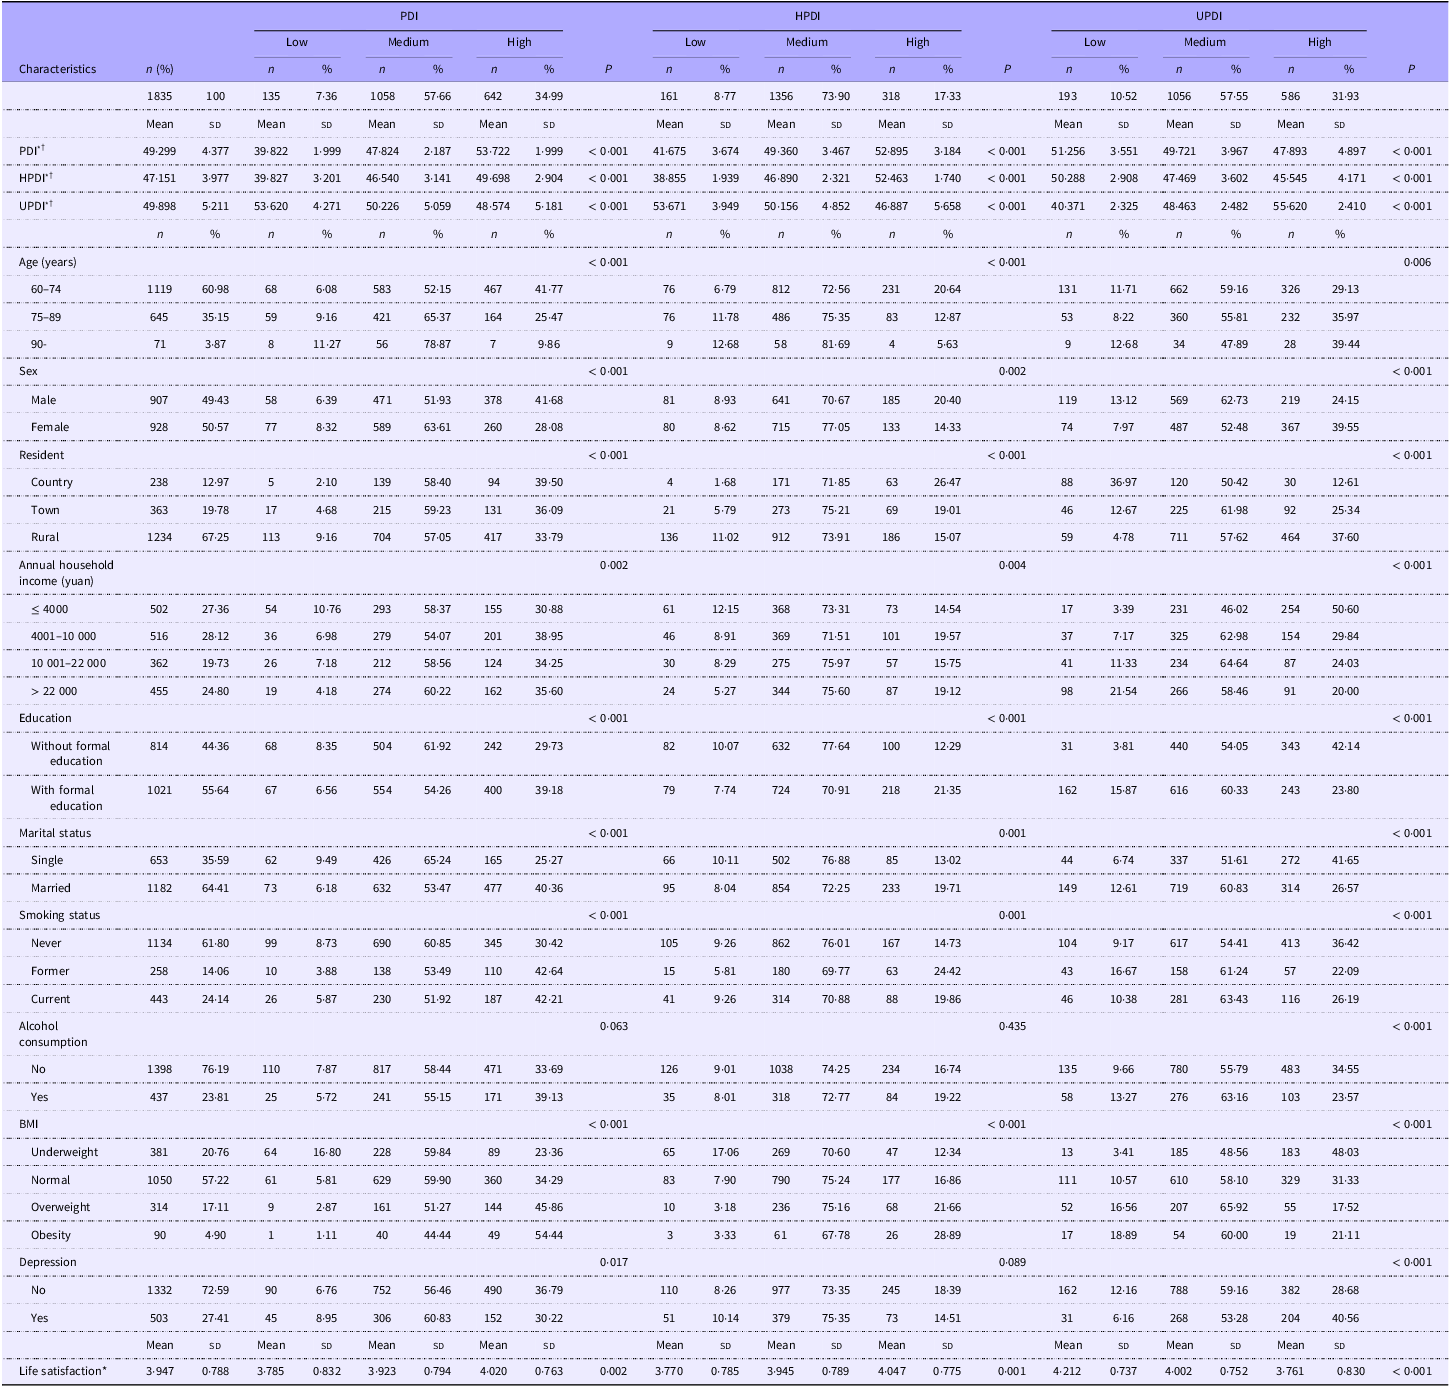
Table 1 shows the baseline characteristics of the participants, with 907 (49·43 %) males and 1119 (60·98 %) aged under 75 years. The average 2008–2014 PDI was 49·299 (sd 4·377), HPDI was 47·151 (sd 3·977) and UPDI was 49·898 (sd 5·211). Males had a higher proportion of high PDI and HPDI and low UPDI trajectory groups than females, whereas older people had lower PDI or HPDI trajectory groups than younger people. The PDI, HPDI and UPDI trajectories differed between people with different residences, income levels, marital status, smoking status and BMI (P < 0·05). Moreover, respondents with alcohol consumption may exhibit lower UPDI trajectories compared with non-consumers. By the end of the follow-up period, 503 (27·41 %) participants were depressed, and the mean life satisfaction was 2·053 (sd 0·788). Correlations between variables are shown in online Supplementary Figure S1–S5.
Baseline characteristics of participants

*Means the variable is continuous and is expressed as the mean (sd).
PDI*†, HPDI*†, UPDI*† are averages of the wave 1, wave 2 and wave 3.
Association between plant-based dietary patterns and depression
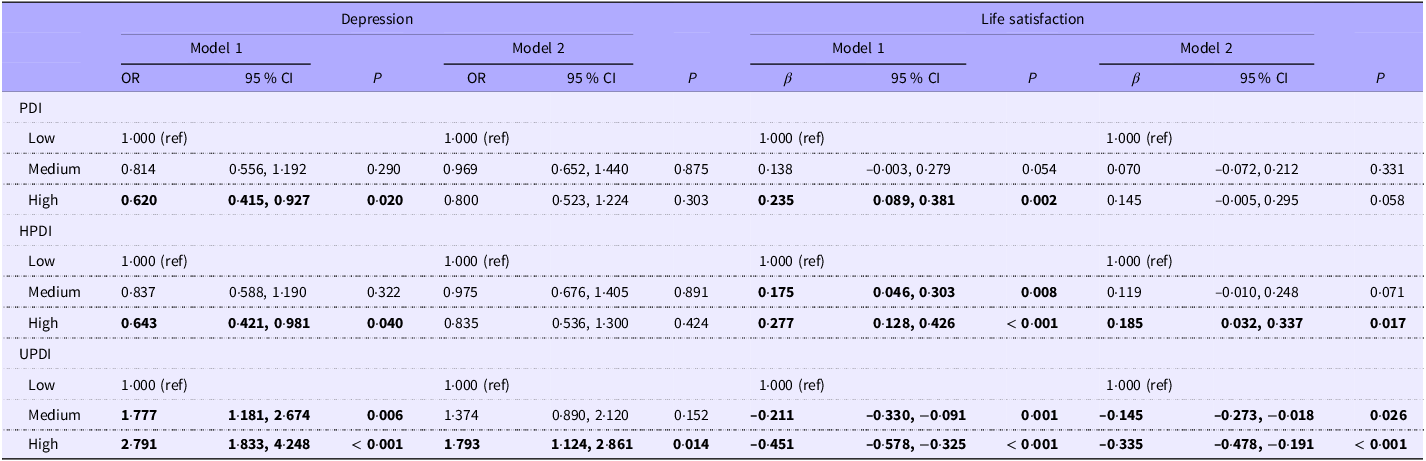
The results of the association between PDPT and depression are shown in Table 2. After adjusting for covariates, compared with the low UPDI trajectory group, the risk of depression was 79 % higher in the high UPDI trajectory group (OR = 1·793, 95 % CI: 1·124, 2·861, P < 0·05).
Associations of plant-based dietary patterns with depression and life satisfaction

Bold indicates statistically significant.
Model 2 adjusts for age, sex, resident, annual household income, education, marital status, smoking status, alcohol consumption, BMI, baseline life satisfaction (only in the life satisfaction).
Association between plant-based dietary patterns and life satisfaction
The results of the association between the PDPT and life satisfaction are shown in Table 2. After adjusting for covariates, including baseline life satisfaction, compared with the low HPDI trajectory, the high HPDI trajectory (β = 0·185, 95 % CI: 0·032, 0·337, P < 0·05) was associated with higher life satisfaction. Additionally, the medium (β = −0·145, 95 % CI: −0·273, −0·018, P < 0·05) and high (β = −0·335, 95 % CI: −0·478, −0·191, P < 0·001) UPDI trajectories were negatively associated with life satisfaction compared with the low UPDI trajectory.
Sensitivity analysis results
When animal-based foods were excluded from the calculations of PDI, HPDI and UPDI, all PDPT were associated with depression and life satisfaction (online Supplementary Table S6 and Figure S6). People with higher PDI or HPDI trajectories were more satisfied with their lives. Individuals with higher UPDI trajectory levels had an increased risk of depression and were more dissatisfied with their lives. The results of the analyses, excluding missing depression or life satisfaction data, are shown in online Supplementary Table S7–S8 and Figure S7–S8. No other notable differences were observed, except that the high PDI trajectory group was more satisfied with life than the low PDI trajectory group. The difference in depression risk was slightly lower, and the difference in life satisfaction was slightly higher for those with medium and high levels of PDPT than for those with low levels.
Discussion
The scarcity of studies on PDPT in assessing mental health among older Chinese adults enhances the relevance of this study. The respondents’ PDPT were categorised as consistently high, medium and low, with high UPDI over time being associated with poor life satisfaction and depression, and long-term high HPDI being associated with high life satisfaction.
In this study, plant-related dietary habits of older Chinese adults remained relatively stable. Although direct comparison with other studies is unavailable, our findings still align with existing research. For example, a study conducted by China Health and Nutrition Survey showed a consistent adherence curve for the Mediterranean diet among adults(Reference Gao, Wang and Shen9). Shi et al. identified distinct dietary trajectories following breast cancer diagnosis and similarly demonstrated that the relative levels of fruit and vegetable intake among patients did not changes over time(Reference Shi, Rundle and Genkinger10). Moreover, a narrative review of seventy-one studies involving 250 715 participants from over thirty countries, identified through EBSCOhost databases and Google Scholar, revealed minimal changes in eating behaviours among most populations during the COVID-19 Pandemic(Reference Johnson, Clockston and Fremling29). Importantly, younger individuals are more likely to change their dietary habits than older adults(Reference Hilger, Loerbroks and Diehl19,Reference Chong20,Reference VanKim, Corliss and Jun30) . This suggests that interventions should target eating habits early in life(Reference de Arriba Muñoz, García Castellanos and Cajal31); however, the dietary habits of older adults should not be neglected. Given the persistence of unhealthy dietary habits among older Chinese adults, policymakers should prioritise dietary interventions.
Regarding the impact of PDPT on depression, our study found that depression was associated with UPDI trajectories, but not with PDI or HPDI trajectories. A prospective study involving individuals aged 37–73 years suggested that vegetables and fruits may reduce depression(Reference Chen, Cao and Hou12), while another study in the UK Biobank indicated that rich, healthier plant foods were associated with a lower risk of depression, whereas less healthy plant foods were associated with a higher risk of depression in middle-aged and older adults(Reference Wu, Gu and Meng15). Furthermore, a systematic review by Dobersek et al. demonstrated that the majority of included studies revealed a significantly elevated risk of depression among individuals avoiding meat consumption(Reference Dobersek, Wy and Adkins32). Notably, the association between PDPT and depression in our study does not contradict these findings.
The mechanisms underlying the relationship between dietary habits and depression are as follows. First, deficiencies in certain vitamins(Reference Bender, Hagan and Kingston33), minerals(Reference Wang, Um and Dickerman34) and essential fatty acids (such as long-chain n-3 polyunsaturated fatty acids derived from fatty fish)(Reference Thesing, Bot and Milaneschi35) obtained from animal or plant foods may affect biological pathways related to depression. Low levels of folic acid, which is abundant in non-refined grains and vegetables, and Zn, a mineral found in non-refined grain products, have been associated with depression(Reference Gilbody, Lightfoot and Sheldon36,Reference Li, Li and Song37) . Vegetables are an important source of minerals, fibres, α-linolenic acid (18:3n-3 PUFA), vitamins and other antioxidants. Antioxidants counteract free radicals and may, therefore, help alleviate oxidative stress, which is increased in patients with depression(Reference Black, Bot and Scheffer38). Second, dietary factors, such as excessive dietary sugar intake, may indirectly influence depression by negatively affecting the gut microbiome and introducing low-grade inflammation, which in turn poses a risk for depression(Reference Chen, Cao and Hou12,Reference Black, Bot and Scheffer38,Reference Ma, Nan and Liang39) . Poor diet, characterised by either micronutrient deficiencies or excessive intake of unhealthy foods, is associated with overall poor health, which directly and indirectly increases the risk of depression(Reference Schneider, Sarkis and Sturm40).
Although direct evidence linking PDPT to life satisfaction is lacking, several studies support a positive association between healthy food habits, particularly vegetable and fruit consumption and happiness/feelings(Reference Conner, Brookie and Carr41,Reference Mujcic and J Oswald42) . Participants with lower UPDI scores exhibited higher consumption of fresh fruits, eggs and meat. Mujcic et al. reported that increased fruit and vegetable consumption leads to immediate improvements in well-being(Reference Mujcic and J Oswald42). A plant-dominant, fibre-rich diet has also been shown to enhance life satisfaction in patients with kidney disease(Reference Joshi, McMacken and Kalantar-Zadeh43). Black et al. suggested that fresh fruits may confer health benefits through their antioxidant and anti-inflammatory effects, potentially reducing the risk of chronic disease and improving overall health status(Reference Black, Bot and Scheffer38); however, further research is warranted to fully elucidate these potential mechanisms. The anti-inflammatory and neuroprotective properties of fish, which is characterised by high n-3 fatty acid content, have been demonstrated to potentially benefit mood regulation and cognitive performance(Reference Thesing, Bot and Milaneschi35). Eggs deliver high-quality protein combined with acetylcholine-synthesising choline and immunomodulatory vitamin D, which contribute to neurological and immunological functions as demonstrated in prior studies(Reference Penckofer, Kouba and Byrn44,Reference Zeisel and da Costa45) . Moreover, essential proteins and nutrients, which contribute to the maintenance of muscle mass and support of immune competence, are derived from both eggs and red meat, potentially leading to enhanced overall health perception(Reference Black, Bot and Scheffer38). While the effects of unhealthy plant-based foods on life satisfaction have not been explored, emerging evidence suggests that reduced intake of such dietary components may confer psychological benefits. This study suggests that older adults may need to attain higher HPDI adherence levels to achieve clinically improvements in meaningful life satisfaction, given the lack of significant associations observed at medium adherence levels. While increased plant food intake alone does not ensure mental health benefits, our findings indicate that the critical determinant is minimising consumption of unhealthy plant-based foods. We also believe that the quality and quantity of plant-based foods should be emphasised in relevant public health recommendations(Reference Chen, Shen and Xuan14), while promoting increased intake of meat-based foods. Further research is required to explore the effects of the various food components.
To the best of our knowledge, this is the first study to adopt the Group-Based Trajectory Modelling to classify PD patterns with common dietary characteristics and to explore long-term dietary habits. Previous studies have often relied on baseline dietary habits, ignoring dynamic changes in dietary habits during follow-up. This may conceal the effects of changing dietary patterns. Additionally, this is the first study to explore PDPT in a Chinese population. It is the results of the sensitivity analyses that increase the robustness of the findings, demonstrating that the mental health effects from plant-exclusive PD calculations supported the main results, with missing data showing no significant influence. Moreover, this study is the first to investigate the effects of PDPT on depression and life satisfaction. However, this study has certain limitations. For example, the sample size of this study may not have been sufficiently large, and future research needs to be explored further with large sample data. Moreover, another limitation is the reliance on self-reported data, which introduces potential recall bias and social desirability bias, limiting the validity and generalisability of the findings. Moreover, as depression was not investigated in the 2008 questionnaire, we could not adjust for depression levels in baseline respondents when estimating the association between PDPT and depression, which may have resulted in estimation bias. Finally, despite employing longitudinal data and adjusting for baseline life satisfaction levels, the potential influence of reverse causality cannot be entirely excluded, leaving residual confounding as a persistent methodological limitation. Despite these limitations, our findings are novel and contribute valuable insights.
Conclusions
This study provides initial evidence of the impact of PDPT on depression and life satisfaction. Long-term high levels of UPDI diets (consumption of low levels of healthy plant-based foods, animal-based foods and high levels of unhealthy plant-based foods) may have negative effects on depression and life satisfaction. Conversely, low HPDI trajectory (consumption of low levels of healthy plant-based foods and high levels of unhealthy plant-based foods and animal-based foods) may also reduce life satisfaction. Public health interventions should consider the role of unhealthy plant foods in dietary recommendations for older adults while promoting the intake of healthy plant-based and animal-based foods. Further investigation into biological mechanisms and the conduct of larger studies remain essential.
Supplementary material
For supplementary material/s referred to in this article, please visit https://doi.org/10.1017/S0007114525105102.
Acknowledgement
We are very grateful to all the participants and the staff from CLHLS. We wish to thank the National Natural Science Foundation of China (project number 81973143).
This study was supported by the National Natural Science Foundation of China (project number 81973143). Application author: Yueping Shen.
The authors declare that they have no known competing financial interests or personal relationships that could have appeared to influence the work reported in this paper.
H. Z., M. S., G. L., Q. H., M. J. and Y. S. carried out the conceptualisation, data curation, formal analysis, investigation, project administration, visualisation and original draft writing. M. J. and Y. S. carried out the funding acquisition and validation. All authors were involved in manuscript preparation, and all authors read and approved the final manuscript. All authors have participated actively in this study and agree to the content of the manuscript.
(1) Data described in the manuscript, and code book will be made publicly and freely available without restriction at Chinese Longitudinal Healthy Longevity Survey (CLHLS) at ·https://doi.org/10.18170/DVN/WBO7LK.
(2) Analytic code in the manuscript will be made available upon request pending application. For additional information please see our website at https://jn.nutrition.org/content/authorinfo/