Introduction
Increased concentrations of greenhouse gases (GHG) in the atmosphere may cause global warming which results in extreme weather changes that could affect crop yield and productivity, food supplies and food prices. The principal GHG involved in this process include carbon dioxide (CO2) from fossil-fuel combustion and deforestation, methane (CH4) from enteric fermentation and manure and nitrous oxide (N2O) from fertilizers application during cultivation and manure management (Shibata and Terada, Reference Shibata and Terada2010).
A further global warming could undoubtedly influence animals metabolism and health (Brown-Brandl et al., Reference Brown-Brandl, Nienaber, Eigenberg, Hahn and Freetly2003), reproduction (Rensis and Scaramuzzi, Reference De Rensis and Scaramuzzi2003), milk yield, composition and quality (Nardone et al., Reference Nardone, Ronchi, Lacetera, Ranieri and Bernabucci2010), particularly of high genetic merit cows and animal production indices like growth rate, feed conversion ratio, etc.
Management decisions at the farm level have traditionally focused on improving efficiency, lowering costs and maximizing profit. However, at present there is also an imperative to consider environment, animal welfare and food safety issues, whereas the future challenge within agriculture is therefore threefold: to adapt to a changing and more variable climate, to increase production, and at the same time to reduce GHG emissions.
Livestock farming systems are highly diverse, which results in large differences in the associated GHG emissions per kg produced in different regions. In order to slow down the environmental impact of livestock production, an assessment is required to quantify the emission of pollutants (NH3, CH4, N2O) and resource use (land, water, soil, fossil fuel, etc.).
Life cycle assessment
Life cycle assessment (LCA) is a generally accepted holistic method to evaluate the environmental impact during the entire life cycle of a product (Guinee et al., Reference Guinée, Gorrée, Heijungs, Huppes, Kleijn, de Koning, van Oers, Wegener Sleeswijk, Suh, Udo de Haes, de Bruijn, van Duin, Huijbregts, Lindeijer, Roorda, van der Ven and Weidema2002). In other words, LCA is a technique to assess environmental impacts associated with all stages of a products life from cradle to grave (e.g. from raw material extraction through materials processing, manufacture, distribution, use, repair and maintenance and disposal or recycling).
LCA is widely used to determine the carbon footprint (CF) of products with the equation CF=CO2+25 CH4+298 N2O expressed in kg of CO2 equivalent. CF is an increasingly important method of communicating the climate change impacts of food production to stakeholders, and is used on products packaging as a so-called carbon label to inform supply chain professionals about the relative impacts of different products and activities. CF is just one environmental indicator to assess sustainability of food products.
Many studies have used LCA to assess the environmental impact of livestock products such as beef, pork, chicken, milk or eggs. The fact that these studies all used LCA as impact assessment tool, offers an opportunity to access which livestock products are more harmful to the environment. Farming systems in LCA studies that assess the same product differ substantially in their characteristics, e.g. animal productivity, feed composition and production period (de Vries and de Boer, Reference de Vries and de Boer2010).
Whole farm modeling is widely employed for farm-level GHG emissions modeling. Despite the increased flexibility and sensitivity of these models to capture farm-level activity, concerns and variation relating to data sources, boundaries (i.e which emission sources are included), emission factors and allocation approaches exist, and they limit direct comparison among studies. Thus, it is critical that assumptions made in this regard are clearly outlined. Furthermore, uncertain analysis has a key role to play given the range of GHG emission factors reported and the inherent uncertain involved in agricultural processes. Nevertheless, in terms of developing and assessing mitigation policies to reduce GHG emissions from livestock systems, whole farm approaches provide the most robust and comprehensive approach to developing and implementing effective strategies (Crosson et al., Reference Crosson, Shalloo, O’Brien, Lanigan, Foley, Boland and Kenny2011).
Carbon dioxide
Direct emissions from livestock come from the respiratory process of all animals in the form of CO2. However, as the emitted and absorbed quantities of CO2 are considered to be equivalent, livestock respiration is not considered to be a net source under the Kyoto protocol.
Further to livestock’s respiration, emissions of CO2 from fossil energy use come from farm fuel work (e.g. tillage, seeding, harvesting), haylage by farm-owned trucks, manufacture and supply of farm machinery, heating, electricity consumption and synthetic fertilizers production (Dyer and Desjardins, Reference Dyer and Desjardins2009). All these CO2 estimates have been indexed to the livestock-crop complex by taking into account the contribution of each crop to each animal origin product (Dyer et al., 2011).
Methane
Ruminant’s CH4 production is influenced by many factors, including level of intake, milk yield, type and quality of feeds, digestibility of the ration, forage/concentrate ratio, environmental temperature, BW, age, amount of exercise, feeds CH4 conversion rate, etc. (Shibata and Terada, Reference Shibata and Terada2010). CH4 emission from enteric fermentation will change as production and feeding system change and more toward higher dry matter intake (DMI), milk yield and dietary energy partitioning in lactating ruminant animals (Zervas and Tsiplakou, Reference Zervas and Tsiplakou2012).
Animal manure also emits CH4, N2O, NH3 and CO2 depending on the way it is produced and managed. The livestock production system also plays a significant role in enteric and manure CH4 emission, as the mixed production systems contribution is higher than the grazing, etc.
Nitrous oxide
Livestock production can be considered responsible for N2O emissions and for a global NH3 volatilization from mineral fertilizers used for animal feed production. The retention percentage of dietary N as animal edible products varies among farm animals (34% for poultry, 20% for pigs, 5% for beef cattle), and consequently the average annual amount of N excretion. Further to that, the highest percentage of global N2O emissions from manure management concerns cattle, followed by small ruminants and monogastrics (Zervas and Tsiplakou, Reference Zervas and Tsiplakou2012).
Factors affecting carbon footprint in livestock products at the farm gate
Livestock products carry a large CF compared with other foods, and thus there is a need to focus on how to reduce it. The farming stage is crucial in determining the CF of most foods because as much as 70% to 90% of the emissions in the total chain occur before the products leave the farm gate. On the other hand, as the global population increases, more animal protein needs to be produced using fewer resources (land, water and energy) and with a smaller CF. Improving productivity (i.e. animal protein output per unit of input) allows the livestock industry to reduce resource use and waste output per unit of food. The major contributing factors to CF are emissions related to feed use and manure handling as well as the nature of the land required to produce the feed in question. Thus, the most important mitigation options include the following:
-
a. better feed efficiency at the system level
-
b. use of feeds that increase soil carbon sequestration v. carbon emission
-
c. ensure that the manure produced substitutes for synthetic fertilizer and
-
d. use manure for bio-energy production.
Basically, it is important to make sure that all beneficial interactions in the livestock system are optimized instead of focusing only on animal productivity. However, variation in methodology, boundaries and time-points for each system render direct comparisons unreliable. The need for a coordinated international methodology has been noted by many industry groups and non-governmental organizations (Bertrand and Barnett, Reference Bertrand and Barnett2011), which is still necessary. Many studies have used LCA to assess the environmental impact of livestock products, such as milk, beef, lamb, pork, chicken or eggs. The fact that these studies all used LCA as impact assessment tool, offers an opportunity to assess which livestock products are most harmful to the environment (de Vries and de Boer, Reference de Vries and de Boer2010). LCA results of these studies are expressed in different ways: per kg product, per kg protein and per kg of average daily intake of each product for an Organization for Economic Cooperation and Development (OECD) country. However, these results do not include environmental consequences of competitions for land between humans and animals, and consequences of land-use changes.
LCA relates the environmental impact to a functional unit, which is the main function of a production system expressed in quantitative terms. Functional units in LCA studies of agricultural production, for example, are kg of fat protein corrected milk. Besides this functional unit, a production system might yield another valuable output, such as meat or manure. Thus, the environmental impact of a production system or process should be allocated to its multiple outputs based on their relative economic value. However, LCA results based on different allocation methods cannot be compared directly (Thomassen et al., Reference Thomassen, Dalgaard, Heijungs and de Boer2008).
Milk – dairy
FAO (2010) has reported a global average CF of 2.4 kg of CO2-eq/kg of milk, of which 93% was emission from cradle to farm gate. As intensity of production declines and the average milk yield shifts from ~9000 kg/cow for North America to ~250 kg/cow for Sub-Africa, the CF increases from 1.3 to 7.6 kg of CO2-eq/kg of milk. The main reason for the greater CF at a low yield is due to a general low feed efficiency in these systems and that a larger proportion of feed is used for non-productive purposes such as maintenance requirements, replacement stock and draught power (Dyer et al., 2010).
There is no systematic difference in CF between organic and conventional production systems because the reduced milk yield in organic systems is compensated by a greater overall system efficiency (Thomassen et al., Reference Thomassen, Dalgaard, Heijungs and de Boer2008; Kristensen et al., 2011). Within organic farming, Müller-Lindenlauf et al. (Reference Müller-Lindenlauf, Deittert and Köpke2010) found that grassland-based farms combined with high milk yield per cow resulted in the lowest emission per kg milk, which indicates that intensification of farming, in terms of milk yield per cow, creates the lowest GHG emission per kg product. Kristensen et al. (2011) further identified that the low stocking rate farms obtained a CF of 1.04 compared with 1.14 kg of CO2-eq/kg of milk for the high stocking rate farms, illustrating that with a low stocking rate, it is easier to have a good resource utilization in the system.
A crucial issue of methods assessing the consequences of GHG emissions mitigation in the cattle sector is handling the co-products in emissions allocation. To assess GHG emissions of several co-products at farm level, the inputs and outputs of the system should be partitioned between the different co-products, as it is not easy to attribute emissions directly to each product. In the cattle sector, milk and beef production systems are closely interconnected because of the meat obtained from dairy culled cows and fattened surplus calves. The results confirmed that the interconnection between dairy and beef sectors can modify the benefit of strategies such as dairy intensification (Puillet et al., Reference Puillet, Agabriel, Peyraud and Faverdin2014).
Unfortunately, there is no data on sheep–goats milk CF, at least so far. Sheep and goat milk represents about 4% of the total milk produced worldwide, with great variability among the applied farming systems, most of them being extensive.
Beef
Beef, compared with different livestock products has the highest CF, with a range of 15 to 32 kg of CO2-eq/kg of product, followed by pork (4 to 11 kg) and chicken (4 to 6 kg). The ranking was the case irrespective of whether it was expressed per kg of product, per kg of protein or per typical daily intake in Europe (de Vries and de Boer, Reference de Vries and de Boer2010).
Beef from extensive pasture-based system has a ground water CF with CH4 accounting for 60% to 70% of the total CF (Veysset et al., Reference Veysset, Lherm and Bébin2010), whereas in more-intensive grain-based feeding systems, the CH4 emission is less due to a greater digestibility of the feed and because a smaller portion of the feed is used for maintenance (Peters et al., Reference Peters, Rowley, Wiedemann, Tucker, Short and Schulz2010).
Excluding impacts from estimated soil carbon changes or direct use or impacts related to land use, changes resulted in a CF per kg beef ranging from 12.2 to 26.8 kg of CO2 equivalent. Depending on systems including soil carbon changes from the direct land use narrowed this range (Nguyen et al., Reference Nguyen, Hermansen and Mogensen2010a).
A comparative analysis of the GHG emission intensities for dairy, beef, pork and poultry by Dyer et al. (2010) showed that the protein-based emission intensity for beef was almost four times as high as the GHG emission intensity for milk production. Furthermore, part of the reason for the differences between CF beef and monogastrics is that the number of breeding animals that must be maintained in order to produce one animal for slaughter is much higher for cattle than for swine or poultry. The slow means of reproduction of beef cattle is a better explanation for the observed difference between the GHG emission intensities of ruminants and non-ruminants than is enteric CH4.
Lamb
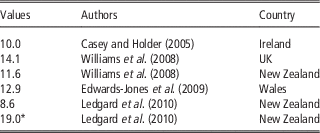
There are much less published studies on the CF of lamb meat than of beef. For the CF from the cradle to farm gate stage, estimates for various studies, in kg of CO2-eq/kg of BW of lamb, are shown in Table 1. However, it should be noted that there were differences in methodology across all those studies, particularly for CH4 estimation method, different Intergovernmental Panel on Climate Change (IPCC) emission factors, different system boundaries and different allocation methods.
Carbon footprint values of lamb from the cradle to farm gate stage in kg CO2-eq/kg of BW

*P<0.05.
The lower CF of lamb meat compared with that of beef, can be attributed to higher prolificacy in sheep (e.g. 125% lambing by ewes compared with 95% calving by breeding cows), greater average growth rates in lambs, and finishing lambs at heavier weights (Morris, Reference Morris2009). This has been estimated to coincide with a reduction in GHG emission from cradle to farm gate by ~22% (Ledgard et al., Reference Ledgard, Lieffering, McDevitt, Boyes and Kemp2010). Furthermore, lamb production from long-term grass lands typically has low fossil-fuel use compared with that from intensive agriculture such as dairy farming. For the CF improvement should be
-
∙ increase the ewes prolificacy
-
∙ increase the dairy growth rate of lambs
-
∙ slaughter the lambs at heavier BW
-
∙ use home grown legumes as forages instead of cereals.
Pork
The CF of pork ranges from 2.8 to 4.5 kg CO2-eq/kg of pork protein with the main contribution for typical pig farming to be N2O, mainly related to feed production, followed by CO2 from energy use, and CH4 from manure handling (de Vries and de Boer, Reference de Vries and de Boer2010; Nguyeh et al., Reference Nguyen, Hermansen and Mogensen2010b). A comparison between organic and conventional pig production showed a greater CF in the organic system by 7% or 22% per kg of pig BW for only sows, or sows plus finishers on grassland, respectively, when ignoring changes in soil carbon, due to larger feed use and greater N2O emissions as a result of an overall greater N turnover in the system (Halberg et al., Reference Halberg, Hermansen, Kristensen, Eriksen, Tvedegaard and Petersen2010). When the carbon sequestration on the farm was included, the net CF was reduced by ~0.4 to 0.6 kg CO2-eq/kg of pig BW in the organic systems, a reduction of ~11% to 18%. Thus, when including soil carbon sequestration, the CF per kg of pig from the organic indoor fattening system was less than from conventional pig systems, where the net carbon changes were close to neutral.
Poultry
The global warming potential of chickens under conventional system at farm gate varies from 1.43 to 2.3 kg CO2-eq/kg of BW, from 3.0 to 4.6 under conventional systems including processing, 5.6 under free range (non-organic) including processing and 6.7 kg CO2-eq/kg of BW under organic system including processing (McCarthy et al., Reference McCarthy, Matopoulos and Davies2015).
Furthermore, the process of producing portions is considerably higher in total environmental impact than that of whole birds (4.83 v. 2.66 kg CO2-eq/kg of BW). Apparently, those values are affected by different manure handling practices, management schemes, housing and facility designs for broilers and laying hens (Broucek and Cermak, Reference Brouček and ČermáK2015).
As eggs production concerns research results revealed that feed efficiency, feed consumption, manure management and farm energy use are the four primary factors that determine the environmental footprint of the egg industry which varies from 1.4 to 3.9 kg CO2-eq/kg of eggs (Leinonen et al., Reference Leinonen, Williams, Wiseman, Guy and Kyriazakis2012; Pelletier et al., Reference Nathan Pelletier, Ibarburu and Xin2014).
Pelletier et al. (Reference Nathan Pelletier, Ibarburu and Xin2014) also reported that the environmental footprint for 2010 was lower by 65% in acidifying emissions, 71% in eutrofying emissions, 71% in GHG emissions and 31% in cumulative energy demand for 1 kg egg production compared with 1960.
Discussion
The impact of production of 1 kg of meat (beef, lamb, pork, chicken) is higher than that of 1 kg of milk and eggs, because of the relatively high water content of milk and eggs. Despite that, the above reported CV values are not necessarily comparable because they are influenced greatly by methodological differences as well as by farm system differences, and do not include environmental consequences of competition for land between humans and animals, and consequences of land-use changes.
LCA results could propagate substitution of red meat by white meat. However, pigs and poultry are generally fed on grains from crops on land that could alternatively well be used for crops for direct consumption by humans. In contrast, ruminants can utilize feed sources that cannot be utilized by non-ruminants, and in the case of small ruminants this is largely grassland with limited other uses or unsuitable for cropping, converting this vegetation to valuable niche products (milk, meat).
For land use, energy use and climate change, the production of 1 kg beef protein has the highest impact, followed by pork, whereas chicken has the lowest impact. Thus, making a comparison on the basis of protein, the GHG intensity, expressed as CO2 equivalent emissions per kg of protein produced, is 19.1 for contemporary (2010) US egg protein (raw from whole eggs), compared with 11.5 for broiler, 17.6 for pig and 78.4 for beef protein (Pelletier et al., Reference Nathan Pelletier, Ibarburu and Xin2014).
This conclusion is based on results of the LCA of meat production until the product left the farm-gate. However, there is an additional environmental impact during the post-farm-gate stages of production of meat, such as processing, packaging, retail and household (Katajajuuri, Reference Katajajuuri2008) which might affect that conclusion.
After all, a number of potentially effective measures should be taken and the appropriate mitigation technologies should be applied in order to reduce effectively and essentially the GHG emissions to the atmosphere, with no adverse effects on intensification and increased productivity of livestock farming systems.
Acknowledgements
The authors would like to thank the EAAP for the above invited paper