1. Introduction
Ever since the historical pipe flow resistance measurements and formula by Weisbach in the 1840s and Darcy in the 1850s (Brown Reference Brown2002), and the explanations of their results provided by the celebrated work of Osborne Reynolds in the early 1880s (Reynolds Reference Reynolds1883), the problem of resistance to turbulent flow past solid surfaces has continued to attract research to date. Internal flows through pipes (and to a lesser extent, channels) have widespread engineering and industrial applications such as carrying steam from boilers to turbines in thermal and nuclear power plants, and transporting oil and natural gas through transcontinental pipe lines etc. External flows such as boundary layers are of great importance as well; the applications include flow over the wings of micro-air vehicles, steam or gas flows over blades of turbines, flow of air over the wings and fuselage of an aircraft, flow of water around submarines etc.
1.1. Skin friction in internal and external flows: scaling laws and structural contributions
While the interest in turbulent drag (or skin friction) of internal flows (pipes and channels) has a long history, the corresponding development on the front of external flows is relatively recent. Subsequent to the breakthrough work of Prandtl (Prandtl Reference Prandtl1904; Tani Reference Tani1977) and his students (see Blasius (Reference Blasius1950) for the English translation of the original 1908 work), the relationship between drag and Reynolds number (Re) in boundary layers found a theoretically sound footing. For zero-pressure-gradient (ZPG) turbulent boundary layers (TBLs), this relationship was established using the universal log law for the mean velocity distribution in viscous (inner) and defect (outer) coordinates (Coles Reference Coles1955, Reference Coles1956; Fernholz & Finley Reference Fernholz and Finley1996); the Clauser chart method (Clauser Reference Clauser1954), which uses only the mean velocity log law in inner coordinates, is an offshoot of this approach (Dixit & Ramesh Reference Dixit and Ramesh2009). Recently, Dixit et al. (Reference Dixit, Gupta, Choudhary, Singh and Prabhakaran2020) proposed a novel scaling of skin friction in ZPG TBLs using the kinematic momentum rate through the boundary layer and kinematic viscosity of the fluid as the scaling variables (see Appendix A for details).
Exclusive facilities have been designed over the past three decades to probe into unprecedented high- $Re$ regimes in pipes (Zagarola & Smits Reference Zagarola and Smits1998) as well as TBLs (Nickels et al. Reference Nickels, Marusic, Hafez and Chong2005; Vallikivi, Hultmark & Smits Reference Vallikivi, Hultmark and Smits2015). Also, the increase in the computational resources has enabled the probing of increasingly high Reynolds numbers in numerical simulations (Lee & Moser Reference Lee and Moser2015; Chan, Schlatter & Chin Reference Chan, Schlatter and Chin2021; Pirozzoli et al. Reference Pirozzoli, Romero, Fatica, Verzicco and Orlandi2021). The main objective of the former is to better understand the asymptotic behaviour of turbulence in these flows while that of the latter is to better understand their structural aspects. These studies have shown that the log-law-based models for the variation of friction factor with Reynolds number in pipe flows require adjustment of coefficient values at higher Reynolds numbers (McKeon, Zagarola & Smits Reference McKeon, Zagarola and Smits2005); the same is true for the power-law-based models (Anbarlooei, Cruz & Ramos Reference Anbarlooei, Cruz and Ramos2020). It is customary to use the friction factor
 $\lambda \propto {U_{\tau }}^{2}/{U_{b}}^{2}$ in pipe flows, where
 ${U_{b}}$ is the bulk velocity,
 ${U_{\tau }:=\sqrt {\tau _{w}/\rho }}$ (
 $:=$ stands for ‘defined as’) is the friction velocity wherein
 $\tau _{w}$ is the wall shear stress and
 $\rho$ is the density of the fluid. Note that the friction factor
 $\lambda$ in pipes is equivalent to the skin friction coefficient
 ${C_{f}}\propto {U_{\tau }}^{2}/{U_{\infty }}^{2}$ in TBLs (
 ${U_{\infty }}$ is the free-stream velocity), both being dimensionless measures of the drag force per unit area of the surface. In the recent times, the focus, however, has gradually shifted from devising drag models to a detailed evaluation of the contributions of various structural components or eddies to the drag. Towards this, Fukagata, Iwamoto & Kasagi (Reference Fukagata, Iwamoto and Kasagi2002) have derived an integral equation (the so-called FIK identity) that could be used to assess the contribution of the distribution of turbulent shear stress across the thickness of the flow towards the mean skin friction in internal as well as external flows. Subsequently, Deck et al. (Reference Deck, Renard, Laraufie and Weiss2014) have assessed the contributions of the large-scale structures to the mean skin friction in TBLs within the framework of FIK identity using data from numerical simulations. They show that the large-scale motions with wavelengths longer than twice the boundary layer thickness (these include ‘superstructures’ in the log region of ZPG TBLs according to Hutchins & Marusic Reference Hutchins and Marusic2007a,Reference Hutchins and Marusicb; Mathis, Hutchins & Marusic Reference Mathis, Hutchins and Marusic2009) contribute more than
 $45\,\%$ of the mean wall shear stress through the footprinting and amplitude modulation effects in the near-wall region. Recently, De Giovanetti, Hwang & Choi (Reference De Giovanetti, Hwang and Choi2016) and Cho, Hwang & Choi (Reference Cho, Hwang and Choi2018) conclude that the contribution to the mean skin friction of the attached coherent motions in the log region of a channel flow continually increases with Reynolds number until eventually most of the skin friction is contributed by such motions. An important connection between the turbulence spectrum and drag in pipe flows has been established by Gioia & Chakraborty (Reference Gioia and Chakraborty2006). They show that the power-law-type
 $\lambda$–
 $Re$ relationship is closely related to the sizes of the eddies that cause substantial momentum transfer between the flow and the wall. Further, it is shown that the Blasius’
 $-1/4$ power-law scaling is a consequence of the dissipative (Kolmogorov-scale) eddies of the cascade effecting most of the momentum transfer between the wall and the fluid layer right next to it. Building upon this approach, recently Anbarlooei et al. (Reference Anbarlooei, Cruz and Ramos2020) have argued that a new power-law scaling regime emerges at high Reynolds numbers in pipe flows where the momentum transfer is affected by eddies having sizes of the order of the height of the mesolayer – region of the flow around the Reynolds shear stress maximum in the near-wall region. The drawbacks of power-law- and log-law-type models for skin friction in pipe flows have been overcome in a recent work by Dixit et al. (Reference Dixit, Gupta, Choudhary, Singh and Prabhakaran2021). A new universal model for the
 $\lambda$–
 $Re$ relationship in smooth pipes has been presented that combines the attached-eddy-type contributions (typical of log-law models) with the high-wavenumber contributions (typical of power-law models) that are missed out in the attached-eddy framework due to its inviscid character. This new universal model is shown to explain the variation of
 $\lambda$ over the complete range of pipe flow Reynolds numbers at once, without any regime-wise adjustment of coefficients as required by the earlier log-law (McKeon et al. Reference McKeon, Zagarola and Smits2005) and power-law (Anbarlooei et al. Reference Anbarlooei, Cruz and Ramos2020) models.
1.2. Scaling of skin friction: the present approach
Two points are to be noted in the context of scaling of mean skin friction in wall turbulence. First, the scaling of mean skin friction is largely considered as the by-product of mean velocity scaling laws. For this reason, skin friction laws in the literature typically have the same functional form as the mean velocity overlap layer (Fernholz & Finley Reference Fernholz and Finley1996; George & Castillo Reference George and Castillo1997; McKeon et al. Reference McKeon, Zagarola and Smits2005; Zanoun, Nagib & Durst Reference Zanoun, Nagib and Durst2009). However, it is important to note that the mean velocity scaling laws are themselves empirical expectations as to what the correct choice of scales in a certain part of the flow could be. For example, defect scaling for the outer layer and viscous scaling for the inner layer are essentially empirical i.e. they do not follow from the governing equations. Therefore, the overlap layer mean velocity scaling and the corresponding skin friction law, both inherit this unavoidable empiricism. There appear to be no studies that investigate the scaling of skin friction, in its own right and in a dynamically consistent manner (i.e. from the governing equations), without subscribing to scaling descriptions for the mean velocity field. Second, the studies from the past have focussed separately on ZPG TBLs (Fernholz & Finley Reference Fernholz and Finley1996; Afzal Reference Afzal2001), pipes and channels (Afzal & Yajnik Reference Afzal and Yajnik1973; McKeon et al. Reference McKeon, Zagarola and Smits2005; Zanoun et al. Reference Zanoun, Durst, Bayoumy and Al-Salaymeh2007, Reference Zanoun, Nagib and Durst2009). There have been no attempts to explore the universality of mean skin friction scaling across different types of wall-bounded turbulent flows. This could perhaps be so because the boundary conditions (BCs) and the outer-layer structural details are very different in internal and external flows. Therefore, a step in this direction would present a significant advance in our understanding of the scaling of drag and behaviour of turbulence in different types of flows.
In this work, we approach this problem of a dynamically consistent, universal scaling of skin friction in the context of three canonical flow types, namely the ZPG TBL (external flow) and fully developed pipe and channel flows (internal flows). Henceforth, we shall omit the qualification ‘fully developed’ for brevity. The outline of the present paper is as follows. Section 2 introduces a set of new theoretical arguments that are more generally applicable to ZPG TBLs as well as pipes and channels. These arguments are based on the transfer of mean-flow kinetic energy to turbulence, and show that the planar kinematic momentum rate  $M$ of the shear flow (henceforth, simply the momentum rate) and the kinematic viscosity
 $\nu$ of the fluid emerge as the dynamically relevant scaling parameters for skin friction. This
 $M$–
 $\nu$ scaling takes the form of an asymptotic, universal (valid for all flows)
 $-1/2$-power scaling law for skin friction in the limit
 ${Re\rightarrow \infty }$. Dixit et al. (Reference Dixit, Gupta, Choudhary, Singh and Prabhakaran2020) have earlier arrived at the same result using the integral momentum equation but those theoretical arguments hold only for ZPG TBLs (see Appendix A for more details). The present approach is more general and covers ZPG TBLs, pipes as well as channels. The finite-
 $Re$ model, based on the asymptotic
 $-1/2$-power law, and proposed earlier by Dixit et al. (Reference Dixit, Gupta, Choudhary, Singh and Prabhakaran2020), is now seen to be valid individually for all three flow types. Section 3 presents preliminary analysis of scaling of skin friction data in the traditional
 $(Re,{C_{f}})$ space. This is followed in § 4 by a detailed scrutiny of the
 $M$–
 $\nu$ scaling (and the finite-
 $Re$ model) for individual flows in the space of dimensionless variables
 $({\widetilde {L}},{\widetilde {U}_{\tau }})$. Here,
 ${\widetilde {L} := LM/\nu ^{2}}$ and
 ${\widetilde {U}_{\tau } := U_{\tau }\nu /M}$, where
 $L$ is the thickness of the shear flow (TBL height or pipe radius or channel half-height) under consideration. The
 $M$–
 $\nu$ scaling (asymptotic scaling law and finite-
 $Re$ model) is seen to hold very well for each individual flow type. However, it is observed to degrade while attempting a universal description of skin friction for all flows. Section 5 gives the rationale and details of the new, universal scaling (and the corresponding finite-
 $Re$ model) for all flows. First, the connection between the BCs and flow geometry, and the large-scale structures in the outer layer of a flow, is discussed. Since the outer-layer structures are known to contribute to mean skin friction, it is proposed that the BCs and flow geometry could possibly have an effect on the scaling of mean skin friction. It is argued that this effect may be accounted for using the shape of the mean velocity profile which is different in each type of flow; note that
 $M$ alone cannot be a complete measure of the shape of the mean velocity profile. An empirical correction to the
 $M$–
 $\nu$ scaling is therefore proposed to account for these differences in the profile shapes. The correction utilises the ratio
 ${G/G_{{{ref}}}}$ –
 $G$ is the Clauser shape factor and
 ${G_{{{ref}}}}=6.8$ is its reference value for ZPG TBLs – and transforms the original
 $({\widetilde {L}},{\widetilde {U}_{\tau }})$ space to a new shape-factor-corrected space
 $({\widetilde {L}}',\widetilde {U}_{\tau }')$;
 ${\widetilde {L}}'$ and
 $\widetilde {U}_{\tau }'$ are defined later in § 5.2. Remarkable universal scaling behaviour is observed across all flows in this new space. We refer to this new universal scaling as the
 $M$–
 $\nu$–
 $G$ scaling. The universal finite-
 $Re$ model in
 $M$–
 $\nu$–
 $G$ scaling is seen to describe the data from all flows to an excellent accuracy. A three-dimensional interpretation of the universal
 $M$–
 $\nu$–
 $G$ scaling in terms of the
 $({\widetilde {L}},{G/G_{{{ref}}}},{\widetilde {U}_{\tau }})$ space is also discussed. Conclusions are presented in § 6.
2. The  $M$–$\nu$ scaling of skin friction in ZPG TBLs, pipes and channels


We seek to derive a scaling for skin friction from the governing equations. As mentioned before, our focus is on ZPG TBLs, pipes and channels, since these three flow types constitute the canonical flow archetypes of wall turbulence and are the most extensively studied in the literature. Before proceeding further, however, two fundamental differences amongst these three flow types merit some discussion.
First, the outer mean velocity BCs (henceforth, simply BCs) are different. ZPG TBLs are external flows and have a (generally non-turbulent) free stream. Pipes and channels being internal flows, do not possess a free stream, but instead have a fully turbulent core around the pipe centreline or channel half-height. Due to this, the thickness (or height) of a ZPG TBL continues to grow with the distance downstream; the mean vertical velocity  $V$ at the TBL height is non-zero and positive. Therefore, the BCs for a ZPG TBL become
 $U(y=L)={U_{\infty }}$ and
 $V(y=L)>0$. For pipes and channels, the flow thickness (equal to pipe radius or channel half-height) does not change in the streamwise (
 $x$) direction and
 $V$ is zero there. Therefore, the BCs for a pipe or channel become
 $U(y=L)={U_{\infty }}$ and
 $V(y=L)=0$;
 ${U_{\infty }}$ here, is the centreline mean velocity. Interestingly, however, the mean flow inside a ZPG TBL asymptotically becomes parallel to the wall as
 ${Re\rightarrow \infty }$ (Dixit & Ramesh Reference Dixit and Ramesh2018). Concomitantly, the rate of growth of boundary layer thickness goes to zero and so does
 $V$ at the TBL edge. Therefore, asymptotically, the BCs for all three types of flows become identical to
 $U(y=L)={U_{\infty }}$ and
 $V(y=L)=0$. This suggests that one may look for an asymptotic scaling of skin friction that could have the same functional form for all of the flows. For finite Reynolds numbers, however, these differences in the BCs could manifest and become important if a universal (across all the flows) scaling of skin friction is desired (see § 5.2).
Second, the flow geometry is different. ZPG TBLs and channel flows naturally conform to the Cartesian coordinates whereas cylindrical coordinates are apt for pipe flows. However, under the assumption of spanwise homogeneity for ZPG TBLs and channels, and azimuthal homogeneity for pipes, the mean-flow governing equations for all of them become identical and effectively two-dimensional in the streamwise–wall-normal (i.e.  $x$–
 $y$) plane (Schlichting Reference Schlichting1968; Kundu & Cohen Reference Kundu and Cohen2008; Davidson Reference Davidson2015). Indeed, these assumptions hold quite well for the archetypical flows under consideration here, and therefore, differences in the flow geometry pose no hurdles for the present asymptotic analysis based on the governing equations. Another aspect of the flow geometry is that the domains of a ZPG TBL and a channel are not constrained in the spanwise direction for nominally two-dimensional mean flow. Pipe flow, on the other hand, is constrained in the azimuthal direction. The implication is that the azimuthal relief between the streamwise–wall-normal planes in a pipe depends on the distance from the wall and decreases towards the centreline. This aspect does not affect the asymptotic analysis, but could become important in the universal scaling skin friction applicable to all the flows over a range of Reynolds numbers (see § 5.2).
To begin our analysis, we first need to identify a signature process or mechanism of shear-flow turbulence that is embodied in the governing equations and common to all the flows. The mechanism of the transfer of kinetic energy from mean flow to turbulence by the large eddies of the flow is a universal feature of turbulent wall-bounded shear flows, and readily fits into this requirement. Therefore, with the streamwise mean-flow kinetic energy (SMFKE) equation as a starting point, we propose a new energy transfer argument predicated on the following three key facts:
(i) The source term in the governing equation for turbulence kinetic energy (TKE) is the sink term in the governing equation for the SMFKE – a well-known mechanism by which shear-flow turbulence extracts energy from the mean flow through the work done by turbulent shear stresses on the mean velocity gradient (Tennekes & Lumley Reference Tennekes and Lumley1972; Davidson Reference Davidson2015).
(ii) For ZPG TBLs, pipes and channels, the average rate of TKE production over the characteristic thickness
$L$ of the shear flow may be shown to asymptote to ${U_{\tau }}^{3}/L$ in the limit ${Re\rightarrow \infty }$.(iii) The eddies that are most efficient in converting the SMFKE to the TKE have their sizes scaling on the thickness
$L$ of the shear flow (Davidson Reference Davidson2015). The velocity scale of these eddies is the characteristic velocity of turbulent fluctuations which in turn scales on ${U_{\tau }}$ (Tennekes & Lumley Reference Tennekes and Lumley1972).


2.1. Integral SMFKE equation and the loss of SMFKE to TKE
Consider a wall-bounded turbulent shear flow with characteristic thickness  $L$ in the wall-normal direction. Due to the presence of the wall, the problem involves two length scales, namely the viscous length scale
 $\nu /{U_{\tau }}$ governing the near-wall (viscous) dynamics of turbulence and the outer length scale
 $L$ dictating the sizes of the largest (inertial) eddies of turbulence. The ratio of these two length scales is the friction Reynolds number
 ${Re_{\tau }} := L{U_{\tau }}/\nu$. The streamwise mean momentum equation for a nominally two-dimensional and statistically stationary flow (under the boundary layer approximation for external flows), reads
 \begin{equation} U\frac{\partial U}{\partial x}+V\frac{\partial U}{\partial y} ={-}\frac{1}{\rho}\frac{\textrm{d}p}{\textrm{d}\kern0.06em x}+\nu \frac{\partial^{2}U}{\partial y^{2}}+ \frac{\partial \langle-u'v'\rangle}{\partial y}.\end{equation}
Here,  $U$ and
 $V$ are the mean velocities in the streamwise (
 $x$) and wall-normal (
 $y$) directions, respectively,
 $\textrm {d}p/\textrm {d}\kern0.06em x$ is the mean streamwise pressure gradient,
 $u'$ is streamwise velocity fluctuation,
 $v'$ is the wall-normal velocity fluctuation and
 $\langle -u'v'\rangle$ is the Reynolds shear stress (pointed brackets denote time average). Note that (2.1) applies to ZPG TBLs and channel flows with the assumption of spanwise homogeneous mean flow. For pipe flows, (2.1) holds under the assumption of azimuthally homogeneous mean flow. For pipes and channels, the left side of (2.1) goes to zero due to the fully developed nature of the flow. For ZPG TBLs, the first term on the right side of (2.1) is zero. However, we shall retain all the terms to preserve generality and discuss the implications of some of them being zero in pipes, channels and ZPG TBLs after the general integral SMFKE has been derived. Multiplying (2.1) throughout by
 $U$ and rearrangement yields the SMFKE
 \begin{align} \left[U\frac{\partial}{\partial x}+V\frac{\partial}{\partial y}\right] \left(\frac{U^{2}}{2}\right)&={-}\frac{1}{\rho}U \frac{\textrm{d}p}{\textrm{d}\kern0.06em x}+\frac{\partial}{\partial y} \left[U\left(\nu\frac{\partial U}{\partial y}+\langle-u'v' \rangle\right)\right]\nonumber\\&\quad -\left(\langle-u'v'\rangle \frac{\partial U}{\partial y}\right)-\nu\left(\frac{\partial U}{\partial y} \right)^{2}.\end{align}
The left side of (2.2) is the advection of SMFKE i.e. the rate of increase of SMFKE due to movement along a mean streamline of the flow. The first term on the right side (denoted henceforth by  ${{PG}}$) is the rate of work done by the pressure-gradient force. The second term (henceforth
 $T$) is the rate of transport of SMFKE by the viscous and turbulent shear stresses. The third term (henceforth
 $P$) is the rate of loss of SMFKE due to the work done by the turbulent shear stress against the mean velocity gradient; this term is the gain for the TKE and is hence called the TKE production rate term (or simply production, Tennekes & Lumley Reference Tennekes and Lumley1972; Davidson Reference Davidson2015). The last term (henceforth
 $D$) is the rate of direct viscous dissipation of the SMFKE; for a turbulent flow, this term is negligibly small compared with all the other terms (Tennekes & Lumley Reference Tennekes and Lumley1972; Davidson Reference Davidson2015) and may therefore be neglected. Noting that,
 $U \partial /\partial x +V \partial /\partial y={\rm D}/{\rm D}t$ i.e. the material derivative operator, we divide (2.2) throughout by
 ${U_{\tau }}^{4}/\nu$ to obtain the SMFKE in viscous scaling
 \begin{equation} \frac{{\rm D}}{{\rm D}{t_{+}}}\left(\frac{U_{+}^{2}}{2}\right) \approx {{PG}}_{+}+T_{+}-P_{+},\end{equation}
where  ${t_{+}=t{U_{\tau }}^{2}/\nu }$ is the dimensionless time coordinate and
 $U_{+}=U/{U_{\tau }}$; subscript
 $+$ denotes viscous or wall scaling using
 ${U_{\tau }}$ and
 $\nu$ for non-dimensionalisation.
Next, we integrate (2.3) in the wall-normal direction over the thickness  $L$ of the shear flow i.e. from
 ${y_{+}}=0$ to
 ${Re_{\tau }}$;
 ${y_{+}}=y{U_{\tau }}/\nu$ is the distance from the wall in viscous units. The term
 $T_{+}$, being a divergence term, integrates to zero i.e.
 $\int _{0}^{{Re_{\tau }}}T_{+}\, \textrm {d}{y_{+}}=0$. Therefore, we have
 \begin{equation} \int_{0}^{{Re_{\tau}}}\frac{{\rm D}}{{\rm D}{t_{+}}} \left(\frac{U_{+}^{2}}{2}\right)\, \textrm{d}{y_{+}} \approx\int_{0}^{{Re_{\tau}}}PG_{+}\, \textrm{d}{y_{+}}- \int_{0}^{{Re_{\tau}}}P_{+}\, \textrm{d}{y_{+}}.\end{equation}
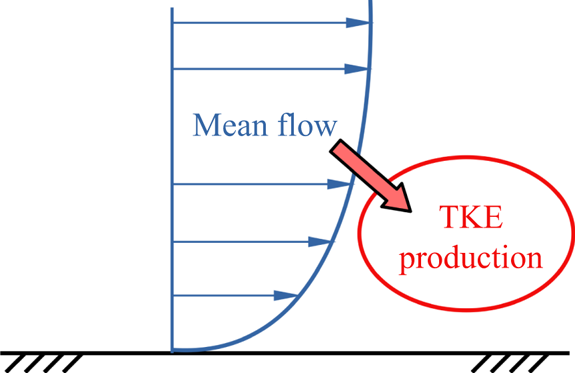
It is well known that turbulence derives its energy from the mean flow through the production term (Tennekes & Lumley Reference Tennekes and Lumley1972; Davidson Reference Davidson2015), as shown schematically in figure 1. Therefore, (2.4) implies that the integral material derivative term (mean-flow term) on the left side must scale as the integral production term on the right side. For ZPG TBLs,  $PG_{+}=0$, so that this scaling is trivial as the first integral on the right side of (2.4) vanishes identically. For pipes and channels, the scaling is more subtle since the fully developed character of these flows makes the left side of (2.4) mathematically zero. That is, the overall rate of pressure-gradient work balances the overall rate of TKE production. However, the TKE production can come only from the mean flow (figure 1). This implies that, in pipes and channels, the pressure-gradient work increases the kinetic energy of mean flow and this increase is immediately lost from mean flow to TKE production, this process being continuous in time. Hence, for ZPG TBLs as well as pipes and channels, one may write
 \begin{equation} \int_{0}^{{Re_{\tau}}}\frac{{\rm D}}{{\rm D}{t_{+}}} \left(\frac{U_{+}^{2}}{2}\right)\, \textrm{d}{y_{+}}\sim \int_{0}^{{Re_{\tau}}}P_{+}\, \textrm{d}{y_{+}},\end{equation}
where  $\sim$ stands for ‘scales as’. In order to proceed further, it is required to determine the asymptotic value of the integral on the right side of (2.5).
Schematic showing turbulence deriving its energy from the mean flow.

2.2. Asymptotic average TKE production rate over the thickness $L$ of the shear flow

The TKE production term  $P := \langle -u'v'\rangle \partial U/\partial y$ in the viscous (wall) scaling is
 $P_{+}=P\nu /{U_{\tau }}^{4}$. The average value of
 $P_{+}$ across the thickness of the shear flow (in the
 $x$–
 $y$ plane) is
 \begin{equation} P_{+{{avg}}}=\frac{1}{L}\int_{0}^{L}P_{+} \, \textrm{d} y=\frac{1}{{Re_{\tau}}}\int_{0}^{{Re_{\tau}}}P_{+} \, \textrm{d}{y_{+}}.\end{equation}
It is a well-known observation that, although  $P_{+}$ reaches peak value in the buffer layer at
 ${y_{+}}\approx 12$, the contribution of the inertial overlap layer (log region) to the overall production (i.e. the integral in (2.6)) increases with Reynolds number and dominates over the contribution of the buffer-layer region at high Reynolds numbers (Smits, McKeon & Marusic Reference Smits, McKeon and Marusic2011). Physically, this happens because, with increasing Reynolds number, the lower end of the log region is seen to move closer to the wall in the outer scaling
 $(\eta := y/L)$. Due to this, the buffer-layer region is sandwiched between an increasingly thinner fraction of the flow thickness located adjacent to the wall; the outer end of the log region is seen to remain located at
 $\eta \approx 0.15$ independent of the flow Reynolds number (Marusic et al. Reference Marusic, Monty, Hultmark and Smits2013). In view of this, one may split the integral in (2.6) into contributions from the buffer-layer, log layer and wake layer regions, and retain only the log and wake contributions in the limit
 ${Re\rightarrow \infty }$
 \begin{equation} P_{+{{avg}}}\rightarrow\frac{1}{{Re_{\tau}}} \left[\int_{3\sqrt{{Re_{\tau}}}}^{0.15{Re_{\tau}}}P_{+{{\log}}}\, \textrm{d}{y_{+}}+\int_{0.15{Re_{\tau}}}^{{Re_{\tau}}}P_{+{{wake}}}\, \textrm{d}{y_{+}}\right].\end{equation}
Here, the log region in ZPG TBLs, pipes and channels is taken to begin at a  $Re$-dependent wall-normal location
 $y_{+}=3\sqrt {{Re_{\tau }}}$ (Wei et al. Reference Wei, Fife, Klewicki and McMurtry2005; Marusic et al. Reference Marusic, Monty, Hultmark and Smits2013) beyond the mesolayer and extend up to the
 $Re$-independent location
 $\eta =0.15$ or
 ${y_{+}}=0.15{Re_{\tau }}$. The wake region occupies the remaining portion of the flow beyond the log region i.e.
 $0.15{Re_{\tau }}\leq {y_{+}}\leq {Re_{\tau }}$. For the wake part, TKE production is governed only by the outer length scale
 $L$ (as in free shear flows, see Tennekes & Lumley Reference Tennekes and Lumley1972; Townsend Reference Townsend1976) so that,
 $P_{{{wake}}}\sim {U_{\tau }}^{3}/L$ or
 $P_{+{{wake}}}=C_{2}/{Re_{\tau }}$, where
 $C_{2}$ is a dimensionless constant. For the log region, the production term depends on the distance from the wall i.e.
 $P_{{{\log }}}\sim {U_{\tau }}^{3}/y$ or
 $P_{+{{\log }}}=C_{1}/{y_{+}}$ (Tennekes & Lumley Reference Tennekes and Lumley1972; Townsend Reference Townsend1976; Davidson Reference Davidson2015),
 $C_{1}$ being a dimensionless constant. Substituting the expressions for
 $P_{+{{wake}}}$ and
 $P_{+{{\log }}}$ into (2.7) and simplifying yields
 \begin{equation} P_{+{{avg}}}\rightarrow\frac{1}{{Re_{\tau}}} \left[C_{3}+C_{1}\ln{\sqrt{{Re_{\tau}}}}\right],\end{equation}
where  $C_{3}=-2.9957C_{1}+0.85C_{2}$. In order to obtain the correct asymptotic limiting form of (2.8), one needs to consider the
 $Re$-dependence of the fractional change
 $\textrm {d}P_{+{{avg}}}/P_{+{{avg}}}$. This may be easily done by differentiating (2.8) with respect to
 ${Re_{\tau }}$ and dividing the result by (2.8). With some simplifications, this exercise yields
 \begin{equation} \frac{\textrm{d}P_{+{{avg}}}}{P_{+{{avg}}}}\rightarrow \left[{-}1+\frac{C_{1}}{2(C_{3}+C_{1}\ln\sqrt{{Re_{\tau}}})}\right] \frac{\textrm{d}{Re_{\tau}}}{{Re_{\tau}}},\end{equation}
where the square bracket tends to  $-1$ in the limit
 ${Re_{\tau }\rightarrow \infty }$ (or
 ${Re\rightarrow \infty }$). Therefore, (2.9) asymptotically becomes
 \begin{equation} \frac{\textrm{d}P_{+{{avg}}}}{P_{+{{avg}}}}\rightarrow- \frac{\textrm{d}{Re_{\tau}}}{{Re_{\tau}}}.\end{equation}
This shows that
 \begin{equation} P_{+{{avg}}}\rightarrow\frac{1}{{Re_{\tau}}}\text{ or } P_{{{avg}}}\rightarrow\frac{{U_{\tau}}^{3}}{L}.\end{equation}
Thus, the rate of TKE production averaged over the thickness of the shear flow asymptotes to  ${U_{\tau }}^{3}/L$ in the limit
 ${Re\rightarrow \infty }$ (or
 ${Re_{\tau }\rightarrow \infty }$). Notice that the asymptotic value of
 $P_{{{avg}}}$ effectively scales as
 $P_{{{wake}}}$, implying that the functional form of the mean velocity profile in the inertial overlap layer (assumed to be logarithmic in this derivation) appears to be irrelevant in the asymptotic sense.
Substituting (2.6) and (2.11) in (2.5) shows that
 \begin{equation} \int_{0}^{{Re_{\tau}}}\frac{{\rm D}U_{+}^{2}}{{\rm D}{t_{+}}} \, \textrm{d}{y_{+}}\rightarrow\text{const}.,\end{equation}
in the limit  ${Re\rightarrow \infty }$ (or
 ${Re_{\tau }\rightarrow \infty }$). Furthermore, we note that the limits of integration on the left side of (2.12) are independent of time (or movement along a streamline) in the limit
 ${Re\rightarrow \infty }$ (or
 ${Re_{\tau }\rightarrow \infty }$). This is so because, for pipes and channels, the mean-flow streamlines are parallel to the wall and coincident with the iso-
 ${y_{+}}$ lines. Therefore, the limits of integration on the left side of (2.5) do not change if one moves along a mean streamline. For ZPG TBLs, this condition is satisfied only at high Reynolds numbers, as shown by Dixit & Ramesh (Reference Dixit and Ramesh2018). Therefore, in the limit
 ${Re\rightarrow \infty }$ (or
 ${Re_{\tau }\rightarrow \infty }$), the operators
 $D/D{t_{+}}$ and
 $\int$ in (2.12) commute for all flows. Note that the use of asymptotic BCs
 $U(y=L)={U_{\infty }}$ and
 $V(y=L)=0$ – common to all flows in the limit
 ${Re\rightarrow \infty }$ – is implicit in the commutation of operators. With this, (2.12) asymptotically becomes
 \begin{equation} \frac{{\rm D}}{{\rm D}{t_{+}}}\int_{0}^{{Re_{\tau}}}U_{+}^{2}\, \textrm{d}{y_{+}}\rightarrow\textrm{const}.\end{equation}
Kinematic momentum rate of the shear flow in the  $x$–
 $y$ plane (per unit width for ZPG TBLs and channels, and per unit circumference for pipes) is given by
 \begin{equation} M := \int_{0}^{L}U^{2}\,\textrm{d} y=\nu{U_{\tau}} \int_{0}^{{Re_{\tau}}}U_{+}^{2}\, \textrm{d}{y_{+}}. \end{equation}
Here,  $U=U(y)$ is the mean velocity profile at the streamwise location
 $x$. Also, the quantities
 ${U_{\tau }}$,
 $M$ and
 $L$ are functions of the streamwise coordinate
 $x$. However, we omit explicit mention of
 $x$ with an understanding that the quantities being considered are localised in the streamwise direction unless specified otherwise. Substituting (2.14) in (2.13) yields
 \begin{equation} \frac{{\rm D}}{{\rm D} {t_{+}}}\left(\frac{M}{\nu{U_{\tau}}}\right) \rightarrow\textrm{const}.\end{equation}
Equation (2.15) now needs to be integrated with respect to time.
2.3. Most efficient energy extracting eddies and the asymptotic universal skin friction scaling law
It is well known that the largest eddies of a wall-bounded turbulent shear flow have sizes of order  $L$ and their velocity scale is
 ${U_{\tau }}$. These eddies are the most efficient towards extracting the SMFKE and transferring it to the low-wavenumber end of the turbulence cascade (Tennekes & Lumley Reference Tennekes and Lumley1972; Davidson Reference Davidson2015). The lifetime of these large eddies – the so-called ‘large-eddy’ turnover time – can be estimated as the ratio of their kinetic energy content (
 $\sim {U_{\tau }}^{2}$) and dissipation rate (
 $\sim {U_{\tau }}^{3}/L$). The lifetime of large eddies is therefore of the order of
 $L/{U_{\tau }}$ (Tennekes & Lumley Reference Tennekes and Lumley1972; Lozano-Durán & Jiménez Reference Lozano-Durán and Jiménez2014; Rouhi, Piomelli & Geurts Reference Rouhi, Piomelli and Geurts2016; Kwon & Jiménez Reference Kwon and Jiménez2021). Note that, the time scale of advection of large eddies past a fixed probe in experiments is
 $L/{U_{\infty }}$ and is commonly referred to as the ‘boundary layer’ turnover time (Hutchins et al. Reference Hutchins, Nickels, Marusic and Chong2009; Mathis et al. Reference Mathis, Hutchins and Marusic2009). This is distinct from the lifetime or turnover time
 $L/{U_{\tau }}$ of the large eddies. In viscous units, the large-eddy turnover time is simply equal to the friction Reynolds number i.e.
 $(L/{U_{\tau }}){U_{\tau }}^{2}/\nu ={Re_{\tau }}$. This is expected because the Reynolds number may be interpreted as the ratio of the largest to smallest (viscous) time scales in the flow (Tennekes & Lumley Reference Tennekes and Lumley1972). We now integrate (2.15) over one large-eddy turnover time (
 ${t_{+}}$ from
 $0$ to
 ${Re_{\tau }}$) to obtain the SMFKE lost by the mean flow (or the TKE input at the largest flow scales of the cascade), over its complete wall-normal extent, during the lifetime of a typical large eddy. This yields
 \begin{equation} \frac{M}{\nu{U_{\tau}}}\sim{Re_{\tau}}.\end{equation}
Writing  ${U_{\tau }}$ and
 $L$ in (2.16) in dimensionless form using
 $M$ and
 $\nu$ leads to the asymptotic, universal skin friction scaling law
 \begin{equation} {\widetilde{U}_{\tau}}\sim{\widetilde{L}}^{{-}1/2},\end{equation}
where  ${\widetilde {L} := LM/\nu ^{2}}$ and
 ${\widetilde {U}_{\tau } := U_{\tau }\nu /M}$. Note that
 ${\widetilde {L}}$ is in fact Reynolds number and
 ${\widetilde {U}_{\tau }}$ is dimensionless skin friction, both based on a new velocity scale
 $M/\nu$ obtained from the governing dynamics. Also note that the present asymptotic, universal
 $-1/2$-power scaling law (2.17) is identical to the asymptotic
 $-1/2$-power scaling law derived earlier by Dixit et al. (Reference Dixit, Gupta, Choudhary, Singh and Prabhakaran2020) only for ZPG TBLs (see (A1) of Appendix A). It is re-emphasised, that the present derivation is more general, covers ZPG TBLs, pipes as well as channels at once and the scaling law (2.17) is therefore deemed universal.
2.4. Dynamically consistent velocity scale $M/\nu$

Conceptual implications of the present derivation of the asymptotic, universal  $-1/2$ power scaling law for skin friction (2.17) are quite revealing. First, the derivation shows that the scaling law is universal and holds for ZPG TBLs, pipes as well as channels. Secondly, for the dimensionless representation of the behaviour of skin friction with Reynolds number,
 $M/\nu$ emerges as a new velocity scale that is consistent with the governing dynamical equations. This is very significant because, traditionally, the skin friction data in ZPG TBLs are ‘scaled’ using the free-stream velocity
 ${U_{\infty }}$ (Fernholz & Finley Reference Fernholz and Finley1996; Dixit et al. Reference Dixit, Gupta, Choudhary, Singh and Prabhakaran2020). For pipes and channels, the bulk or the mass-averaged velocity
 $U_{b}$ is used (McKeon et al. Reference McKeon, Zagarola and Smits2005; Dixit et al. Reference Dixit, Gupta, Choudhary, Singh and Prabhakaran2021). These velocity scales have been in wide use perhaps because of their role either as the outer velocity BC (
 ${U_{\infty }}$ in TBLs) or as a practical convenience (
 $U_{b}$ is proportional to flow rate through the pipe). Given the velocity scale, dimensionless skin friction (
 ${C_{f}}$ in TBLs and channels, or
 $\lambda$ in pipes), and Reynolds number (
 ${Re_{\theta }}$ in ZPG TBLs or
 ${Re_{L}}$ in channels and pipes, both to be defined shortly), in their traditional from, are simply a consequence of the dimensional analysis following Buckingham's Pi theorem. It is important to realise that these traditional velocity scales are not intrinsic to the governing dynamics but more akin to BCs. The preceding sections, for the first time and to the best of our knowledge, provide a single, dynamically consistent velocity scale
 $M/\nu$ for scaling skin friction in ZPG TBLs, pipes as well as channels. This provides a basis for exploring universality of skin friction scaling amongst these flows.
2.5. Finite-$Re$ model for skin friction

Dixit et al. (Reference Dixit, Gupta, Choudhary, Singh and Prabhakaran2020) have derived a finite- $Re$ model (A2) for skin friction in ZPG TBLs from the asymptotic
 $-1/2$ power scaling law (A1) as may be seen in Appendix A. The present asymptotic, universal
 $-1/2$ power scaling law (2.17) is identical to (A1). Therefore, the finite-
 $Re$ model (A2) readily applies individually to all the flows of the present interest. In view of this, the finite-
 $Re$ model for each individual flow type reads
 \begin{equation} {\widetilde{U}_{\tau}}=\frac{A_{1}}{\ln{\widetilde{L}}}{\widetilde{L}}^{\left[-{1}/{2}+{B_{1}}/{\sqrt{\ln{\widetilde{L}}}}\right]}.\end{equation}
Equation (2.18) implies that  ${\widetilde {U}_{\tau }}$ is an explicit function of
 ${\widetilde {L}}$ with the general form
 \begin{equation} {\widetilde{U}_{\tau}}=F_{1}({\widetilde{L}}),\end{equation}
where the functional form of  $F_{1}$ is given by the right side of (2.18). Note that the functional forms of (2.17) and (2.18) remain identical in the case of ZPG TBLs, pipes and channels. However, the values of the finite-
 $Re$ model coefficients in (2.18) may be expected to vary from one flow to the other. This is because, at finite Reynolds numbers, the BCs of different flows are not identical. Also, there are geometry-related differences amongst different flows and these could become important, as noted towards the beginning of this section.
As interim summary, we note that the  $M$–
 $\nu$ scaling of skin friction (i.e. the
 $({\widetilde {L}},{\widetilde {U}_{\tau }})$ space) is a dynamically consistent framework. It contains an asymptotic, universal
 $-1/2$-power scaling law (2.17) that holds for all flows. There is also a finite-
 $Re$ model (2.18) which is expected to hold well for individual flows, but may or may not hold well if one attempts a universal description across all types of flows.
3. Preliminary analysis of the data: the traditional $(Re,{C_{f}})$ space

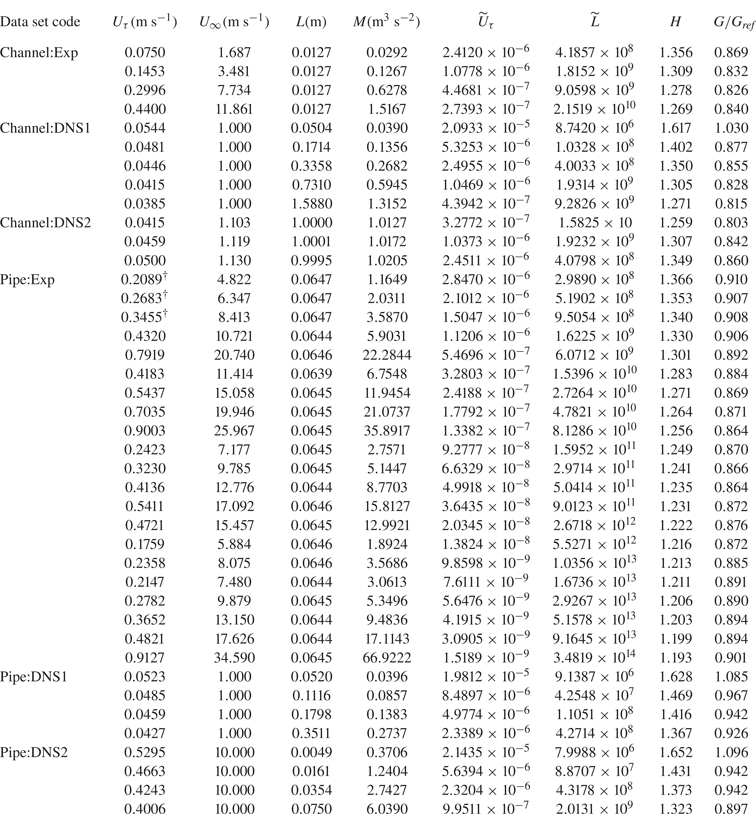
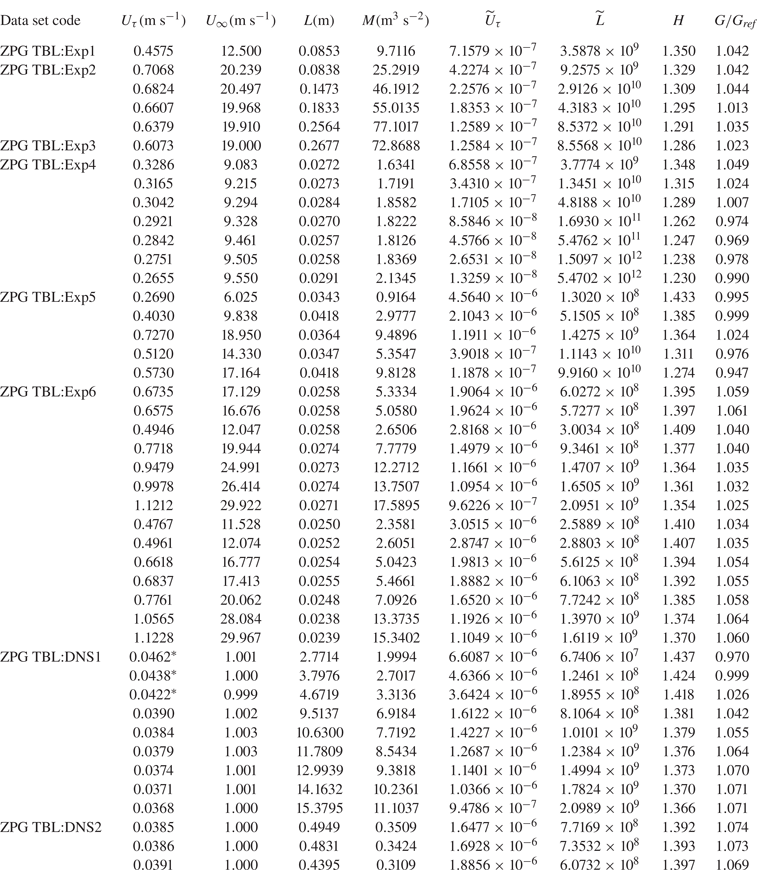
We now assess the skin friction data from experimental and direct numerical simulation (DNS) studies of ZPG TBLs, pipes and channels available in the literature. These data have been chosen to cover the complete range of (finite) Reynolds numbers accessed to date in laboratory and simulation studies, and are listed in tables 1, 2 and 3. First, we examine scaling behaviour in the traditional space of skin friction coefficient ( ${C_{f}}$) and Reynolds number (
 $Re$).
Experimental and DNS data of fully developed channel and pipe flows from the literature. See table 3 for the references and data sources.

Experimental and DNS data of ZPG TBLs from the literature. See table 3 for the references and data sources.


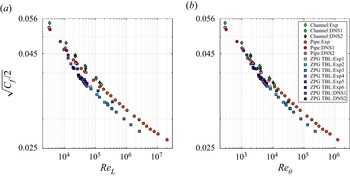
Figure 2 shows the skin friction data of tables 1 and 2 in the traditional space of  $Re$ and
 ${C_{f}}$ variables. Note that
 ${U_{\infty }}$ is the free-stream velocity for ZPG TBLs and centreline velocity for pipes and channels. Two Reynolds numbers
 ${Re_{L}}$ (
 ${Re_{L}} := L{U_{\infty }}/\nu$, figure 2a) and
 ${Re_{\theta }}$ (
 ${Re_{\theta }} := \theta {U_{\infty }}/\nu$ where
 $\theta$ is the momentum thickness, figure 2b) are used. In this space, the data from different types of flows do not scale and collapse to a universal curve. In fact, the data appear to cluster around three distinct curves corresponding to the three types of flows under consideration. A fundamental reason for this lack of scaling appears to be the use of velocity scale
 ${U_{\infty }}$, which is not a dynamically consistent velocity scale (see § 2.4). Another reason could be the difference in the BCs at finite Reynolds numbers and geometry of these flows (see § 2). Data in the
 $({Re_{\theta }},{C_{f}})$ space (figure 2b) show better clustering and reduced differences in the trends compared with the
 $({{Re_{L}}},{C_{f}})$ space (figure 2a). Even so, figure 2(b) shows that the pipe flow data show a consistent shift of approximately
 $+7\,\%$ with respect to the ZPG TBL data at high Reynolds numbers. The typical skin friction measurement uncertainty for ZPG TBLs is
 $\pm 2.5\,\%$ in
 ${U_{\tau}}$ (Dixit et al. Reference Dixit, Gupta, Choudhary, Singh and Prabhakaran2020) and that for pipe flows is
 $\pm 0.5\,\%$ in
 ${U_{\tau}}$ (Dixit et al. Reference Dixit, Gupta, Choudhary, Singh and Prabhakaran2021); significantly lower uncertainty in pipe flows is due to accurate measurements of pressure drop along length of the pipe that are used to infer skin friction (Dixit et al. Reference Dixit, Gupta, Choudhary, Singh and Prabhakaran2021). Thus, the differences in the trends and the lack of scaling seen in figure 2 are well outside the measurement uncertainties and are, therefore, genuine. Although channel flow data are not available at high Reynolds numbers, noticeable differences exist between channel and pipe flow data even at lower Reynolds numbers. These observations underscore the fact that the traditional
 $(Re,{C_{f}})$ space is not very useful towards universal scaling of skin friction in wall turbulence.
Skin friction data of tables 1 and 2 plotted in the traditional  $(Re,{C_{f}})$ space. Note that
 ${\sqrt {C_{f}/2} := {U_{\tau }}/{U_{\infty }}}$ and is plotted against (a)
 ${Re_{L}} := L{U_{\infty }}/\nu$ and (b)
 ${Re_{\theta }} := \theta {U_{\infty }}/\nu$. Symbol sizes are not indicative of the uncertainty in the data.

4. Further analysis of the data: the $({\widetilde {L}},{\widetilde {U}_{\tau }})$ space

We now examine the scaling behaviour of the data in the  $M$–
 $\nu$ scaling, first for individual flows and then for all of them taken together.
4.1. The $M$–$\nu$ scaling for individual flows in the $({\widetilde {L}},{\widetilde {U}_{\tau }})$ space


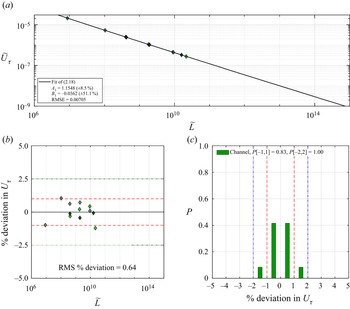
Figure 3(a) shows the channel flow data of table 1 plotted in the space of  ${\widetilde {L}}$ and
 ${\widetilde {U}_{\tau }}$ variables. Clearly, the data appear to line up along a single curve exhibiting scaling in this space as expected from the theory presented in § 2. The equation of this curve is mathematically given by the finite-
 $Re$ model (2.18). A least-squares fit (using MATLAB function nlinfit) of this model to the data is shown in figure 3(a). The values of model constants
 $A_{1}$ and
 $B_{1}$ are also shown along with the respective
 $95\,\%$ confidence intervals given parenthetically. Departure of the data from the fitted model is quantified by the root-mean-squared error (RMSE) and is displayed in figure 3(a). Here, RMSE is the square root of the mean squared error, a measure of the spread of the residuals, returned by the MATLAB nlinfit function. To visualise how well the data ‘scale’ in figure 3(a), we compute the percentage deviation of the actual values of
 ${U_{\tau }}$ with respect to those obtained from the fit of the model. These deviations are shown in figure 3(b). It is clear that almost all the percentage deviations are within
 $\pm 1\,\%$ which is on par with the measurement uncertainty of skin friction in channel flows (Schultz & Flack Reference Schultz and Flack2013). The root-mean-squared (RMS) value of these percentage deviations is
 $0.64\,\%$; percentage deviations are squared, averaged and then the square root is taken. Figure 3(c) shows the probability histogram of percentage deviations of figure 3(b). The histogram is narrow and without any noticeable skew. This confirms that the channel flow data scale quite well in the
 $M$–
 $\nu$ scaling framework, and the finite-
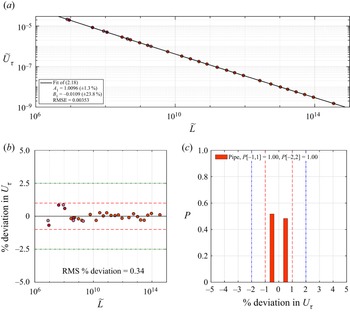
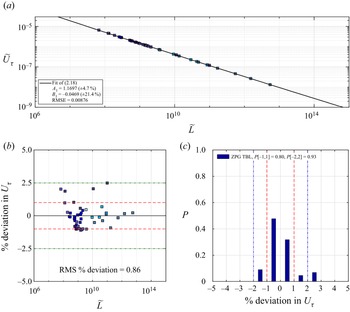
 $Re$ model (2.18) accurately describes the variation in the data. Figures 4 and 5 show results of the same processing carried out on the pipe and ZPG TBL data, respectively. The conclusions are largely the same. Somewhat increased scatter in the percentage
 ${U_{\tau }}$ deviations for ZPG TBLs (figure 5b) and a weak skew in the corresponding probability histogram (figure 5c) are attributed to the inherent larger measurement uncertainty of
 ${U_{\tau }}$ (
 $\pm 2.5\,\%$) in ZPG TBLs. For pipes and channels, this uncertainty is approximately
 $\pm 1\,\%$, since there is privilege to infer
 ${U_{\tau}}$ from accurate pressure drop measurements in fully developed internal flows.
Channel flow skin friction data of table 1. (a) The  $M$–
 $\nu$ scaling framework i.e. the
 $({\widetilde {L}},{\widetilde {U}_{\tau }})$ space. Solid line shows least-squares fit of the finite-
 $Re$ model (2.18) to the data. Fitting constants are also shown along with the RMSE for the fit.(b) Percentage deviations in the actual values of
 ${U_{\tau }}$ with respect to those computed using the finite-
 $Re$ model fitted in (a). Dashed lines indicate the band of
 $[-1,1]$ and dashed-dotted lines indicate the band of
 $[-2.5,2.5]$. RMS value of the percentage deviations is also shown. (c) Probability histogram for the percentage deviations. Probability values for the two bands
 $[-1,1]$ (dashed lines) and
 $[-2,2]$ (dashed-dotted lines) are also shown.


The results of figures 3–5 provide compelling evidence in favour of the theory presented in § 2. Indeed, the  $M$–
 $\nu$ scaling ((2.17) and (2.18)) is seen to scale and describe individual data from ZPG TBLs, pipes as well as channels, to an excellent accuracy. This implies that the functional forms of (2.17) and (2.18) do not depend on the BCs and geometry, as expected from the theory of § 2. It is, however, important to note that the values of model constants
 $A_{1}$ and
 $B_{1}$ in (2.18) do in fact vary from one flow to the other. This variation is clear from the values listed in figures 3(a)–5(a), and is most likely to be due to the effects of BCs at finite Reynolds numbers and geometry as discussed in § 2.
4.2. Does $M$–$\nu$ scaling in $({\widetilde {L}},{\widetilde {U}_{\tau }})$ space hold for different flow types taken together?


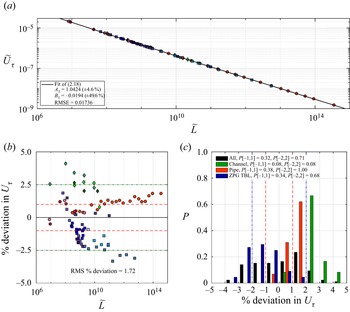
Figure 6 shows the same processing of the data as for figures 3–5, but this time with the data from all different flow types (tables 1 and 2) put together. Figure 6(a) shows the fit of the finite- $Re$ model (2.18) performed for all the data taken together. RMSE value for the fitted curve in figure 6(a) shows a twofold increase compared with the RMSE values seen in figures 3(a)–5(a). Figure 6(b) shows that most of the deviations remain confined to the band of
 $\pm 2.5\,\%$ in
 ${U_{\tau}}$ which is typical of skin friction measurement uncertainties in ZPG TBLs. RMS percentage deviation is
 $1.69$ which is more than twice the values for individual flows. Differences in the percentage deviations for ZPG TBLs and pipe flow data at high Reynolds numbers are now confined to less than
 $5\,\%$. Thus, there is some improvement over the disagreement of
 $7\,\%$ noted earlier for the traditional
 $({{{\rm Re} _{\theta }}},{{C_{f}}})$ space. This suggests that the
 $M$–
 $\nu$ scaling enables somewhat better collapse of all the data from different flows compared with the traditional scaling.

However, it is interesting to note that the ZPG TBL deviations in figure 6(b) systematically drift to negative values with increasing Reynolds number. The opposite is true for the pipe flow data. This can be readily seen in figure 6(c) as well where the probability histograms are biased to the right side for pipes and channels, and to the left side for ZPG TBLs. The probability histogram for all the data is therefore rather flat. Hence, one may conclude that the data from different types of flows do not collapse very well onto each other and hence, onto the curve of the fitted model. Trends in figure 6(b) imply that, with increasing Reynolds number, the ZPG TBL data in figure 6(a) progressively deviate downward with respect to the model curve while the pipe (and channel) data deviate upward. Since the asymptotic dynamical framework is universal (see § 2), the persistent discrepancies in the  $M$–
 $\nu$ scaling trends must come from aspects of different flows that are outside the scope of the theory of § 2. Therefore, these discrepancies could well be related to the differences in the BCs at finite Reynolds numbers and geometry amongst different flow types as discussed before in § 2. If indeed, this were the case, absorbing these differences into the framework of
 $M$–
 $\nu$ scaling appears to be the key to universal scaling of skin friction.
5. Universal $M$–$\nu$–$G$ scaling of skin friction in ZPG TBLs, pipes and channels


With the discussion in the preceding as a plausible premise, we begin by considering why the BCs and flow geometry could become important for scaling of mean skin friction at finite Reynolds numbers. The answer to this question lies in two facts that are now well established in the literature on wall turbulence. First, the large-scale structures are known to contribute significantly (and increasingly with Reynolds number) to the mean skin friction (Hwang Reference Hwang2013; De Giovanetti et al. Reference De Giovanetti, Hwang and Choi2016; Hwang & Sung Reference Hwang and Sung2017; Agostini & Leschziner Reference Agostini and Leschziner2019; Fan, Cheng & Li Reference Fan, Cheng and Li2019). Second, these structures are strongly influenced by the BCs and flow geometry as observed in the matched- ${Re_{\tau }}$ experiments of ZPG TBL, pipe and channel by Monty et al. (Reference Monty, Hutchins, Ng, Marusic and Chong2009). To elaborate somewhat on this point, it is worth quoting the following from Monty et al. ‘
 $\ldots$ it is clear that the conditions in pipes/channels must permit the very large modes to persist further from the wall than in boundary layers (in which they are largely constrained to the log region)
 $\ldots$ Also, far from the wall
 $(z/\delta \geq 0.6)$, the geometrical freedom of the boundary layer is highlighted as energy ultimately decays to zero at the edge of the boundary layer, while the internal flows remain turbulent through the core
 $\ldots$.’ The ‘conditions’ and ‘geometrical freedom’ clearly relate to the effects of the BCs and geometry being discussed here. Moreover, Monty et al. note that the profiles of streamwise TKE (figure 1(b) therein) from these flows collapse and show no signature of these effects; this is attributed to different spectral redistributions of the streamwise TKE. However, the mean velocity profiles clearly show increasing degree of fullness (or decreasing strength of the wake component) in the order ZPG TBL, pipe and channel (figures 1(a) and 2(a) in Monty et al.). Due to the confined nature of internal flows, the wake factors are lesser (profiles are fuller) than those in ZPG TBLs where there is no confinement in the wall-normal direction. Between channels and pipes, the BCs are identical but the geometry is different. Specifically, the
 $x$–
 $y$ planes are parallel to each other in a channel since the flow is not constrained in the spanwise direction. This is not the case in pipes, where, due to azimuthally constrained geometry, the
 $x$–
 $y$ planes come increasingly closer as the centreline is approached. Therefore, due to mass conservation, one may imagine pipe flow to have larger mean velocities (and hence stronger wake component) near the centreline compared with the channel flow at the same
 ${Re_{\tau }}$. Thus, the differences in the BCs at finite Reynolds numbers, flow geometry and the outer-layer structures in these flows are consistent with the differences in the fullness of their mean velocity profiles. In view of this, it seems plausible that the shape of the mean velocity profile may be the missing link towards the universal scaling of skin friction in ZPG TBLs, pipes and channels.
5.1. Clauser shape factor $G$

An objective integral measure of the fullness of the mean velocity profile is its shape factor. As pointed out by Clauser (Reference Clauser1956), mean velocity profiles of ZPG TBLs exhibit self-similarity in defect coordinates. Therefore, it is appropriate to define shape factor based on defect profiles such that it would be constant for a given self-similar (defect scaled) TBL flow. Clauser defines this shape factor as
 \begin{equation} G := \int_{0}^{\infty}\left(\frac{U-{U_{\infty}}}{{U_{\tau}}}\right)^{2}\, \textrm{d}\left(\frac{y}{\varDelta}\right),\end{equation}
where  $\varDelta$ is the integral thickness based on mean velocity profiles in defect scaling
 \begin{equation} \varDelta := \int_{0}^{\infty}\left(\frac{U-{U_{\infty}}}{{U_{\tau}}}\right)\, \textrm{d} y.\end{equation}
Further,  $G$ and
 ${C_{f}}$ are related (Clauser Reference Clauser1956) to the conventional shape factor
 $H$ (ratio of displacement to momentum thickness) by
 \begin{equation} H=\left(1-G\sqrt{{C_{f}}/2}\right)^{{-}1}.\end{equation}
Note that (5.1)–(5.3) can be readily applied to turbulent pipes and channels as well. Since the mean velocity profile fullness increases (defect decreases) in the order ZPG TBL, pipe and channel (see Monty et al. Reference Monty, Hutchins, Ng, Marusic and Chong2009),  $G_{{{ZPG\ TBL}}}>G_{{{pipe}}}>G_{{{channel}}}$ at matched
 ${Re_{\tau }}$.
For ZPG TBLs,  $G\approx 6.8$ at moderate and high Reynolds numbers (Clauser Reference Clauser1956). To compare the fullness of mean velocity profiles from different flows, this asymptotic value of
 $G$ for ZPG TBLs could be taken as an arbitrary, yet useful, reference i.e.
 $G_{{{ref}}}=6.8$. With this, the departure of the fullness of a mean velocity profile (in any flow) from the reference fullness could be quantified by
 $(G-G_{{{ref}}})/G_{{{ref}}}$, or simply by the ratio
 ${G/G_{{{ref}}}}$. Using (5.3),
 ${G/G_{{{ref}}}}$ may be expressed as
 \begin{equation} \frac{G}{G_{{{ref}}}}=\frac{{U_{\infty}}}{G_{{{ref}}}{U_{\tau}}} \left(\frac{H-1}{H}\right)=\frac{{\widetilde{U}_{\infty}}}{G_{{{ref}}}{\widetilde{U}_{\tau}}} \left(\frac{H-1}{H}\right),\end{equation}
where  ${\widetilde {U}_{\infty }}={U_{\infty }\nu /M}$. Note that
 ${\widetilde {U}_{\infty }}$ and
 $H$ are known parameters from a measured or computed mean velocity distribution, and
 $G_{{{ref}}}=6.8$ is a constant. Thus,
 ${G/G_{{{ref}}}}$ itself is a function of
 ${\widetilde {U}_{\tau }}$.
5.2. Universal, semi-empirical $M$–$\nu$–$G$ scaling and finite-$Re$ model: the $({\widetilde {L}}',\widetilde {U}_{\tau }')$ space


Momentum rate  $M$ does, to some extent, capture the fullness of a mean velocity profile. This explains why the
 $M$–
 $\nu$ scaling is able to reduce the disagreement in
 ${U_{\tau }}$ from
 $7\,\%$ in figure 2 to
 $5\,\%$ in figure 6 (see § 4.2). However, a correct measure of the fullness needs to view the mean velocity profile with respect to the free stream (Clauser Reference Clauser1956). Therefore, comparing the definitions (2.14) and (5.1), it is clear that
 $M$ cannot be a complete measure of the fullness of the mean velocity profiles. Therefore, the
 $M$–
 $\nu$ scaling needs a formal correction to account for the differences in the fullness of the mean velocity profiles. In view of the discussion in the previous sections, such a correction should be based on
 $G$ (or
 ${G/G_{{{ref}}}}$) if one wishes to obtain a universal scaling of skin friction for all flows.
We now attempt to introduce this empirical correction. The expectation is that this  $M$–
 $\nu$–
 $G$ scaling would lead to a much better collapse of the data from all the flows than the
 $M$–
 $\nu$ scaling alone. Towards this, we propose an empirical transformation of the variables
 ${\widetilde {L}}$ and
 ${\widetilde {U}_{\tau }}$ using correction factors that are functions of the ratio
 ${G/G_{{{ref}}}}$. Specifically, we assume the correction factors to have a power-law functional form and define our new shape-factor-corrected variables as
 \begin{gather} {\widetilde{U}_{\tau}}' := {\widetilde{U}_{\tau}}(G/G_{{{ref}}})^{p}, \end{gather}
 \begin{gather}{\widetilde{L}}' := {\widetilde{L}}(G/G_{{{ref}}})^{q}, \end{gather}
where  $p$ and
 $q$ (
 $p\neq q$, in general) are empirical constants. Note that the original dimensionless variables
 ${\widetilde {L}}$ and
 ${\widetilde {U}_{\tau }}$ (of
 $M$–
 $\nu$ scaling) have been respectively transformed to the new variables
 ${\widetilde {L}}'$ and
 $\widetilde {U}_{\tau }'$ (of
 $M$–
 $\nu$–
 $G$ scaling). We expect data from all flows to scale universally in the new
 $({\widetilde {L}}',\widetilde {U}_{\tau }')$ space.
Two points related to the  $M$–
 $\nu$–
 $G$ scaling need some emphasis. First, since one major purpose of the correction is to account for differences in BCs at finite Reynolds numbers, it makes sense to apply the correction only to the finite-
 $Re$ model (2.18). That is, we only seek to construct a universal finite-
 $Re$ model, and do not attempt to derive an asymptotic scaling law in the
 $M$–
 $\nu$–
 $G$ scaling. This is because, at present, we are not aware of a theoretical approach which would include
 $G$ into the asymptotic analysis of
 $M$–
 $\nu$ scaling (§§ 2.1–2.3) without resorting to empirical scaling descriptions such as the defect scaling. Second, we propose that the functional form of the (supposedly) universal finite-
 $Re$ model should be the same as that of (2.18). That is, the original variables
 ${\widetilde {L}}$ and
 ${\widetilde {U}_{\tau }}$ in (2.18) may simply be replaced by the new variables
 ${\widetilde {L}}'$ and
 $\widetilde {U}_{\tau }'$, respectively. The basis for this proposal is that the universal model should correctly reduce to (2.18) for individual flows.
In view of the above, the (supposedly) universal finite- $Re$ model in
 $M$–
 $\nu$–
 $G$ scaling, reads
 \begin{equation} {\widetilde{U}_{\tau}}'=\frac{A'_{1}}{\ln{\widetilde{L}}'}{\widetilde{L}}'^{\left[B'_{0}+{B'_{1}}/{\sqrt{\ln{\widetilde{L}}'}}\right]},\end{equation}
where  $A'_{1}$,
 $B'_{0}$ and
 $B'_{1}$ are model constants. To check the reduction of (5.7) to (2.18) for only ZPG TBLs, note that
 ${G/G_{{{ref}}}}\approx 1$ already. Therefore, the functional form of (5.7) reduces to that of (2.18), as expected. Also, the fitting constant
 $B'_{0}$ is known to be
 $-1/2$ for ZPG TBLs from the universal asymptotic scaling law (2.17). Therefore, with
 $A'_{1}=A_{1}$,
 $B'_{0}=-1/2$ and
 $B'_{1}=B_{1}$, (5.7) readily reduces to (2.18) for ZPG TBLs. Further, note that
 ${G_{{{ref}}}}=6.8$ is just an arbitrary reference value, chosen to be equal to the value of
 $G$ in ZPG TBLs. If one wishes to consider how (5.7) reduces for only pipes (channels), then the value of
 ${G_{{{ref}}}}$ should be chosen to be equal to the asymptotic value of
 $G$ in pipes (channels), so that
 ${G/G_{{{ref}}}}\approx 1$ for pipes (channels). With this, the fitting constant
 $B'_{0}$ is again known to be
 $-1/2$ from the universal asymptotic scaling law (2.17). Then, with
 $A'_{1}=A_{1}$,
 $B'_{0}=-1/2$ and
 $B'_{1}=B_{1}$, (5.7) readily reduces to (2.18) applicable to pipes (channels).
The aim of (5.7) is to universally describe skin friction data in all the flows taken together. Hence, the correction factor is chosen with a common normalisation using  ${G_{{{ref}}}}=6.8$. As may be seen from tables 1 and 2,
 ${G/G_{{{ref}}}}\neq 1$ for all the data. Hence, the value of the fitting constant
 $B'_{0}$ in (5.7), in this case, cannot be specified to be
 $-1/2$; in fact, it is expected to be different from it. This is because the asymptotic, universal
 $-1/2$ power scaling law (2.17) formally holds only in
 $({\widetilde {L}},{\widetilde {U}_{\tau }})$ space (i.e.
 $M$–
 $\nu$ scaling) and not in the new
 $({\widetilde {L}}',\widetilde {U}_{\tau }')$ space (i.e.
 $M$–
 $\nu$–
 $G$ scaling). It is re-emphasised that the proposed corrections, although guided by the data and the physical understanding outlined before, are purely empirical in nature. The contention is that the finite-
 $Re$ model in
 $M$–
 $\nu$–
 $G$ scaling (5.7), universally describes all the data from different types of flows to an approximation significantly better than (2.18).
In order to complete the universal finite- $Re$ model (5.7), one needs to determine the values of five constants namely
 $p$,
 $q$,
 $A'_{1}$,
 $B'_{0}$ and
 $B'_{1}$. Towards this, we use the following approach involving simple optimisation and model curve fitting. First, we arbitrarily select the values for
 $p$ and
 $q$, and compute
 ${\widetilde {L}}'$ and
 $\widetilde {U}_{\tau }'$ for the data. Next, we perform a nonlinear least-squares fit (using the MATLAB function nlinfit) of the shape-factor-corrected finite-
 $Re$ model (5.7) to the data, and obtain the RMSE of the data with respect to the fitted curve. Finally, we systematically and independently vary the values of
 $p$ and
 $q$ each over the (arbitrary) range
 $-10$ to
 $10$, and for each pair of values
 $(p,q)$, we repeat the above procedure and monitor the RMSE value. The pair
 $(p,q)$ exhibiting the minimum RMSE for the fitted model is considered as the optimised pair
 $(p_{{{opt}}},q_{{{opt}}})$, and the values of
 $A'_{1}$,
 $B'_{0}$ and
 $B'_{1}$ corresponding to this fit of the model are finalised for further analysis.
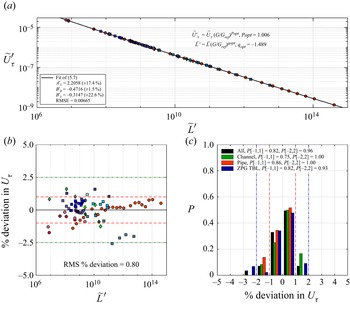
Figure 7(a) shows all the data plotted in the space  $({\widetilde {L}}',\widetilde {U}_{\tau }')$ of
 $M$–
 $\nu$–
 $G$ scaling. The least-squares fit of (5.7) to all the data is shown by the solid line. Note that the optimisation and curve-fitting process mentioned in the preceding paragraph goes back and forth between the data and curve fit in figure 7(a). The optimum values of
 $p$ and
 $q$ in (5.5) and (5.6) turn out to be
 $p_{{{opt}}}=1.006$ and
 $q_{{{opt}}}=-1.489$, as shown in figure 7(a). Also, the values of the constants in (5.7) turn out to be
 $A_{1}'=2.2058$,
 $B_{0}'=-0.4716$ and
 $B_{1}'=-0.3147$. A careful look at figures 6(a) and 7(a) indicates discernible improvement in data collapse when the shape factor correction is included i.e. switching over from
 $M$–
 $\nu$ scaling to
 $M$–
 $\nu$–
 $G$ scaling. Figures 6(b) and 7(b) quantify this improvement. The RMSE with reference to the corresponding finite-
 $Re$ model improves significantly by almost an order of magnitude from
 $0.01736$ (figure 6b) to
 $0.00665$ (figure 7b). It is interesting to note that
 $B_{0}'=-0.4716$ with the inclusion of the shape factor effect (see figure 7b). As discussed before, this value is indeed different from the asymptotic universal scaling-law exponent of
 $-1/2$. Figure 7(b) demonstrates that the shape factor correction dramatically reduces the differences in the trends noted earlier in figure 6(b). This is clear from the reduction in the RMS percentage deviation in
 ${U_{\tau }}$ by more than a factor of two from
 $1.72$ (figure 6b) to
 $0.80$ (figure 7b). Figure 7(c) reflects this dramatic improvement in the data collapse in terms of clustering of the probability histograms for all types of flows around the percentage
 ${U_{\tau }}$ deviation value of zero. Figure 7(c) is to be contrasted with figure 6(c).
Skin friction data of all the flows listed in tables 1 and 2. (a) The  $({\widetilde {L}}',\widetilde {U}_{\tau }')$ space. Solid line shows least-squares fit of the universal finite-
 $Re$ model (5.7) to the data. Panel (c) shows probability histograms for the percentage deviations for the individual flow types as well as for the complete data. Remaining details same as the caption of figure 3.

One caveat needs to be noted before closing this discussion. Percentage deviations of the four highest Reynolds number ZPG TBL data (the last four data points of ZPG TBL:Exp4 data set in table 2) are close to  $-2.5\,\%$, as seen in figure 7(b). For the pipe flow data, however, these deviations remain very close to
 $+1\,\%$ even at the highest Reynolds numbers. This discrepancy, although largely acceptable for engineering calculations, presents a hurdle in inferring a true tendency towards asymptotic
 $M$–
 $\nu$–
 $G$ scaling of the skin friction from the experimental data on ZPG TBLs and pipes. The discrepancy is most likely to be related to the method of measuring skin friction in experiments. Unfortunately, most skin friction measurements in high-
 $Re$ ZPG TBLs (including ZPG TBL:Exp4 data set) rely on a Clauser chart or on Fernholz's correlation (Vallikivi et al. Reference Vallikivi, Hultmark and Smits2015). These methods essentially rely on the universal log law for mean velocity variation (Dixit et al. Reference Dixit, Gupta, Choudhary, Singh and Prabhakaran2020). Pipe flows, on the other hand, allow accurate direct measurement of skin friction through pressure drop measurement. It is known that the log-law-based friction factor models in pipe flows need adjustment of constants at extreme Reynolds numbers (McKeon et al. Reference McKeon, Zagarola and Smits2005; Dixit et al. Reference Dixit, Gupta, Choudhary, Singh and Prabhakaran2021). Whether such an adjustment is required for Fernholz's correlation in ZPG TBLs is an open question that can only be addressed by direct measurements of skin friction at high Reynolds numbers using techniques such as oil film interferometry. In view of this, there is no way to assess the inherent realistic uncertainty in the measured skin friction for the four highest Reynolds number ZPG TBL data of figure 7(b). Future experiments with direct measurement of skin friction in high-
 $Re$ ZPG TBLs should be able to settle this issue and assess the true asymptotic applicability of
 $M$–
 $\nu$–
 $G$ scaling in the limit
 ${Re\rightarrow \infty }$.
Notwithstanding this, and within the uncertainties of the data, the results of figure 7 provide strong support in favour of the universal  $M$–
 $\nu$–
 $G$ scaling and finite-
 $Re$ model (5.7) for skin friction in all flows at finite Reynolds numbers.
5.3. Converting from $({\widetilde {L}}',\widetilde {U}_{\tau }')$ space to three-dimensional $({\widetilde {L}},{G/G_{{{ref}}}},{\widetilde {U}_{\tau }})$ space


Equation (5.7) universally (for all flows) relates the variables  ${\widetilde {L}}'$ and
 $\widetilde {U}_{\tau }'$ in the
 $M$–
 $\nu$–
 $G$ scaling according to the general functional form
 \begin{equation} {\widetilde{U}_{\tau}}'=F_{2}({\widetilde{L}}'),\end{equation}
so that  $\widetilde {U}_{\tau }'$ is a function of a single variable
 ${\widetilde {L}}'$. Equation (5.8) may be converted back to the original variables
 ${\widetilde {L}}$ and
 ${\widetilde {U}_{\tau }}$ along with the third variable
 ${G/G_{{{ref}}}}$ that amounts to the shape factor correction. Expanding (5.7) using the definitions (5.5) and (5.6), and rearranging yields
 \begin{equation} {\widetilde{U}_{\tau}}=\frac{A'_{1}}{\ln[{\widetilde{L}}({G/G_{{{ref}}}})^{q}]} [{\widetilde{L}}({G/G_{{{ref}}}})^{q}]^{\left[B'_{0}+\frac{B'_{1}}{\sqrt{\ln [{\widetilde{L}}({G/G_{{{ref}}}})^{q}]}}\right]}({G/G_{{{ref}}}})^{{-}p}.\end{equation}
Equation (5.9) shows that  ${\widetilde {U}_{\tau }}$ is a function of two variables, namely
 ${\widetilde {L}}$ and
 ${G/G_{{{ref}}}}$, wherein
 ${G/G_{{{ref}}}}$ in turn depends on
 ${\widetilde {U}_{\tau }}$ according to (5.4). Therefore, the universal finite-
 $Re$ model (5.7) translates to an implicit (in
 ${\widetilde {U}_{\tau }}$) expression of the general form
 \begin{equation} {\widetilde{U}_{\tau}}=F_{3}({\widetilde{L}},{G/G_{{{ref}}}}),\end{equation}
where the functional form of  $F_{3}$ is given by the right side of (5.9).
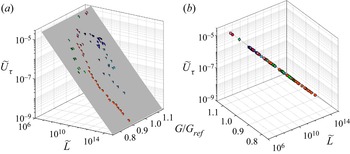
Figure 8 shows all the data plotted in the three-dimensional space  $({\widetilde {L}},{G/G_{{{ref}}}},{\widetilde {U}_{\tau }})$. Also plotted is the surface given by (5.9) with values of all the empirical constants the same as those obtained in the previous section. It is clear that the data points conform very well to the surface, implying universal scaling according to (5.7) or (5.9).
Skin friction data in the three-dimensional space of  ${\widetilde {L}}$,
 ${G/G_{{{ref}}}}$ and
 ${\widetilde {U}_{\tau }}$ variables as per (5.9) and (5.8). Shading represents the surface given by (5.9) using
 $p=p_{{{opt}}}=1.006$,
 $q=q_{{{opt}}}=-1.489$,
 $A_{1}'=2.2058$,
 $B_{0}'=-0.4716$ and
 $B_{1}'=-0.3147$ as shown earlier in figure 7(a). Panel (b) shows an almost along-the-surface view of the same data as in (a). This panel confirms tight collapse of the data points onto the surface given by (5.9).

6. Conclusion
Scaling of mean skin friction in different types of turbulent wall-bounded flows has been investigated in this work. Specifically, we explore the possibility of universal scaling of skin friction in ZPG TBLs, pipes and channels. The main points addressed in this work may be summarised as follows:
(i) Based on the process of conversion of the SMFKE into the kinetic energy of turbulence by the largest eddies of the flow, a new derivation (§ 2) of the asymptotic, universal,
$-1/2$ power scaling law for skin friction (2.17) is presented. The scaling framework is based on the shear flow momentum rate $M$ and fluid kinematic viscosity $\nu$ which emerge as new, dynamically relevant scaling parameters for skin friction (the $M$–$\nu$ scaling). The governing equations and asymptotic BCs are identical (universal) for all the three flows under consideration here. Therefore, the asymptotic scaling law (2.17) in the $M$–$\nu$ scaling framework is also universal for all the flows.(ii) The finite-
$Re$ model (2.18) in $M$–$\nu$ scaling is based on the universal asymptotic law (2.17). This model is seen to apply well to individual flow types. However, the values of model constants in (2.18) vary from one flow type to the other. This demonstrates that the functional form of (2.18) remains universal but the model constants do not. The BCs in different flows are distinct at finite Reynolds numbers. Therefore, at finite Reynolds numbers, BCs and flow geometry both influence the outer-layer structures differently in different types of flows. This appears to be the reason for differing (non-universal) values of model constants in different flows. As a result, the finite-$Re$ model in $M$–$\nu$ scaling fails to describe data from all flows in a universal fashion.(iii) It is argued that the shape (fullness) of the mean velocity profile could be a measure of the effects, on the scaling of mean skin friction, of differing BCs at finite Reynolds numbers, flow geometry and outer-layer structural aspects in different flows. Therefore, an empirical correction to the
$M$–$\nu$ scaling is proposed based on Clauser's shape factor $G$. This leads to a new, universal $M$–$\nu$–$G$ scaling wherein data from ZPG TBLs, pipes and channels remarkably collapse onto a single, universal curve. This curve is described by the universal finite-$Re$ model in $M$–$\nu$–$G$ scaling (5.7) to an excellent accuracy. Apparently, it is not possible to derive an asymptotic, universal scaling law within the $M$–$\nu$–$G$ framework purely from the governing equations without appeal to the empirical defect scaling.


Finally, figure 9 presents a bird's-eye view of the complete scaling approach studied in this work. It would be interesting to investigate if the present  $M$–
 $\nu$–
 $G$ scaling approach extends to other non-canonical flows such as TBLs in favourable and adverse pressure gradients, non-equilibrium TBL flows such as over aerofoils etc. However, this extension is out of the scope of the present paper and will be the subject of further study.
A bird's-eye view of the skin friction scaling approach of the present paper. Arrows are indicative of contributions to a box from one or more of the earlier boxes. Solid arrows indicate the steps in the  $M$–
 $\nu$ scaling whereas dashed arrows indicate the steps in the
 $M$–
 $\nu$–
 $G$ scaling. Boxes with thick dark borders show the
 $M$–
 $\nu$ or
 $M$–
 $\nu$–
 $G$ scaling. Shaded boxes at the bottom contain final results of the present paper.

Acknowledgements
We thank Professor I. Marusic for the original ZPG TBL data sets from the Melbourne experiments and Professor M. Schultz for the original channel flow data sets from the Maryland experiments. Thanks are also due to Professor B.J. McKeon, Dr M. Vallikivi and Dr R. Chin for providing links to their pipe flow, ZPG TBL experimental and pipe flow DNS data sets respectively. We thank all other researchers for making their experimental or DNS data (listed in table 3) available for free download. S.A.D. thanks Professor O.N. Ramesh (IISc) for discussions regarding the importance of shape factor in wall-bounded turbulent flows, and Dr R. Venkatesan for discussion and constructive comments. All authors gratefully acknowledge the continued support by the Director, IITM, Pune. S.A.D. dedicates this work to the memory of the late Professors R. Narasimha and A. Prabhu who nurtured generations of experimental fluid dynamicists in India.
Declaration of interests
The authors report no conflict of interest.
Data availability
All the data used in this work are available in the literature and at the links cited in table 3. No new data have been generated.
Appendix A. The $M$–$\nu$ scaling of skin friction in ZPG TBLs


A.1. Asymptotic $-1/2$ power law

Recently, Dixit et al. (Reference Dixit, Gupta, Choudhary, Singh and Prabhakaran2020) have considered the asymptotic form of the integral momentum equation for ZPG TBLs where the flow is two-dimensional in the mean. They show that an asymptotic skin friction law, previously unrecognised, may be derived in a novel  $M$–
 $\nu$ scaling; this scaling is motivated from the work of Gupta et al. (Reference Gupta, Choudhary, Singh, Prabhakaran and Dixit2020) on turbulent wall jets. ZPG TBL data collapse to a universal curve when plotted in the
 $({\widetilde {L}},{\widetilde {U}_{\tau }})$ space of
 $M$–
 $\nu$ scaling (see figure 2(a) of Dixit et al.). In the limit
 ${Re\rightarrow \infty }$, the asymptotic skin friction law for ZPG TBLs in the
 $M$–
 $\nu$ scaling
 \begin{equation} {\widetilde{U}_{\tau}}\sim{\widetilde{L}}^{{-}1/2}.\end{equation}
Note that, in the traditional framework, the dimensionless friction velocity is  ${U_{\tau }}/{U_{\infty }} := {\sqrt {C_{f}/2}}$ and the dimensionless boundary layer thickness is the Reynolds number
 ${Re_{L}} := L{U_{\infty }}/\nu$. Comparing these with the definitions of
 ${\widetilde {U}_{\tau }}={\widetilde {U}_{\tau } := U_{\tau }\nu /M}$ and
 ${\widetilde {L}}={\widetilde {L} := LM/\nu ^{2}}$ indicates that
 ${\widetilde {U}_{\tau }}$ is akin to
 ${\sqrt {C_{f}/2}}$, and
 ${\widetilde {L}}$ is akin to
 ${Re_{L}}$ when
 ${U_{\infty }}$ is replaced by the velocity scale
 $M/\nu$.
A.2. Finite-$Re$ model

The  $-1/2$ power-law (A1) is valid only in the limit
 ${Re\rightarrow \infty }$ and finite-
 $Re$ corrections are required to obtain the correct functional form that describes the data (in the
 $M$–
 $\nu$ scaling) over the complete range of (finite) Reynolds numbers. Towards this, Dixit et al. have proposed writing the skin friction law more generally as
 ${\widetilde {U}_{\tau }}=A{\widetilde {L}}^{B}$. The dimensionless coefficient
 $A$ and exponent
 $B$ have then been expanded in terms of semi-empirical asymptotic series expansions such that
 $A\rightarrow 0$ and
 $B\rightarrow -1/2$ in the limit
 ${Re\rightarrow \infty }$. The asymptotic condition
 $A\rightarrow 0$ deserves some discussion. In the limit
 ${Re\rightarrow \infty }$, the mean velocity profile across the thickness of the shear flow asymptotes to a plug-flow profile so that
 $M\rightarrow L{U_{\infty }}^{2}$. It is also well known that the dimensionless friction velocity vanishes in this limit i.e.
 $\lambda \rightarrow 0$ or
 ${C_{f}}\rightarrow 0$ as
 ${Re\rightarrow \infty }$. To prove that
 $A\rightarrow 0$ asymptotically, one may use the method of proof by negation. For this, it needs to be assumed that in the limit
 ${Re\rightarrow \infty }$,
 $A\rightarrow A_0$ where
 $A_0\neq 0$. Substituting the asymptotic values
 $M\rightarrow L{U_{\infty }}^{2}$,
 $B\rightarrow -1/2$ and
 $A\rightarrow A_0$ in the skin friction law
 ${\widetilde {U}_{\tau }}=A{\widetilde {L}}^{B}$, yields
 ${C_{f}}\rightarrow 2A_0^2$. However, since it is assumed that
 $A_0\neq 0$,
 ${C_{f}}$ does not tend to zero, which contradicts the consensus asymptotic expectation. This proves that the assumption
 $A_0\neq 0$ is not correct and
 $A_0$ must be zero, which further proves that
 $A\rightarrow 0$ as
 ${Re\rightarrow \infty }$. Retaining the terms in the asymptotic expansions for
 $A$ and
 $B$ up to the first order, Dixit et al. obtain a semi-empirical finite-
 $Re$ model for skin friction in ZPG TBLs
 \begin{equation} {\widetilde{U}_{\tau}}=\frac{A_{1}}{\ln{\widetilde{L}}}{\widetilde{L}}^{\left[-{1}/{2}+ {B_{1}}/{\sqrt{\ln{\widetilde{L}}}}\right]},\end{equation}
where  $A_{1}$ and
 $B_{1}$ are empirical constants to be obtained by fitting (A2) to the data. Dixit et al. have shown that (A2) describes the variation of
 ${\widetilde {U}_{\tau }}$ over the complete range of
 ${\widetilde {L}}$ to an excellent accuracy; more details of the derivation of (A2) can be found in their paper.