Implications
Additive associations of allelic variants from 51 single-nucleotide polymorphisms (SNPs) with milk yield, milk composition, urea nitrogen content and somatic cell score were investigated in Brown Swiss cows. Of the 51 polymorphic SNPs tested, 14 were associated with at least one of the tested traits. This information may be useful in marker-assisted selection or a related technique, such as genomic selection placing greater prior emphasis on known quantitative trait loci (QTLs), to increase the accuracy of selection (especially for quality and health traits) and increase genetic gain.
Introduction
Until recently, the majority of international dairy breeding programs were selected mainly for increased milk production (Meredith et al., Reference Meredith, Kearney, Finlay, Bradley, Fahey, Berry and Lynn2012). However, breeding goals must diversify to include milk quality, health and functional traits if we hope to minimize and reverse genetic declines in these traits. Fat, protein and casein content are of great importance for the milk industry. Mastitis, which is commonly measured using the somatic cell score (SCS) as an indicator trait, is one of the most important and costly production diseases in the dairy industry. Finally, milk urea nitrogen (MUN) is an interesting trait with remarkable environmental implications; milk urea is synthesized as consequence of an imbalance between dietary nitrogen and energy in the rumen, and reflects inefficient protein synthesis. As the main non-protein source of nitrogen in milk, MUN reflects the efficiency of nitrogen utilization and the output of nitrogen to the environment.
Several studies have identified genetic variations in milk quality (Ikonen et al., Reference Ikonen, Morri, Tyrisevä, Ruottinen and Ojala2004; Cecchinato et al., Reference Cecchinato, Penasa, De Marchi, Gallo, Bittante and Carnier2011), MUN (Miglior et al., Reference Miglior, Sewalem, Jamrozik, Bohmanova, Lefebvre and Moore2007; Stoop et al., Reference Stoop, Bovenhuis and Van Arendonk2007) and SCS (Rupp et al., Reference Rupp, Bergonier, Dion, Hygonenq, Aurel, Robert-Granie and Foucras2009). However, selection for improved milk production, better quality traits and reduced SCS (indicating increased mastitis resistance) can be potentially enhanced through the identification of quantitative trait loci (QTL), which can help geneticists infer and comprehend the genetic and molecular mechanisms underlying these traits.
Here, in an effort to increase the number of single-nucleotide polymorphisms (SNPs) known to be related to health and quality traits in cattle, we investigated a number of SNPs that have previously been associated with milk traits as well as a subset of genes that were annotated in dbSNP but had not previously been included in an association study. The aims of the present study were to: (i) evaluate allelic and genotypic frequencies of 96 candidate gene polymorphisms; and (ii) investigate the associations between these polymorphisms and milk yield, composition, MUN and SCS in Brown Swiss cows.
Material and methods
Field data
A total of 1271 Brown Swiss cows from 85 herds located in Trento Province (Italy) were sampled once. The dairy systems, land use, feeding strategies, management practice and milk destination of the investigated area have been described by Sturaro et al. (Reference Sturaro, Marchiori, Cocca, Penasa, Ramanzin and Bittante2013). Within a given day, only one herd was sampled. Two milk subsamples per cow were collected and immediately refrigerated at 4°C without any preservative. One random subsample was transported to the Milk Quality Laboratory of the Breeders Federation of Trento Province (Trento, Italy) for composition analysis. Data on the cows and herds were provided by the Breeders Federation of Trento Province (Italy). Pedigree information was supplied by the Italian Brown Swiss Cattle Breeders Association (ANARB, Verona, Italy); we included cows for which phenotypic records were available for the investigated traits and those of all their known ancestors (8845 records in the pedigree file).
Analysis of milk quality
Individual milk samples were analyzed for fat, protein, casein, lactose (expressed in %) and MUN (expressed as mg/100 g) using a MilkoScan FT6000 (Foss, Hillerød, Denmark). Somatic cell count values were obtained with a Fossomatic FC counter (Foss) and converted to SCS by means of logarithm transformation.
DNA extraction and quality control
Peripheral blood samples were collected from each animal in 5 ml Vacutainer tubes containing sodium citrate as an anticoagulant, and stored at −20°C until analysis. DNA extraction was carried out with a DNeasy® 96 Blood & Tissue Kit (Qiagen GmbH, Hilden, Germany) starting with 100 µl of whole blood. For quality control, DNA was resolved by 1% agarose gel electrophoresis and stained with SYBR Safe® (Invitrogen, Carlsbad, CA, USA). All DNA samples were quantified with a QBit system (Invitrogen).
Gene and SNP selection
Candidate gene selection was carried out using two different approaches. First, we used a functional candidate gene approach by selecting genes known to be involved in the synthesis of proteins, fatty acids and components of the immune system. Second, we used a positional candidate gene approach by querying public databases to identify genes located in chromosomal regions that have been associated with milk quality and technological properties.
From within the chosen genes, we selected 113 SNPs for use in building a 96-SNP custom Oligo Pool Assay. Little information was available on their frequency in the Brown Swiss when the SNPs were selected. Thus, we chose most of the SNPs on the basis of their variations in other breeds, and verified their frequency in our population, expecting some differences owing to different selection strategies in the different breeds. Moreover, using SNPs found polymorphic in different breeds could also be useful, as an SNP with the same effect in different breeds could be the causative mutation for a specific trait. Anyway, the estimate of the effects of SNP on production traits has to be verified in any new population in which this information is planned to be used in marker-assisted selection.
As the SNP were going to be genotyped with the Illumina GoldenGate Assay (Illumina, San Diego, CA, USA), they were all submitted for scoring by the Illumina assay design tool and the most suitable for the chosen technology were selected: 89 SNP having scores >0.6 (designability rank=1, high success rate) and 7 having scores between 0.5 and 0.6 (designability rank=0.5, moderate success rate; data not shown). The 96 selected SNPs were located in 54 genes and included synonymous mutations, non-synonymous mutations and promoter region mutations. They were genotyped using the GoldenGate system (Illumina) according to the manufacturer’s protocol. Automatic allele calling was carried out using the GeneCall software (Illumina) with a CG threshold of 0.25.
Statistical analysis
Allele frequencies, genotype frequencies and Hardy–Weinberg equilibrium were determined using Genepop program (version 1.2; Raymond and Rousset, Reference Raymond and Rousset1995). The association studies for all investigated genes were carried out using the following mixed linear animal model:
 $$y_{{ijkl }} =\mu {\plus} {\rm DIM}_{i} {\plus}{\rm Parity}_{j} {\plus}h_{k} {\plus} a_{l} {\plus} x_{{lm}} \beta _{m} {\plus} {\varepsilon}_{{ijkl}} $$
where y ijkl was the phenotypic record for the analyzed trait, DIM i was the effect of the i th class of days in milk (DIM; i=1 to 10; 30 days for each class, with class 1 being <30 days and class 10 being >300 days); parity j was the effect of the j th parity of the cow (j=1 to 5 or more); h k was the effect of the k th herd (k=1 to 85); a l was the infinitesimal genetic effect of individual l; x lm (0,1,2) reflected the number of copies of the minor allele at the m th SNP of subject l; β m was the additive effect of the l th SNP; and ε ijkl was the random residual term.
All the models were analyzed under a standard Bayesian approach. The joint distribution of all parameters in the model
 $$p\left( {{\bf b},{\bf h},{\bf a},\sigma _{e}^{2} ,\sigma _{h}^{2} ,\sigma _{a}^{2} \,\mid\,{\bf y}} \right)$$
was proportional to:
 $$\eqalignno{ & p\left( {{\bf b},{\bf h},{\bf a},\sigma _{e}^{2} ,\sigma _{h}^{2} ,\sigma _{a}^{2} \,\mid\,{\bf y}} \right)\propto{p}\left( {{\bf y}\,\mid\,{\bf b},{\bf h},{\bf a},\sigma _{e}^{2} } \right)p\left( {\sigma _{e}^{2} } \right)p\left( {\bf b} \right) \cr & \quad \quad {\times}p\left( {{\bf h}\,\mid\,\sigma _{h}^{2} } \right)p\left( {\sigma _{h}^{2} } \right)p\left( {{\bf a}\,\mid\,{\bf A},\sigma _{a}^{2} } \right)p\left( {\sigma _{a}^{2} } \right), $$
where y was the vector of phenotypic records; b the vector of systematic effects; h the vector of herd effects; and a the vector of polygenic additive genetic effects. More specifically, b included the systematic effects of SNP, DIM and parity. Moreover, A was the numerator relationship matrix between individuals and
 $$\sigma _{e}^{2} , \sigma _{h}^{2} $$
and
 $$\sigma _{a}^{2} $$
were the residual, herd and additive genetic variances, respectively. For all univariate analyses, bounded uniform priors were used for the environmental variables, and a and h were assumed a priori to be independent and normally distributed, as:
 $${\bf a}\,\mid\,{\rm }\sigma _{a}^{2} \,\sim\,N\left( {0,{\bf A}\sigma _{a}^{2} } \right)$$
and
 $${\bf h}\,\mid\,\sigma _{h}^{2} \,\sim\,N\left( {0,{\bf I}\sigma _{h}^{2} } \right)$$
where I was the identity matrix. Gibbs samples of parameters of concern were obtained as implemented in the TM program (available at http://cat.toulouse.inra.fr/~alegarra/). In the present work, the Gibbs sampler ran with a single chain of 1 000 000 points, and the first 50 000 were discarded as burn-in, previously tested by the Raftery and Lewis (Reference Raftery and Lewis1992) methodology. Samples were saved every 100 iterations. Owing to the autocorrelations between successive samples, convergence was tested using the Geweke’s Z-criterion (Geweke, Reference Geweke1992), and Monte Carlo sampling errors as well as the effective sample size (ESS) were computed using the time-series procedures described by Geyer (Reference Geyer1992). The parameters of concern were the dispersion parameters and the additive effect of SNPs, as defined by Falconer and Mackay (Reference Falconer and Mackay1996). The posterior mean was used as a point estimate for the parameters of concern. The lower and upper bounds of the 95% highest posterior probability density regions (HPD95) for the additive effects were estimated from the Gibbs samples. For all traits, the model was fitted to separately estimate the contribution of each SNP (i.e. the model was run 51 times/trait). SNPs were considered to have a relevant effect on the trait when the posterior means of the additive effect did not include 0 in the HPD interval. Moreover, as suggested by Ramírez et al. (Reference Ramírez, Quintanilla, Varona, Gallardo, Diaz, Pena and Amills2014), we computed PPN0, which was the posterior probability of the estimated effect being lower than 0 (for negative effects) or greater than 0 (for positive effects). Only relevant SNPs are presented in the tables. The genetic variance explained by an SNP (V a ) was calculated from the estimated genotype effects and the observed genotype frequencies. The result was expressed as a percentage of the total additive genetic variance obtained from model 1 without the genotype effect.
Intra-herd heritability, which was computed without considering the effect of SNPs in the model, was defined as:
 $$h^{{\rm 2}} ={{\sigma _{a}^{2} } \over {\sigma _{a}^{2} {\plus}\sigma _{e}^{2} }}$$
where
 $\sigma _{a}^{2} $
and
 $\sigma _{e}^{{\rm 2}} $
were the additive genetic and residual variances, respectively.
Results and discussion
Descriptive statistics
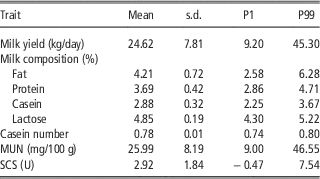
The descriptive statistics for the investigated traits are reported in Table 1. The single test-day milk production, fat content, protein content and casein content were all representative of the Italian Brown Swiss population (Cecchinato et al., Reference Cecchinato, Penasa, De Marchi, Gallo, Bittante and Carnier2011). In our study, the average MUN (25.99 mg/100 g) was slightly higher than that found by Butler et al. (Reference Butler, Calaman and Beam1996), who reported MUN values of 22.8 mg/dl for non-pregnant cows, 21.3 mg/dl for cows later identified as pregnant, and overall mean values of 22.3. More recently, MUN levels of 17.9 mg/dl (Rius et al., Reference Rius, McGilliard, Umberger and Hanigan2010) and 15.5 mg/dl have been reported. MUN levels are influenced by several different factors, including the sampling time, season, breed, nutritional factors, inefficient ruminal degradation of proteins, less efficient protein synthesis in the mammary gland and changes in conversion processes. The published data were mostly obtained from Holstein–Friesian cows, and the fed diets should be considered; thus, a detailed comparison is impossible. We measured MUN/100 g, which is slightly less than the 1 dl studied by the other authors, but the two can be considered to reflect approximately the same unit.
Descriptive statistics of milk yield, composition, MUN and SCS (N=1271)
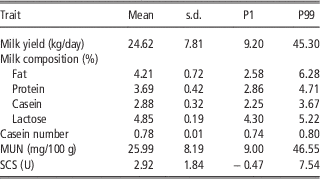
PP1=1st percentile; P99=99th percentile; MUN=milk urea nitrogen; SCS=somatic cell score.
Finally, the average concentration of lactose was 4.85 (0.19), which was similar to the percentages obtained by Miglior et al. (Reference Miglior, Sewalem, Jamrozik, Lefebvre and Moore2006) and Stoop et al. (Reference Stoop, Bovenhuis and Van Arendonk2007) in the Holstein breed.
Variance components and heritability
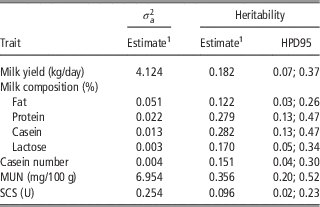
The point estimates and features of the marginal posterior densities obtained for the additive genetic variance and trait heritability (without considering the effects of SNPs) are reported in Table 2. The genetic variances and heritability estimates for milk composition (i.e. protein, casein and fat content) were similar to those obtained by Cecchinato et al. (Reference Cecchinato, Penasa, De Marchi, Gallo, Bittante and Carnier2011) in Brown Swiss cows. Ikonen et al. (Reference Ikonen, Morri, Tyrisevä, Ruottinen and Ojala2004) estimated heritabilities of 0.29 for protein content and 0.18 for fat content in a Finnish Ayrshire population. The heritability of casein content in the present paper (0.28) was lower than the estimates of 0.35 and 0.31 obtained by Ikonen et al. (Reference Ikonen, Morri, Tyrisevä, Ruottinen and Ojala2004) and Samorè et al. (Reference Samorè, Romani, Rossoni, Frigo, Pedron and Bagnato2007), respectively. For SCS, our heritability estimate (0.096) was slightly higher than those of Ikonen et al. (Reference Ikonen, Morri, Tyrisevä, Ruottinen and Ojala2004) and Samorè et al. (Reference Samorè, Romani, Rossoni, Frigo, Pedron and Bagnato2007) (0.06 and 0.07, respectively), but very similar to the 0.09 estimated in Ikonen et al. (Reference Ikonen, Ahlfors, Kempe, Ojala and Ruottinen1999). The heritability values of milk yield, protein and casein content, and SCS were all within the mean±s.d. of the estimates reviewed by Bittante et al. (Reference Bittante, Penasa and Cecchinato2012). In our study, the posterior estimate of heritability for MUN was 0.356, with an HPD95 interval varying from 0.20 to 0.52. In the literature, the heritability estimates for MUN have ranged between 0.14 and 0.44 (Wood et al., Reference Wood, Boettcher, Jamrozik, Jansen and Kelton2003; Mitchell et al., Reference Mitchell, Rogers, Dechow, Vallimont and Cooper2005; Miglior et al., Reference Miglior, Sewalem, Jamrozik, Bohmanova, Lefebvre and Moore2007), depending on the utilized instrument and the cow’s parity. For example, Mitchell et al. (Reference Mitchell, Rogers, Dechow, Vallimont and Cooper2005) estimated a heritability of 0.22 for first-parity cows using IR spectroscopy, but obtained an estimate of 0.14 using wet chemistry techniques; Wood et al. (Reference Wood, Boettcher, Jamrozik, Jansen and Kelton2003) estimated a higher heritability for IR-determined MUN (0.44) using random regression analysis; and Miglior et al. (Reference Miglior, Sewalem, Jamrozik, Bohmanova, Lefebvre and Moore2007) reported that the average daily heritabilities of MUN varied from 0.384 to 0.414, depending on the parity. Our heritability estimate for lactose percentage was 0.151, which was much lower than the values of 0.50 found by Stoop et al. (Reference Stoop, Bovenhuis and Van Arendonk2007) and Miglior et al. (Reference Miglior, Sewalem, Jamrozik, Bohmanova, Lefebvre and Moore2007) in different breeds and using different statistical models. The between-study inconsistencies in the estimated heritabilities may reflect various factors, including the breed, study procedures, conditions for trait recording, utilized models and methods of estimation.
Features of marginal posterior densities of additive genetic variance (
 $$\rsigma _{a}^{2} $$
) and heritability (h
2) for milk yield, composition, MUN and SCS
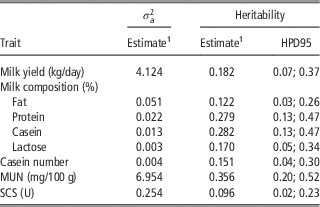
HPD95=lower and upper bound of the 95% highest posterior density region; MUN=milk urea nitrogen; SCS=somatic cell score.
1 Mean of the marginal posterior density of the parameter.
Allele frequencies
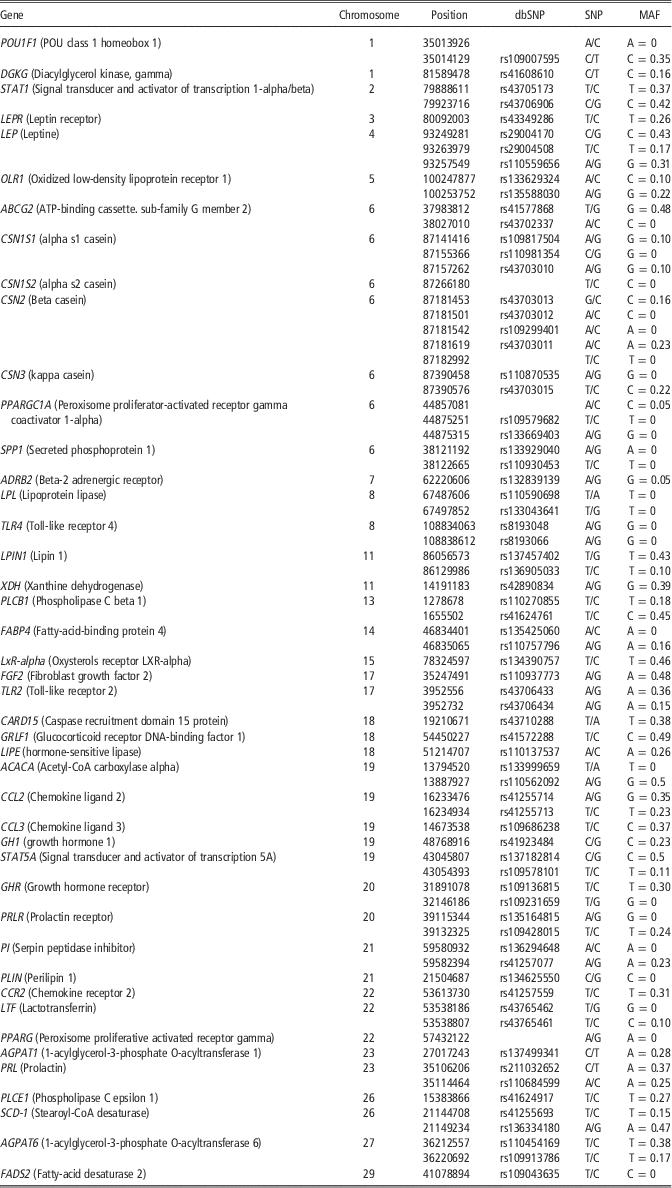
Of the 96 selected SNPs, a total of 76 SNPs in 44 genes were successfully genotyped, with call rates between 0.833 and 0.999. The remaining 20 SNPs suffered from insufficient intensity or failure of cluster separation. Not all of the investigated SNPs had been previously analyzed in the Brown Swiss breed. Of the 76 genotyped SNPs, 25 were monomorphic in our population (Table 3), confirming the need to test molecular markers in different breeds before using them in marker-assisted selection.
List of the successfully genotyped SNPs including chromosome position (referring to Bos taurus UMD_3.1 assembly) and MAF
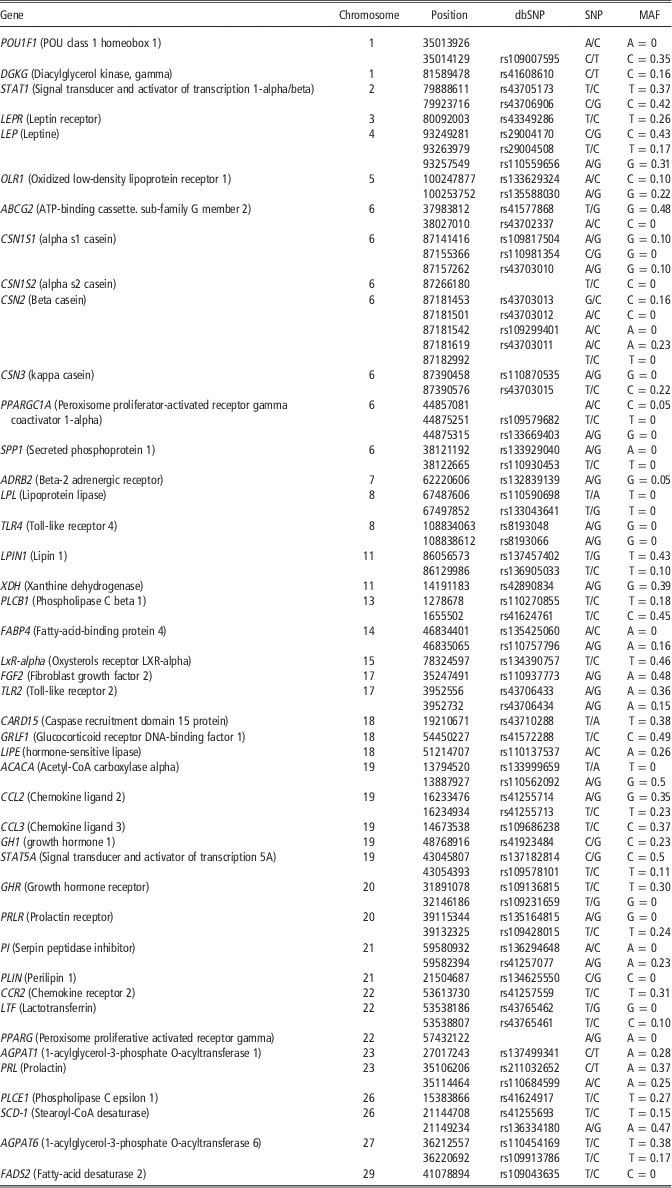
SNP=single-nucleotide polymorphism; MAF=minor allele frequency.
Some alleles that had been positively and significantly associated with different milk traits in other breeds were not found in our population, including the A variant of the POU1F1 gene and the T allele of PPARGC1A rs109579682 (Khatib et al., Reference Khatib, Schutzkus, Chang and Rosa2007). In contrast, others were fixed in our population, including the A variant of ABCG2 rs43702337, the C allele of OPN rs11093045 and the G allele of GHR rs109231659 (Waters et al., Reference Waters, McCabe, Howard, Giblin, Magee, MacHugh and Berry2011). With respect to the polymorphic loci, ACACA rs110562092 and STAT5A rs137182814 showed perfectly balanced allelic frequencies, whereas ABCG2 rs41577868, PLCB1 rs41624761, LxR-alpha rs134390757, FGF2 rs110937773, GRLF1 rs41572288 and SCD-1 rs136334180 showed very nearly balanced frequencies. In terms of MAF, 23 SNPs had frequencies between 0.5 and 0.3, 28 were between 0.28 and 0.05, and only 7 were lower than 0.10. Thus, all of the successfully genotyped polymorphic SNPs were subjected to association studies.
For many of the SNPs, such as those in the LPIN1, XDH, PLCB1, LIPE, CCL3, PLIN, AGPAT1, PLCE1 and AGPAT6 genes, the allele frequencies were not previously known in Brown Swiss cows. For others, the minor allele in our population was the same as described in another population, but the allelic frequencies differed. This was the case for STAT1 rs43705173, where the T allele had a frequency of 0.37 in our population compared with 0.33 in the Holstein breed (Cobanoglu et al., Reference Cobanoglu, Zaitoun, Chang, Shook and Khatib2006); LEP rs29004508, where the T allele had frequencies of 0.17 and 0.25, respectively, in our population and in the Dutch Holstein–Friesian breed (Liefers et al., Reference Liefers, Veerkamp, te Pas, Delavaud, Chilliard, Platje and van der Lende2004); CARD15 rs43710288, where the T allele had frequencies of 0.38 and 0.46, respectively, in our population and the Holstein–Friesian breed (Pant et al., Reference Pant, Schenkel, Leyva-Baca, Sharma and Karrow2007); and CCR2 rs41257559, where the T allele had a frequency of 0.31 in the present population and 0.46 in the Canadian Holstein breed (Leyva-Baca et al., Reference Leyva-Baca, Schenkel, Sharma, Jansen and Karrow2007). For CCL2, rs41255714 had the same minor allele as that reported by Leyva-Baca et al. (Reference Leyva-Baca, Schenkel, Sharma, Jansen and Karrow2007) in the Canadian Holstein breed (G, with frequencies of 0.35 and 0.44, respectively), whereas the minor allele was T (0.23) in our population and C (0.32) in the Canadian Holstein. For FABP4 rs110757796, the minor allele was A (0.16), whereas Cho et al. (2008) reported that the minor allele was G (0.375). In the latter case, the difference might be because of selection differences between Brown Swiss dairy cattle and Native Korean beef cattle. Finally, GHR rs109136815, an SNP in exon 10 that determines a silent mutation in amino acid 545 and was previously associated with milk yield (Blott et al., Reference Blott, Kim, Moisio, Schmidt-Küntzel, Cornet, Berzi, Cambiaso, Ford, Grisart, Johnson, Karim, Simon, Snell, Spelman, Wong, Vilkki, Georges, Farnir and Coppieters2003), was found to have a minor allele (C) frequency twofold higher in Brown Swiss compared with the values found for five other breeds by Waters et al. (Reference Waters, McCabe, Howard, Giblin, Magee, MacHugh and Berry2011).
Association analysis
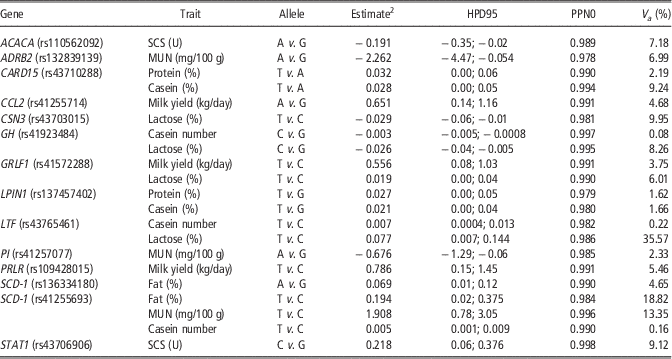
The features of the marginal posterior densities of the additive effects for the relevant SNPs on milk yield, composition, MUN and SCS are reported in Table 4. All Monte Carlo s.e.’s were small, and the Geweke Z-test did not detect any lack of convergence. Moreover, the ESS values were high for all of the tested SNPs (data not shown). The marginal posterior distributions of the additive effects were approximately normal.
Features of the estimated marginal posterior densities of additive effects for the relevant SNPFootnote 1 on milk yield, composition, MUN and SCS
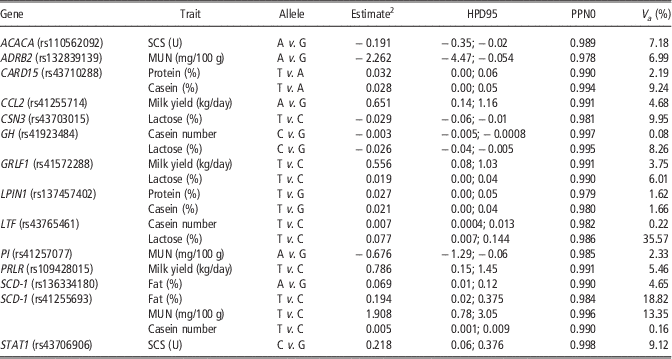
HPD95=lower and upper bound of the 95% highest posterior density region; PPN0=the posterior probability of the additive effect to be over or below zero; V a =proportion of genetic variance explained by each SNP; SCS=somatic cell score; MUN=milk urea nitrogen; SNP=single-nucleotide polymorphism.
1 SNPs were considered having a relevant effect on the trait when the posterior means of the additive effect did not include 0 in the HPD interval.
2 Mean of the marginal posterior density of the parameter.
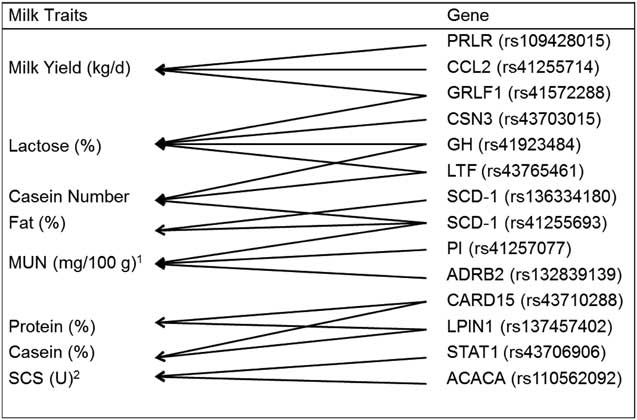
Milk composition and properties are determined by many factors, among which exist a complicated relation that is rather difficult to interpret. We found associations with milk traits for 14 of the 51 polymorphic genes analyzed (Table 4). Of these SNPs, six (GRLF1 rs41572288, GH rs41923484, LTF rs43765461, SCD-1 rs41255693, CARD15 rs43710288 and LPIN1 rs137457402) were found in association with multiple traits, whereas the remaining eight (PRLR rs109428015, CCL2 rs41255714, CSN3 rs43703015, SCD-1 rs136334180, PI rs41257077, ADRB2 rs132839139, ACACA rs110562092 and STAT1 rs43706906) had effects only on one trait, as shown in Figure 1.
Schematic relationship between the relevant SNP and milk yield, composition, MUN and SCS. SNP=single-nucleotide polymorphism; MUN=milk urea nitrogen; SCS=somatic cell score.
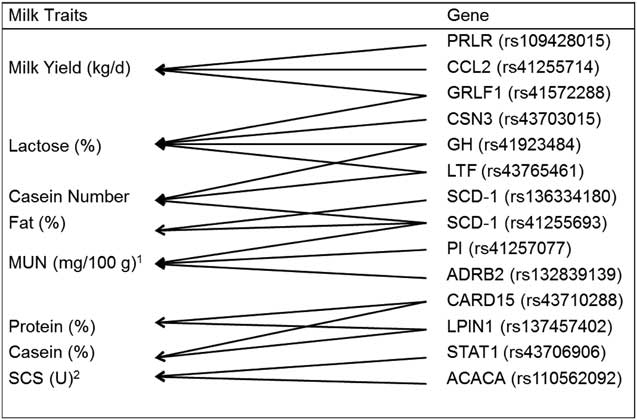
Considering milk yield PRLR rs109428015 (T v. C=0.786; PPN0=0.991; V a =5.46%) and CCL2 rs41255714 (A allele=+0.65 kg of milk; PPN0=0.991; V a =6%) were associated only with this trait, whereas allele A of GRLF1 rs41572288 was found to be positively associated with both milk yield and lactose percentage (T allele=+0.56 kg of milk and +0.019% of lactose; PPN=0.99; and V a =4% and 6.01%, respectively). PRLR was already associated with milk yield in the Finnish Ayrshire breed and CCL2 in the Canadian Holstein (Leyva-Baca et al., Reference Leyva-Baca, Schenkel, Sharma, Jansen and Karrow2007). As for GRLF1 gene, two SNPs had previously been associated with feed intake and feed conversion rate, indicating that this gene is involved in the production of energy in cattle, and thus potentially explaining its relation with lactose percentage. The association with milk yield can be indirectly due to its well-known association with lactose percentage. However, additional research is warranted to examine the role of this gene in milk production.
Lactose percentage was also influenced by CSN3 rs43703015, where the estimated substitution effect of the T allele was equal to −0.029 (PPN0=0.981) with almost 10% of additive genetic variance explained by the SNP. Interestingly, this was the only association involving casein variants, confirming their modest effect on milk composition (Penasa et al., Reference Penasa, Cassandro, Pretto, De Marchi, Comin, Chessa, Dal Zotto and Bittante2010). Other genes had SNP in associations with milk composition: GH rs41923484 and LTF rs43765461, together with lactose percentage, also influenced casein number. In particular, the C allele of GH rs41923484 reduced both lactose percentage (−0.026; PPN=0.995; V a =8.26%) and casein number (−0.003; PPN0=0.997; V a =0.08), whereas the T allele of LTF rs43765461 was positively associated with both traits with a striking effect on lactose percentage (+0.077; PPN0=0.986), explaining a very high proportion of additive genetic variance (35.57%). The effect of each SNP on casein number was very limited, even considering SCD-1 rs41255693 (T v. C=+0.005; PPN0=0.990; V a =0.16%).
SCD-1 polymorphisms were previously associated with fat, protein and/or casein contents in Belgian Blue Red and White, Jersey, Montbeliarde, Normande (Soyeurt et al., Reference Soyeurt, Dehareng, Mayeres, Bertozzi and Gengler2008) and Brown Swiss (Soyeurt et al., Reference Soyeurt, Dehareng, Mayeres, Bertozzi and Gengler2008; Cecchinato et al., Reference Cecchinato, Ribeca, Maurmayr, Penasa, De Marchi, Macciotta, Mele, Secchiari, Pagnacco and Bittante2012) cows. The associations with fat percentage and casein number were confirmed in our population, with a high effect on fat percentage (T v. C=+0.194; PPN0=0.984; V a =18.82%). SCD-1 rs41255693 was also associated with MUN (T v. C=+1.908; PPN0=0.996) and it explained more than 13% of the additive genetic variances of the trait.
Another interesting association was found between ADRB2 rs132839139 and PI rs41257077 with respect to MUN. For ADRB2 rs132839139, the estimated effect for the A allele was −2.262 mg/100 g (PPN0=0.978; V a =6.99%). For PI rs41257077, the corresponding estimate for the A allele was −0.676 mg/100 g (PPN0=0.985; V a =2.33%). As milk urea is synthesized as a consequence of an imbalance between dietary nitrogen and energy in the rumen, we speculate that the effect of the ADRB2 gene may be related to the involvement of β-adrenergic receptors in lipolysis and the regulation of muscle growth to the detriment of fat deposition. Although stimulation of β-adrenergic receptors in the bovine mammary gland has been shown to affect milk characteristics, including milk yield, little genetic information is yet available for cattle. Cows with greater genetic merit in terms of milk production were found to have increased adipose tissue lipolysis, increased responses to β-adrenergic stimulation, increased hormone-sensitive lipase (LIPE) activity and decreased lipogenesis, compared with animals of average genetic merit. Thus, the relationship of these genes with energy balance and milk traits should further be investigated. The bovine PI gene is located in a QTL associated with milk production and health traits (Khatib et al., Reference Khatib, Heifetz and Dekkers2005). The primary role of PI is to protect tissues against proteolytic digestion by neutrophil elastase. Khatib et al. (Reference Khatib, Heifetz and Dekkers2005) discovered several polymorphisms in this gene. Here, we found associations only for PI rs41257077, previously associated with decreased SCS, with MUN. In the human mammary gland, PI may affect the survival of milk proteins, such as lactoferrin and lysozyme. Thus, an SNP that influences unfavorably the protection of these proteins could increase MUN.
The last genes influencing simultaneously different traits were CARD15, involved in recognizing gram-positive and gram-negative bacteria, and thus acting as a general sensor of bacterial infection, and LPN1, which play crucial roles during adipose tissue development and triacyl–glycerol accumulation (Phan and Reue, Reference Phan and Reue2005). In our population, CARD15 rs43710288 was associated with the casein and protein percentages (T v. A=0.032 and T v. A=0.028, respectively) and was responsible for 2.19% and 9.24% of the additive genetic variances of these traits. The SNP c.3020A>T (CARD15 rs43710288) was found to be associated with estimated breeding values for SCS, udder depth, milk yield and protein yield, whereas SNP c.4500A>C was associated with milk, fat and protein yields in Canadian Holstein bulls (Pant et al., Reference Pant, Schenkel, Leyva-Baca, Sharma and Karrow2007). The authors concluded that these two SNPs, together with other gene polymorphisms, could be used to genetically select for mastitis resistance and production, and our study confirms their contention that CARD15 rs43710288 is a candidate for further functional studies.
LPIN1 rs137457402, whose posterior probabilities of the additive effect of the T allele were equal to 0.027 (PPN0=0.979) and 0.021 (PPN0=0.98) for protein and casein percentage, respectively, explained roughly 2% of the additive genetic variances of both traits. Recent studies have shown that lipin proteins, particularly LPIN1, play crucial roles during adipose tissue development and triacyl–glycerol accumulation (Phan and Reue, Reference Phan and Reue2005). Furthermore, the expression levels of the lipin genes have been shown to influence lactation, with LPIN1 predominating during lactation. Thus, this gene is clearly involved in modifying the composition of milk during lactation. Finck et al. (Reference Finck, Gropler, Chen, Leone, Croce, Harris, Lawrence and Kelly2006) demonstrated that LPIN1 is essential for PPARa activation, suggesting that LPIN1 may be involved in regulating the transcription of other genes involved in milk fat synthesis. However, additional research will be necessary to clearly delineate its role in milk production.
Finally, two genes showed significant effects on SCS. The T allele of ACACA rs110562092 (our unique polymorphic ACACA SNP of the two directly chosen from dbSNP) was unfavorably associated with SCS (−0.191; PPN0=0.989). It explained a relevant proportion of the additive genetic variance of SCS (7.18%). Interestingly, STAT1 rs43706906 was also relevant in explaining variation of SCS in our population (the T allele increase the trait by 0.218 U; PPN0=0.998; V a =9.18%). STAT1 is a signal transducer and activator of transcription that is activated by numerous cytokines, growth factors and hormones, and is involved in the development and differentiation of the mammary gland. Thus, an association with SCS could be expected. The STAT1 rs43705173 SNP, which was not associated with any milk trait in our Brown Swiss population, was previously correlated with SCS and other milk traits in the Holstein breed by Cobanoglu et al. (Reference Cobanoglu, Zaitoun, Chang, Shook and Khatib2006). Thus, the effects of STAT1 rs43706906 might reflect linkage disequilibrium between this mutation and a causative mutation located in the gene. Notably, STAT1 expression is tightly correlated with lipid accumulation, and ACACA encodes a key enzyme in the regulation of fatty-acid synthesis. Fatty acids are essential for the formation of cell membranes, and are used to synthesize fat for storage in adipose tissue or secretion into milk by the mammary gland. Thus, our results may suggest the presence of a complex relationship between STAT1 and ACACA.
Conclusions
Polymorphisms in 51 SNPs were tested for their associations with milk production, composition, MUN and SCS in Brown Swiss cows. SNPs in 14 genes (ACACA, ADRB2, CARD15, CCL2, CSN3, GH, GRLF1, LPIN1, LTF, PI, PRLR, SCD-1, SCD-1 and STAT1) were found to be associated with at least one of the aforementioned traits. In particular, the most striking effects were found for: LTF rs43765461 on lactose percentage (35.57% of additive genetic variance; T allele positively associated) with also a small positive effect on casein number; SCD-1 rs41255693 on fat percentage (18.82% of additive genetic variance; T allele positively associated) with also more than 13% of the additive genetic variances of MUN (T allele=+1.908), and a small effect on casein number; CSN3 rs43703015 with almost 10% of additive genetic variance explained by the SNP (allele T negatively associated); CARD15 rs43710288 responsible for 9.24% and 2.19% of the additive genetic variance of protein and casein percentages, respectively (allele T positively associated), and was responsible for and of the additive genetic variance of these traits.
These information may be useful in marker-assisted selection or a related technique (e.g. genomic selection placing greater prior emphasis on known QTLs), with the goal of increasing the accuracy of selection, especially for quality and health traits, and increasing genetic gains.
Acknowledgments
Authors thanks the Trento Province (Italy) for financial support, the Italian Brown Swiss Cattle Breeders Association (ANARB, Verona, Italy) for supplying pedigree information, and the Superbrown Consortium of Bolzano and Trento, and Trento Province (Italy) for technical support.