INTRODUCTION
Lacustrine sedimentary sequences represent natural archives generated by continuous accumulation of sediments, integrating local, regional, and global environmental signals from natural and anthropogenic sources (Smol, Reference Smol2008). Multiproxy analyses (sedimentology, mineralogy, geochemistry, isotopic fingerprints of organic material) provide a useful tool for reconstructing the history of lakes and their watersheds, for example, to trace sediment sources, investigate weathering processes, analyze metal contents, and identify past climatic anomalies (Fey et al., Reference Fey, Korr, Maidana, Carrecedo, Corbella, Dietrich and Haberzettl2009; Hermanns and Biester, Reference Hermanns and Biester2013; among others).
Such reconstructions from lake sediments are limited in South America, particularly at Patagonian latitudes. Interest in this extreme environment has increased over the last decades as it represents the southernmost continuous landmass extending perpendicularly to the westerly wind field, with the Andes as a topographic barrier generating a contrasting climate from west to east (Paruelo et al., Reference Paruelo, Beltrán, Jobbágy, Sala and Golluscio1998). Patagonian systems have become the target for studies regarding the timing and nature of late-Holocene climate variability based on marine and terrestrial archives, as well as on diverse proxies (Kilian and Lamy, Reference Kilian and Lamy2012). Furthermore, increasing interest in Patagonian lakes is focused on their remoteness and pristine characteristics; such lakes have been the subjects of studies related to long-range atmospheric metal transport and deposition (Hg, Pb, Cu, Sb, Sn, Zn), mainly associated with anthropogenic inputs (Hermanns and Biester, Reference Hermanns and Biester2013; De Vleeschouwer et al., Reference De Vleeschouwer, Vanneste, Mauquoy, Piotrowska, Torrejón, Roland, Stein and Le Roux2014; Daga et al., Reference Daga, Ribeiro Guevara, Pavlin, Rizzo, Lojen, Vreča, Horvat and Arribére2016a).
In eastern Andean lakes from north Patagonia, several environmental studies have been carried out using geochemical and biological proxies (Ribeiro Guevara et al., Reference Ribeiro Guevara, Rizzo, Sánchez and Arribére2005, Reference Ribeiro Guevara, Meili, Rizzo, Daga and Arribére2010; Ariztegui et al., Reference Ariztegui, Bösch and Davaud2007; Iglesias et al., Reference Iglesias, Whitlock, Bianchi, Villarosa and Outes2011, Reference Iglesias, Whitlock, Bianchi, Villarosa and Outes2012; Markgraf et al., Reference Markgraf, Iglesias and Whitlock2013; Daga et al., Reference Daga, Ribeiro Guevara, Pavlin, Rizzo, Lojen, Vreča, Horvat and Arribére2016a; Williams et al., Reference Williams, Rieradevall, Añón Suárez, Rizzo, Daga, Ribeiro Guevara and Arribére2016; among others). However, the most detailed climatic inferences in this area for recent centuries come from tree–ring analyses and glacial evidence (Villalba, Reference Villalba1990, Reference Villalba1994; Masiokas et al., Reference Masiokas, Luckman, Villalba, Ripalte and Rabassa2010). The available reconstructions, which are geographically scattered, have demonstrated significant environmental and climatic changes during the last millennia, mainly related to the Medieval Climatic Anomaly (MCA), the Little Ice Age (LIA), and shifts in the latitudinal position of the westerlies; instrumental studies have also recorded warming conditions during the twentieth century (Barros et al., Reference Barros, Boninsegna, Camilloni, Chidiak, Magrín and Rustiucci2015). Such climatic periods are better established in the Northern Hemisphere; however, temperature reconstructions show warm and cold peaks varying regionally, with more similarity within each hemisphere than between them, without evidence of globally synchronized MCA and LIA intervals (Mann et al., Reference Mann, Zhang, Rutherford, Bradley, Hughes, Shindell, Ammann, Faluvegi and Ni2009; Ahmed et al., Reference Ahmed, Anchukaitis, Asrat, Borgaonkar, Braida, Buckley and Büntgen2013; Neukom et al., Reference Neukom, Gergis, Karoly, Wanner, Curran, Elbert and González-Rouco2014; Lüning et al., Reference Lüning, Galka, Bamonte, Rodríguez and Vahrenholt2019).
Most of the works that reconstruct climatic parameters at hemispheric and global scales note the uncertainties in timing and intensity in the Southern Hemisphere records and await more confident proxy data collection (Mann et al., Reference Mann, Zhang, Hughes, Bradley, Miller, Rutherford and Ni2008). In northern Patagonia, dendrochronological reconstructions east of the Andes identified a warm–dry period at AD 1080–1250, which correlates with the MCA of Europe (Villalba, Reference Villalba1994), while at similar latitudes of the western side such conditions were not observed (Lara and Villalba, Reference Lara and Villalba1993). One study on a lake on the lee side of the Andes identified a period of dry climate between AD 1100 and 1450 (Williams et al., Reference Williams, Añón Suárez, Rieradevall, Rizzo, Daga, Arribére and Ribeiro Guevara2019), but lacustrine reconstructions at southernmost locations document warm/dry conditions spanning AD 750–1700 (Mayr et al., Reference Mayr, Fey, Haberzettl, Janssen, Lucke, Maidana and Ohlendorf2005; Moy et al., Reference Moy, Moreno, Dunbar, Kaplan, Francois, Villalba, Haberzettl, Vimeux, Sylvestre and Khodri2009; Waldmann et al., Reference Waldmann, Ariztegui, Anselmetti, Austin, Moy, Stern, Recasens and Dunbar2010) with contrasting wetter climates at ~53–55°S (Schimpf et al., Reference Schimpf, Kilian, Kronz, Simon, Spötl, Wörner, Deininger and Mangini2011; van Bellen et al., Reference Van Bellen, Mauquoy, Hughes, Roland, Daley, Loader, Street-Perrot, Rice, Pancotto and Payne2016) during the period roughly covering the MCA. On the other hand, the LIA was associated with a cooler, wetter climate in northern Patagonia, as discerned from tree rings and glaciers, between the fourteenth and the seventeenth centuries (Lara and Villalba, Reference Lara and Villalba1993; Villalba, Reference Villalba1994). Lake sequences at similar latitudes evidence a wet/cold period lasting from the sixteenth to the eighteenth century (Bertrand et al., Reference Bertrand, Boës, Castiaux, Francois, Urrutia, Espinoza, Lepoint, Charlier and Fagel2005; Fagel et al., Reference Fagel, Böes and Loutre2008; Serra et al., Reference Serra, García, Maidana, Villarosa, Lami and Massaferro2016; Williams et al., Reference Williams, Rieradevall, Añón Suárez, Rizzo, Daga, Ribeiro Guevara and Arribére2016, Reference Williams, Añón Suárez, Rieradevall, Rizzo, Daga, Arribére and Ribeiro Guevara2019), while at southernmost latitudes, such evidence spans longer periods, from AD 1400 to 1950 (Haberzettl et al., Reference Haberzettl, Fey, Lücke, Maidana, Mayr, Ohlendorf, Schäbitz, Schleser, Wille and Zolitschka2005; Fey et al., Reference Fey, Korr, Maidana, Carrecedo, Corbella, Dietrich and Haberzettl2009).
Aside from the difficulty of combining information from different proxies, the inconsistencies observed are partly related to the limited chronologic control of some records, as well as to inherent restrictions of each climatic archive, for example, lack of calibration, sensitivity, and uncertainty of each proxy (Hughes and Díaz, Reference Hughes and Diaz1994; Kilian and Lamy, Reference Kilian and Lamy2012). Furthermore, at Patagonian latitudes, the north–south precipitation gradient at multi-centennial time scales is controlled by the latitudinal position of the southern westerlies (Lamy et al., Reference Lamy, Kilian, Arz, Francois, Kaiser, Prange and Steinke2010). Therefore, the estimates of climatic events in Patagonia are still uncertain and difficult to compare, and more efforts are necessary to improve regional interpretations.
Like all Patagonian lakes, the study site is under the influence of the Southern Volcanic Zone (SVZ). Frequently, lake sedimentation is affected by tephra deposition, which provides a useful tool for dating and correlating the sequences used for palaeoenvironmental reconstructions (Bertrand et al., Reference Bertrand, Boës, Castiaux, Francois, Urrutia, Espinoza, Lepoint, Charlier and Fagel2005; Moy et al., Reference Moy, Moreno, Dunbar, Kaplan, Francois, Villalba, Haberzettl, Vimeux, Sylvestre and Khodri2009; Daga et al., Reference Daga, Ribeiro Guevara and Arribére2016b). It has been observed, however, that tephra deposition can cause changes in lakes and their catchment, with significant physical (sedimentation rate, light availability, habitat alteration), chemical (soluble compounds, nutrient availability, heavy metals), and biological (composition of lacustrine communities) effects (Telford et al., Reference Telford, Barker, Metcalfe and Newton2004; Ayris and Delmelle, Reference Ayris and Delmelle2012) that mask climatic impacts. Although distal tephra layers are more frequent and geographically more dispersed, little is known about the effects of the deposition, and records can be contradictory (Mayr et al., Reference Mayr, Smith, García, Massaferro, Lücke, Dubois and Maidana2019). Despite the fact that records can be variable, it is important to recognize tephra layers in lake sequences to prevent misinterpretation in paleolimnological reconstructions (Telford et al., Reference Telford, Barker, Metcalfe and Newton2004).
Considering the potential of lake sediments and the scarce climatic records for the last millennia in northern Patagonia, particularly east of the Andes, a short sedimentary sequence from Lake Futalaufquen in northern Patagonia was studied. The sequence covers around 1600 years of deposition, and sedimentological, mineralogical, geochemical, and isotopic (carbon and nitrogen) proxies were analyzed as paleoclimatic indicators. With the integration of this information we assessed the main characteristics of the sediments and the temporal variation of the studied proxies throughout the profile. The focus of this paper is to explore the geochemistry and mineralogy of the sediments to identify past natural or anthropogenic environmental changes that have affected northern Patagonia during the last 1600 years, with emphasis on the LIA and the MCA, as well as on environmental conditions during the twentieth century.
Regional setting
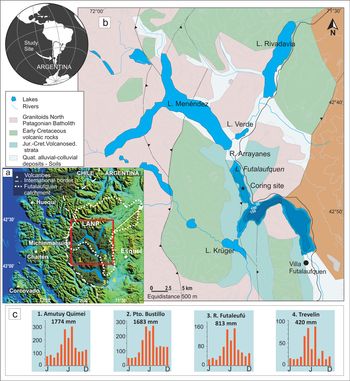
Lake Futalaufquen (42°49'S, 71°43'W; 44.6 km2; 168 m max. depth; 518 m asl) is an irregularly shaped lacustrine system of glacial origin (Fig. 1). It is oligotrophic, warm monomictic, and thermally stratified during late spring and summer (thermocline at around 38 m; Balseiro et al., Reference Balseiro, Modenutti, Queimaliños and Reissig2007). The water body belongs to the Los Alerces National Park (LANP), Northern Patagonia, Argentina, and part of the huge catchment (2920 km2) extends beyond the park limits (Fig. 1). Mountains reaching 2100 m asl, more than ten water bodies, and a network of numerous tributaries characterize the watershed and the hydrographic system. Through the short River Arrayanes, the connected lakes of Cholila, Rivadavia, Verde, and Menéndez discharge into Lake Futalaufquen, from which an outlet channel empties into the small Lake Kruger (Fig. 1). The catchment lithology is composed of hornblende-biotite granitoids, interbedded andesitic-rhyolitic volcanic rocks, and volcano-sedimentary sequences (Lizuain, Reference Lizuain1999; Orts et al., Reference Orts, Folguera, Giménez, Ruiz, Rojas Vera and Klinger2015). Pleistocene aggradational deposits and Holocene alluvial and colluvial materials fill the lowlands and valleys. Andisols and mollisols represent the soils on gentle to moderate slopes (Del Valle, Reference Del Valle1998). Patagonian forest covers most of the catchment, but high Andean vegetation is scarce, and bare rocks dominate the area above the tree line at 1400 m asl (Vila and Borrelli, Reference Vila and Borrelli2011). The area is located close to the central and southern segments of the Southern Volcanic Zone (central SVZ, 37–42°S; southern SVZ, 42–46°S, respectively; Stern, Reference Stern2004). Nearby active volcanoes (i.e., Huequi, Chaitén, Michinmahuida, and Corcovado) frequently affected the site (Daga et al., Reference Daga, Ribeiro Guevara and Arribére2016b).
(color online) (a) Location of Lake Futalaufquen in Los Alerces National Park (LANP), Argentina, its catchment, and regional setting (Chile-Argentina international border and close-by volcanoes of the Southern Volcanic Zone); (b) geology (modified from Orts et al., Reference Orts, Folguera, Giménez, Ruiz, Rojas Vera and Klinger2015) of the area, coring site, and topography; (c) precipitation data illustrate the strong west-to-east decline in rainfall: annual precipitation and monthly distribution (2009–2016; meteorological information from the Instituto Nacional de Tecnología Agropecuaria, Esquel) from four local stations in the study area (1) Amutuy Quimei, (2) Pto. Bustillo, (3) R. Futaleufú, and (4) Trevelin; for locations see (a).

The southern westerlies storm tracks directly affect South America between 40°S and 50°S with seasonal to centennial latitudinal variations (Toggweiler et al., Reference Toggweiler, Russell and Carson2006; Garreaud et al., Reference Garreaud, Vuille, Campagnucci and Marengo2009). The Andes range intersects the core of the westerlies and disrupts the circulation pattern. The strong and constant humid air masses from the Pacific generate orographic precipitation at the western Chilean side of the Andes and become drier to the east in Argentina (Paruelo et al., Reference Paruelo, Beltrán, Jobbágy, Sala and Golluscio1998; Garreaud et al., Reference Garreaud, Lopez, Minvielle and Rojas2013). This generates a strong west–east precipitation gradient with more than 2000 mm yr-1 at the highest Andes decreasing exponentially to less than 200 mm yr-1 in the steppe towards the east (Paruelo et al., Reference Paruelo, Beltrán, Jobbágy, Sala and Golluscio1998) (Fig. 1). At Lake Futalaufquen, on the lee side of the Andes (Fig. 1), climate is cool–temperate humid with austral fall–winter precipitation (mean annual precipitation ~1700 mm) and 8°C mean annual temperature (Paruelo et al., Reference Paruelo, Beltrán, Jobbágy, Sala and Golluscio1998; Vila and Borelli, Reference Vila and Borrelli2011).
The earliest evidence of native communities (hunter–gatherers) in northern Patagonia dates from 8000 years ago, while Europeans arrived only in the seventeenth–eighteenth centuries (Veblen et al., Reference Veblen, Kitzberger, Raffaele, Lorenz, Veblen, Baker, Montenegro and Swetnam2003). LANP has been a protected area since 1937, prior to any extensive anthropogenic activity. Until that time, perhaps the most disturbing activity in the area was the use of fire by natives to hunt (in the mid-nineteenth century) and by Europeans to clear forests (in the late nineteenth to early twentieth centuries) (Veblen et al., Reference Veblen, Kitzberger, Raffaele, Lorenz, Veblen, Baker, Montenegro and Swetnam2003). Currently, human activities are limited to seasonal tourism, and about 2000 people inhabit the basin and farm livestock in the headwaters area.
MATERIALS AND METHODS
Coring, sampling, and chronology
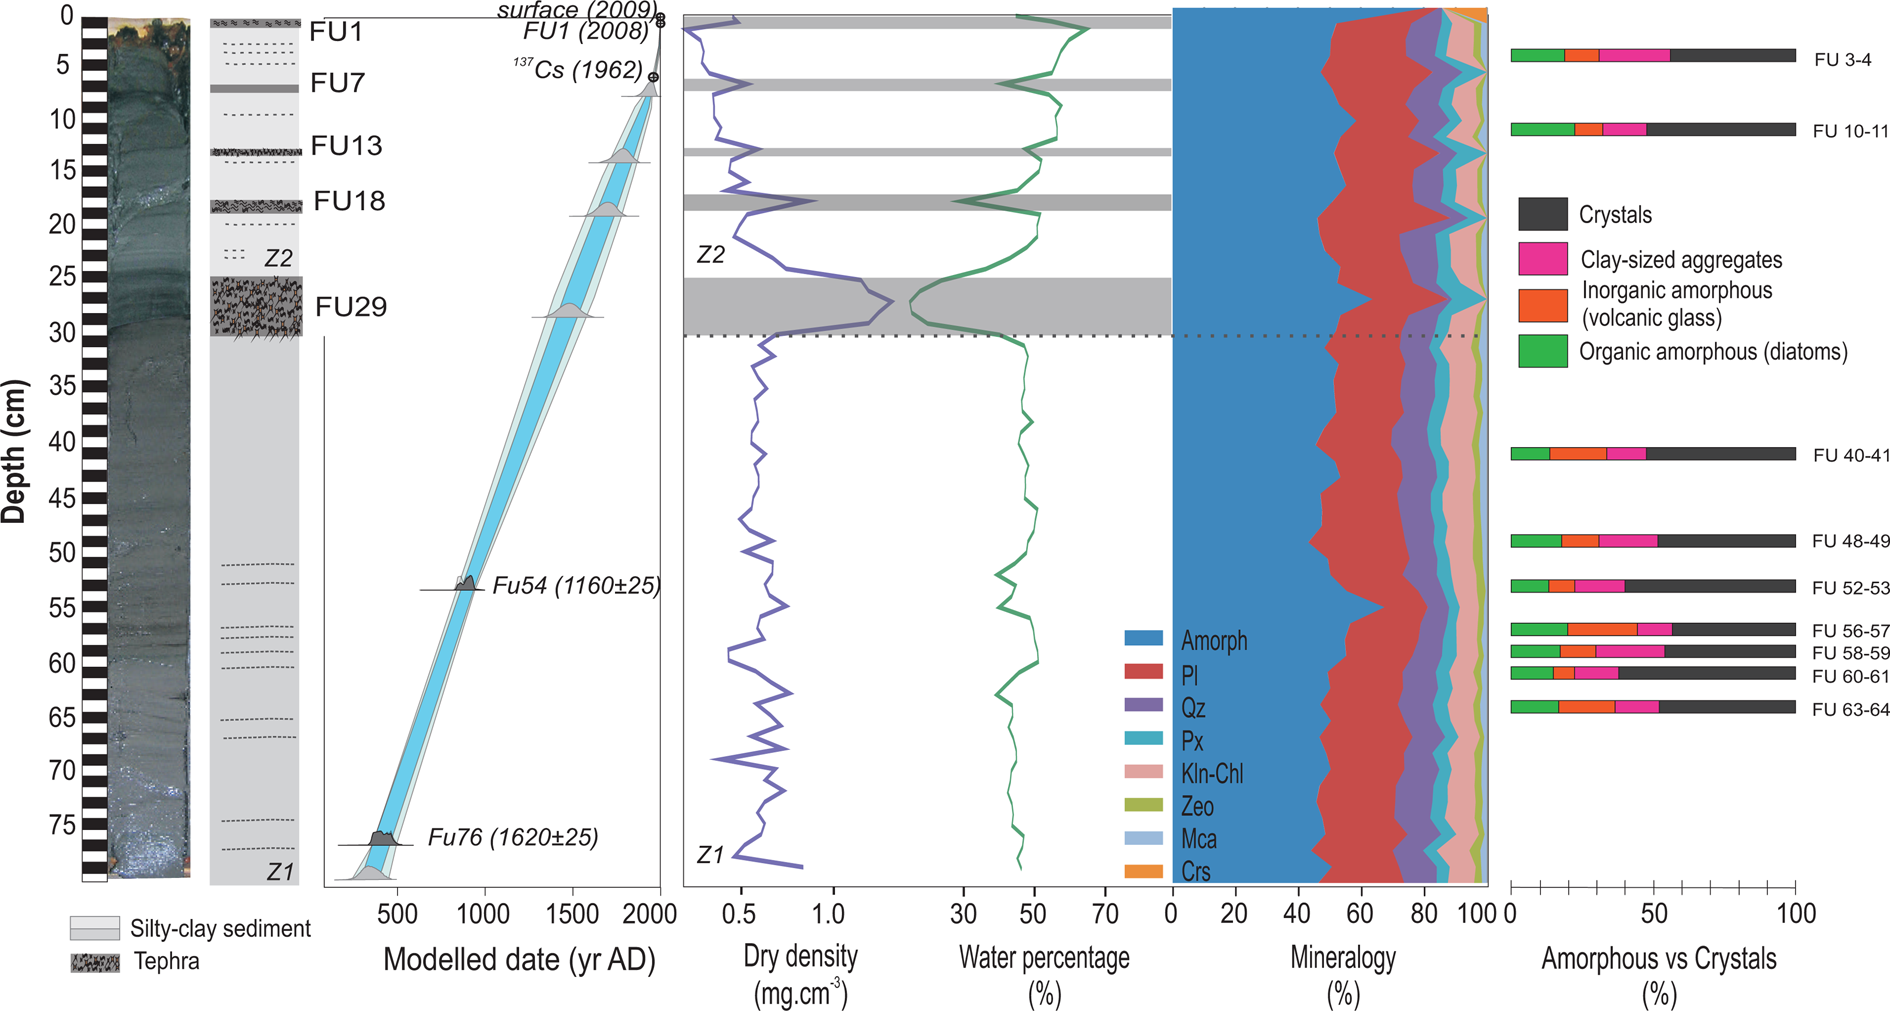
A sediment core (79 cm long, Fig. 2) was extracted in the austral summer of 2009 using a messenger-activated gravity type corer from the central flat part (90 m depth; 42°49'S, 71°43'W) of the northern basin of Lake Futalaufquen (see Fig. 1). The sediment core was longitudinally opened, visually inspected, and subsampled into 1-cm-thick slices, unless other natural boundaries like tephra layers were observed. Tephra layers were sampled completely if their thickness was less than 1.5 cm or in 1-cm slices if they were thicker. Each sediment slice was frozen and freeze-dried until weight was constant. Five tephra layers were visually identified in the sedimentary sequence (Daga et al., Reference Daga, Ribeiro Guevara and Arribére2016b).
(color online) Photography and schematic lithology of Lake Futalaufquen sediment sequence. The age-depth model is presented with probability distributions of 14C dates in dark gray and the age including uncertainties in parentheses; 137Cs date point, a known tephra (FU1) and extraction dates are also shown. Probability distributions in light gray were obtained from the model to date tephra layers (FU7, FU13, FU18, and FU29) and the bottom of the sequence (modified from Daga et al., Reference Daga, Ribeiro Guevara and Arribére2016b). Lithological Zones 1 (Z1) and 2 (Z2), main sedimentological features, such as dry bulk density, water percentage (modified from Daga et al., Reference Daga, Ribeiro Guevara and Arribére2016b), mineralogy (Amorph = amorphous, Pl = plagioclase, Qz = quartz, Px = pyroxene, Kln-Chl = kaolinite-chlorite, Zeo = zeolite, Mca = mica, Crs = cristobalite), and amorphous vs crystals components are shown.

The chronology was established using 137Cs radionuclide measurements, two accelerator mass spectrometry (AMS) radiocarbon dates on bulk sediments at 54 and 76 cm depth, and the known calendar age of a recent tephra layer (FU1, 0–1 cm, AD 2008) from an observed eruption; all this information was calibrated and integrated using OxCal 4.2 software (Bronk Ramsey, Reference Bronk Ramsey2009; Daga et al., Reference Daga, Ribeiro Guevara and Arribére2016b). For the model input, core depth was corrected by subtracting tephra layers >1 cm thick, which are assumed to have been instantaneously deposited. Due to absence of regional records for the identified tephras, their ages were obtained from the age-depth model (Daga et al., Reference Daga, Ribeiro Guevara and Arribére2016b).
Geochemistry
Elemental concentrations were determined at continuous 1-cm intervals (or 1.5-cm intervals for some tephras) by instrumental neutron activation analysis. Sediment samples of 100 mg were irradiated in the RA6 nuclear research reactor (Centro Atómico Bariloche, Argentina). The elements studied were the major elements Al, Ca, Fe, Mg, Mn, Na, K, and Ti; rare earth elements (REE) Ce, Dy, Eu, La, Lu, Nd, Sm, Tb, and Yb; and other trace elements such as As, Ba, Br, Cs, Co, Cr, Hf, Sb, Sc, Sr, Ta, Th, U, V, and Zn. Analytical errors differed for each element and sample analyzed, since they depend on nuclear parameters, on irradiation conditions, and on the composition of the sample, varying from 5% to 15% in most cases. Certified Reference Materials (CRM) NIST Buffalo River Sediment and IAEA SL1 Lake Sediment were analyzed together with the samples for analytical quality control. Loss on ignition (LOI) was determined in 0.5-g samples at 550°C for 4 hours according to Heiri et al. (Reference Heiri, Lotter and Lemcke2001). LOI550 is considered as an indicator of organic matter (OM) concentration following Smol (Reference Smol2008).
Stable isotopes
Freeze-dried sub-samples were analyzed for their isotopic composition of organic carbon (δ 13C) and nitrogen (δ 15N). A Europa 20-20 (Europa Scientific Ltd., Crewe, UK) continuous–flow stable isotope analyzer with ANCA SL preparation module for solid and liquid samples was used for the analysis at Jožef Stefan Institute, Slovenia (Daga et al., Reference Daga, Ribeiro Guevara, Pavlin, Rizzo, Lojen, Vreča, Horvat and Arribére2016a). To determine δ 13C in organic carbon, the sediments were treated with 1 M HCl at 50°C overnight to remove the carbonate fraction and were dried afterwards. The stable isotope composition of sedimentary nitrogen (δ 15N) was determined on untreated samples. Aliquots of samples with C or N content of 100–200 μg were sealed into tin capsules and combusted in an elemental analyzer. The gases produced were separated on a gas chromatograph column and introduced into the isotope ratio mass spectrometer. The results of the isotope ratio measurements are reported as relative δ values in terms of the deviation of the heavy-to-light isotope ratio of the sample from that of the reference material (Vienna PeeDee Belemnite for carbon and atmospheric N2 air for nitrogen) expressed in per mil (‰; Coplen, Reference Coplen2011). All measurements were performed in triplicate. The results were accepted if the standard deviation was less or equal to 0.2‰ for both C and N; if the deviation was larger, the measurements were repeated until the deviation was within the required limits. CRMs (IAEA–N–1, IAEA–N–2, IAEA–CH6, and IAEA–CH7) and in-house working standards (urea, sucrose, and ammonium sulphate) were used to calibrate the measurements and to control the accuracy of the results. The long-term precision of the measurements (0.2‰) was calculated from replicate analyses of laboratory standard materials distributed randomly among samples in each batch over six months. The measurements were processed using the United States Geological Survey Laboratory Information Management System for Light Stable Isotopes (7.12).
Mineralogy
Sub-samples were powdered in an agate mortar (<20 μm) and analyzed for bulk mineralogy by X-ray diffraction (XRD) with a PANalytical X-ray diffractometer operated at 30 mÅ and 40 kV at the Departamento Caracterización de Materiales (Centro Atómico Bariloche, Argentina), collecting data from 5° to 60° 2θ. Mineral identification was performed by matching peaks with patterns of internal reference materials. After identification, diffractograms were semi–quantified following Cook et al. (Reference Cook, Johnson, Matti, Zemmels, Hayes, Frakes, Barrett, Burns, Chen, Ford, Kaneps, Kemp, McCollum, Piper, Wall and Webb1975) for minerals, and Bertrand and Fagel (Reference Bertrand and Fagel2008) for amorphous material. As the amorphous phases are the main constituent of these samples, a detailed characterization was performed on nine samples along the core; the samples were selected according to OM and element variations. Discrimination and quantification of inorganic (volcanic glass and allophane) and biogenic (diatoms) amorphous silica was achieved by describing and counting 600 grains per sample under a petrographic microscope in loose grain thin sections. The amorphous diatom silica counting was done following Crosta and Koç (Reference Crosta, Koç, Hilaire-Marcel and De Vernal2007). Scanning electron microscope (SEM, Departamento Caracterización de Materiales, Centro Atómico Bariloche, Argentina) and transmission electron microscope (TEM, División Física de Metales, Centro Atómico Bariloche, Argentina) images were also obtained for the characterization of these phases. Allophane presence was determined by infrared (IR) spectroscopy on <2 μm fraction (FT-IR Lumex FT08) and chemically by the NaF test (Fieldes and Perrott, Reference Fieldes and Perrot1966).
RESULTS
Chronology
The age-depth model was previously obtained by integrating 137Cs and 14C measurements and a known tephra layer using OxCal 4.2 software (Bronk Ramsey, Reference Bronk Ramsey2009), inferring a rather constant sedimentation rate since ~AD 400 (see Fig. 2; Daga et al., Reference Daga, Ribeiro Guevara and Arribére2016b). For the model input, tephra layers >1 cm thick were removed from the total core depth due to the instantaneous deposition. Results show accumulation rates of 30.2 ± 3.5 mg cm-2 yr-1 for the upper 7–0-cm section dated by 137Cs, and 30.8 ± 4.2 mg cm-2 yr-1 for deeper layers (76–54-cm section) dated by AMS 14C (more detail in Daga et al., Reference Daga, Ribeiro Guevara and Arribére2016b). While median dating densities in the literature are below 1 date per millennium (dpm) (Blaauw et al., Reference Blaauw, Christen, Bennett and Reimer2018), the dating control of our record with 1.3 dpm is above average. Age-depth models of reasonable confidence can be generated with median dating densities greater than 1 dpm (including also 137Cs, 210Pb, and tephrochronology) and using Bayesian methods (Blaauw et al., Reference Blaauw, Christen, Bennett and Reimer2018). From the model, ages with a probability distribution for the identified tephra were obtained, corresponding to volcanic events at AD 1530 ± 55 (FU29, 24–29 cm), AD 1695 ± 50 (FU18, 16.5–18 cm), AD 1775 ± 40 (FU13, 12.7–13 cm), and AD 1915 ± 25 (FU7, 6–7 cm); these tephras correspond to distal deposits of poorly known events and no dates are available from other regional records (Daga et al., Reference Daga, Ribeiro Guevara and Arribére2016b).
Lithology and physical properties
The sedimentary sequence consists mainly of homogeneous to laminated brownish gray siliciclastic, carbonate-free sediment with intercalated tephra layers (see Fig. 2). The core was subdivided in two zones: deeper zone 1 (Z1, 79–30 cm; AD ~400–1500) and surface zone 2 (Z2, 30–0 cm; AD ~1500 to present) characterized by differences in lithology (Figs. 2–4). The lower part of the sequence, Z1, is composed of silty clay sediment with regular intercalations of greenish and black laminations that varied between defined millimeter-thick layers (very clear around 60–55 cm depth; AD ~800–920) and more diffuse >1-cm-thick layers that faded and disappeared upwards (see Fig. 2). The upper part of the core, Z2, consists of brownish silty clay sediment characterized by the presence of five intercalated macroscopic tephra layers and by decreasing dry density (DD) and increasing water content and OM upwards (see Figs. 2, 3; Daga et al., Reference Daga, Ribeiro Guevara and Arribére2016b). Bulk mineralogical composition is composed of amorphous material (43–58%), plagioclase (15–30%), quartz (7–12%), pyroxene (3–8%), kaolinite/chlorite (6–11%), mica (1–3%), and zeolite (1–3%) (see Fig. 2). Main variations are associated to tephra layers with variability according to tephra composition (Daga et al., Reference Daga, Ribeiro Guevara and Arribére2016b), generally increasing the amorphous material (47–82%), plagioclase (3–42%), and pyroxene (0–11%); crystobalite appears in the upper tephra (see Fig. 2, Supplementary Fig. S1).
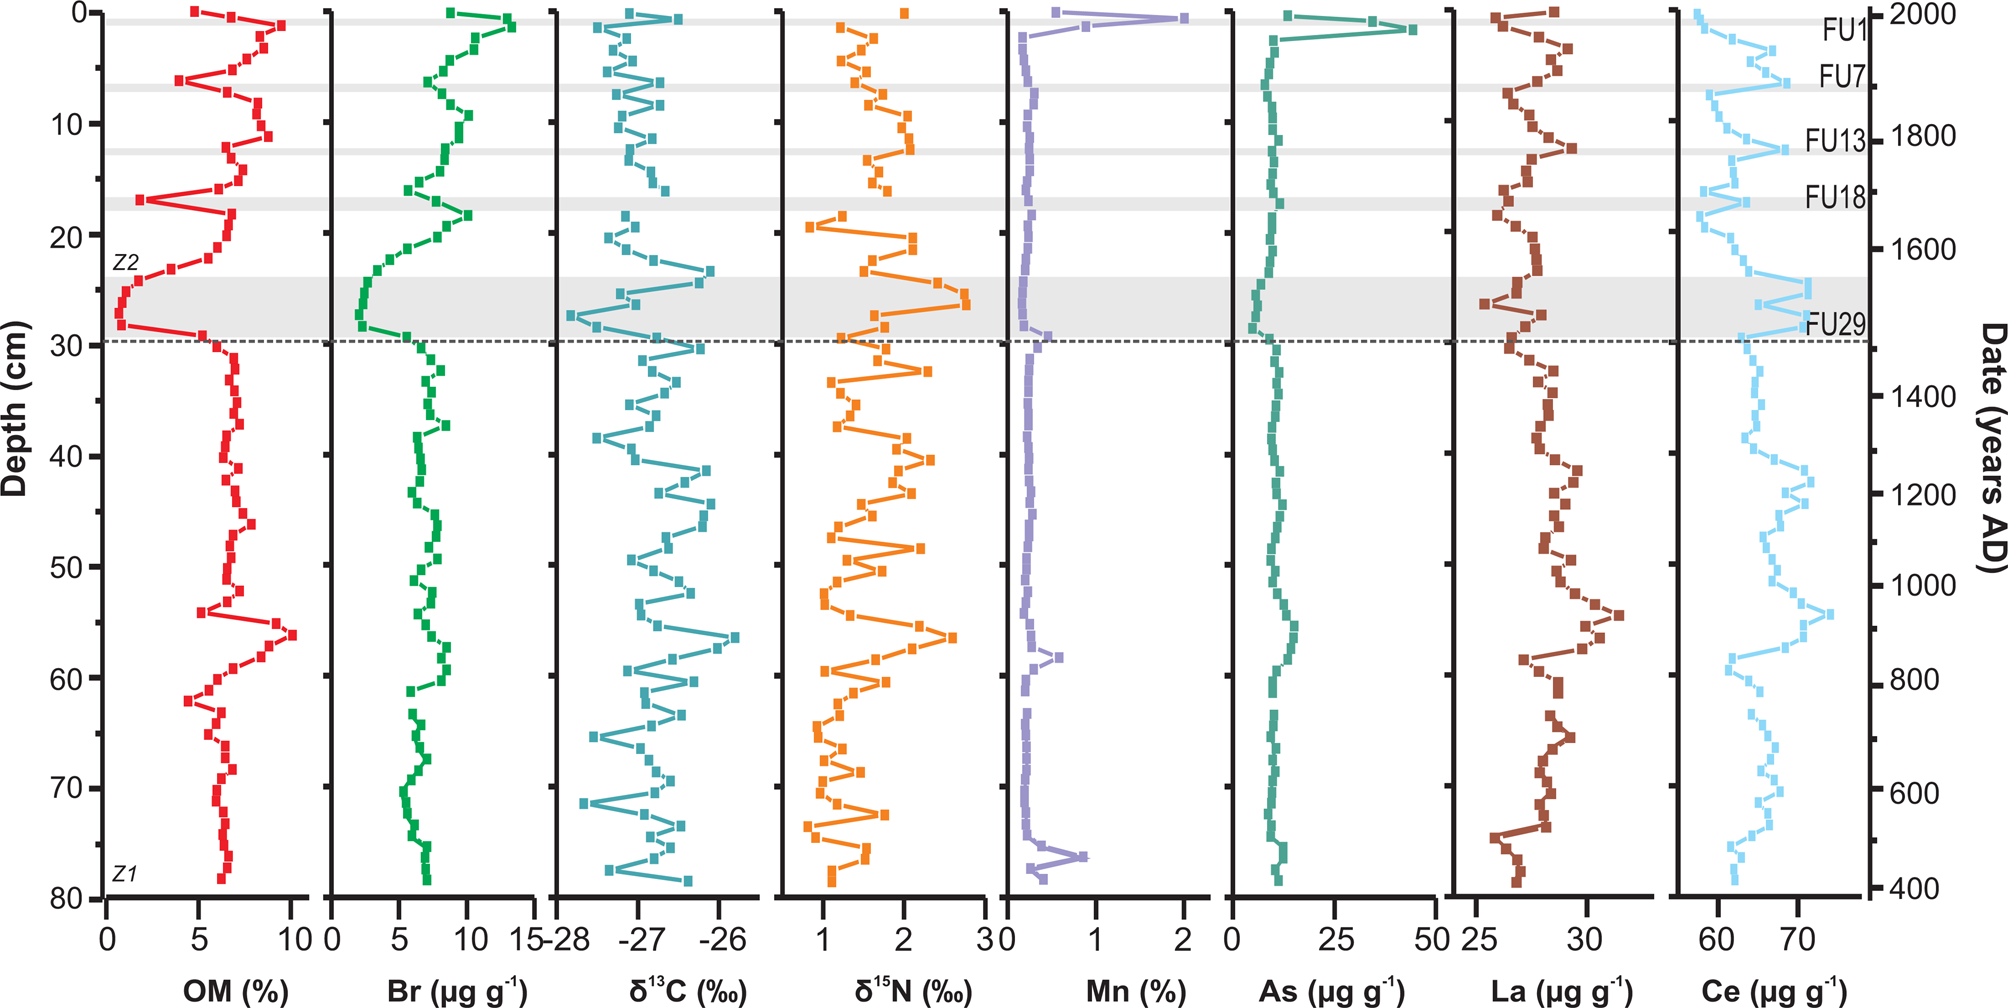
(color online) Elemental profiles from Lake Futalaufquen vs. depth (left) and age (right). Lithological Zones 1 (Z1) and 2 (Z2) are shown. OM = organic matter, δ 13C values and Mn concentrations are modified from Daga et al. (Reference Daga, Ribeiro Guevara, Pavlin, Rizzo, Lojen, Vreča, Horvat and Arribére2016a, Reference Daga, Ribeiro Guevara and Arribére2016b). Horizontal gray lines represent tephra layers.

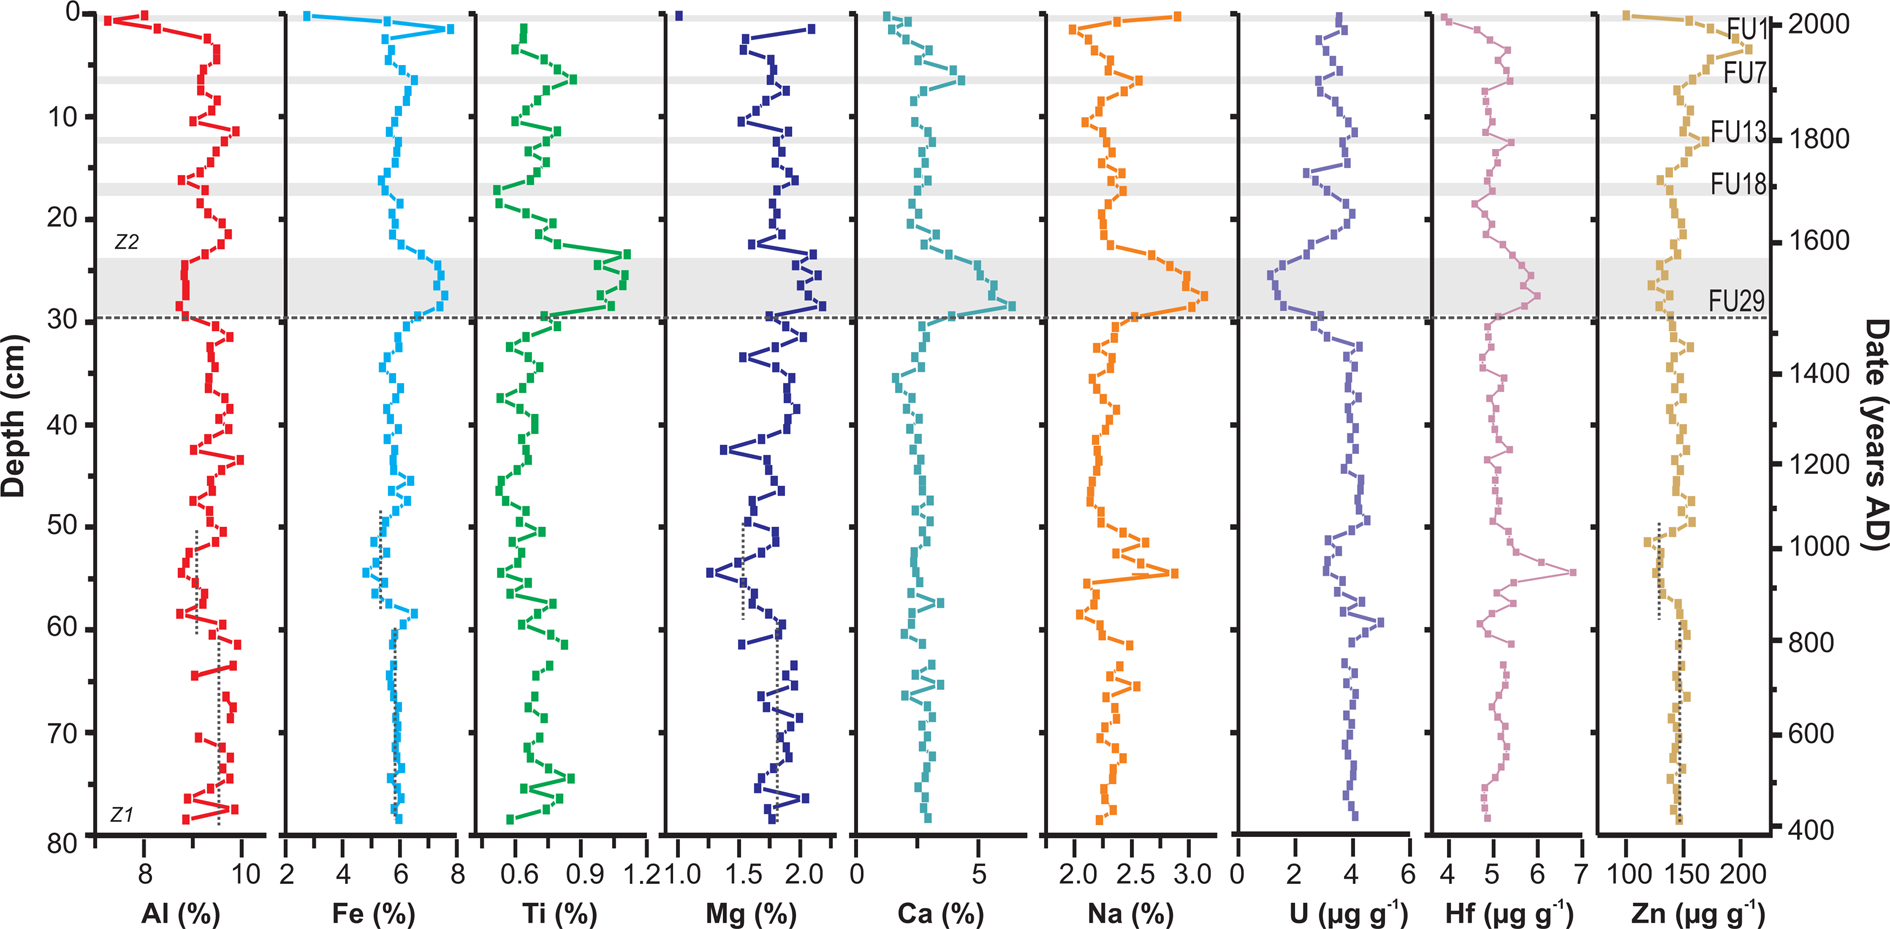
(color online) Elemental profiles from Lake Futalaufquen vs. depth (left) and age (right). Lithological Zones 1 (Z1) and 2 (Z2) are shown. Aluminium and Fe concentrations are modified from Daga et al. (Reference Daga, Ribeiro Guevara, Pavlin, Rizzo, Lojen, Vreča, Horvat and Arribére2016a). Horizontal gray lines represent tephra layers; vertical dotted lines in Al, Fe, Mg, and Zn represent mean concentration for the period (see text).

Amorphous material dominates the mineralogy along the profile, with presence of both organic and inorganic components with variable proportions along the core (see Fig. 2, Supplementary Fig. S3). The organic amorphous phase is composed essentially of diatoms (40–69%) in a wide range of sizes (5–130 μm) (see Supplementary Fig. S3). The inorganic phase consists mainly of volcanic glass (cuspate, platy, and pumice glass shards with minor amounts of palagonite) (30–60%; see Supplementary Fig. S3). Additionally, aggregates with globular morphology formed by clay-size particles with isotropic behavior were observed and identified as allophane according to Bertrand and Fagel (Reference Bertrand and Fagel2008) (see Supplementary Fig. S3). Clay fraction analysis through IR spectroscopy confirmed the presence of this poorly crystalline phase. The IR spectra display two broad absorption bands at 3450 and 1000 cm-1 and a weaker band at 1630 cm−1, which is typical for allophane (Gustafsson et al., Reference Gustafsson, Bhattacharya and Karltun1999). In addition, the pH NaF values of the samples are >9.4, indicating the allophanic nature of this fraction (Burt, Reference Burt2004).
Geochemistry
In Z1 (AD ~400–1500) the elemental contents show limited variations, with the exception of the segment around 60–50 cm depth (AD ~800–1050), where anomalies of different intensity are observed in almost all elements (see Figs. 3, 4); thus, the description is focused on the 60–50-cm depth segment in relation to below/above. With relative homogeneity from the base of the sequence, OM content doubles between 60 and 56 cm depth (~5.5–10%; AD ~800 to ~900), then sharply decreases to previous contents at 51 cm (~6.5%; AD ~1000), and remains constant up to 30 cm depth. At 56 cm depth, the OM content is 10%, which is the maximum value reached throughout the core (see Fig. 3). Both δ 13C and δ 15N values closely follow the OM variation and reach maximum values at 60–51 cm depth (see Fig. 3). The light REEs also show a clear increase-decrease with the maximum at 56 cm depth, and they vary with OM (see Fig. 3). By contrast, mean concentrations of elements such as Al, Fe, Ti, Mg, U, and Zn decrease slightly (above the corresponding error of each element) from 79–60 cm to 58–52 cm (e.g., Al: 9.52 to 8.97 wt. %; Fe: 5.84 to 5.28 wt. %; Mg: 1.83 to 1.57 wt. %; Zn: 137 to 124 μg g-1; see Fig. 4). Most of these elements recover to previous concentrations around 50 cm depth (AD ~1050) and then are relatively stable up to the top of the zone (see Fig. 4). Superimposed is a sharp decrease in OM at 54 cm depth, together with a small peak in DD and sharp peaks for the elements K, Ba, Cr, V (not shown), Na, Hf, and REE (light REE La and Ce have a superimposed peak for the previous increment; see Figs. 3, 4). Elements Mn and As (in some cases accompanied by Fe) show different variations. The stable and low concentrations of Mn (0.236 ± 0.037 wt. %) is interrupted by clear peaks at 77 cm depth (AD ~450) from 0.260 to 0.843 wt. % (together with a minor increase in As), and at 58 cm (AD ~800) from 0.211 to 0.578 wt. % (with minor peaks of As and Fe; see Figs. 3, 4). Both peaks (at 77 and 58 cm depth) are associated with greenish sediment layers.
In Z2 (AD ~1500 to present) the main geochemical differences relate to tephras, generating variations in element contents depending on tephra composition (Daga et al., Reference Daga, Ribeiro Guevara and Arribére2016b). However, all parameters show a fast recovery after each tephra layer (see Fig. 2). As allochthonous layers, tephra data are removed for the analysis of environmental variations. Accordingly, OM shows an increasing trend from 30 to 0 cm, while δ 13C and δ 15N values decrease upwards (−26.1 to −27.8‰ and 2.5 to 0.9‰, respectively; see Fig. 3) without significant correlation. While DD shifts to lower values from 30 cm to the core top, showing the compression processes from sediment overload, terrigenous indicators (e.g., Al, Fe, Ti, Mg, K, and V) remain relatively stable (see Figs. 2–4). Mn peaks in this zone are located at the base of coarser tephras. On the other hand, the Zn profile shows a different trend from any other element during the last centuries (see Fig. 4), with increasing contents from 18 cm depth (beginning of the eighteenth century). This rise shows a steeper slope upwards from 8 cm (AD ~1910), reaching a maximum at 4 cm depth around AD 1980, and decreasing quickly afterwards (even without considering the strong decrease caused by the FU1 tephra deposition).
DISCUSSION
Lake Futalaufquen sediments
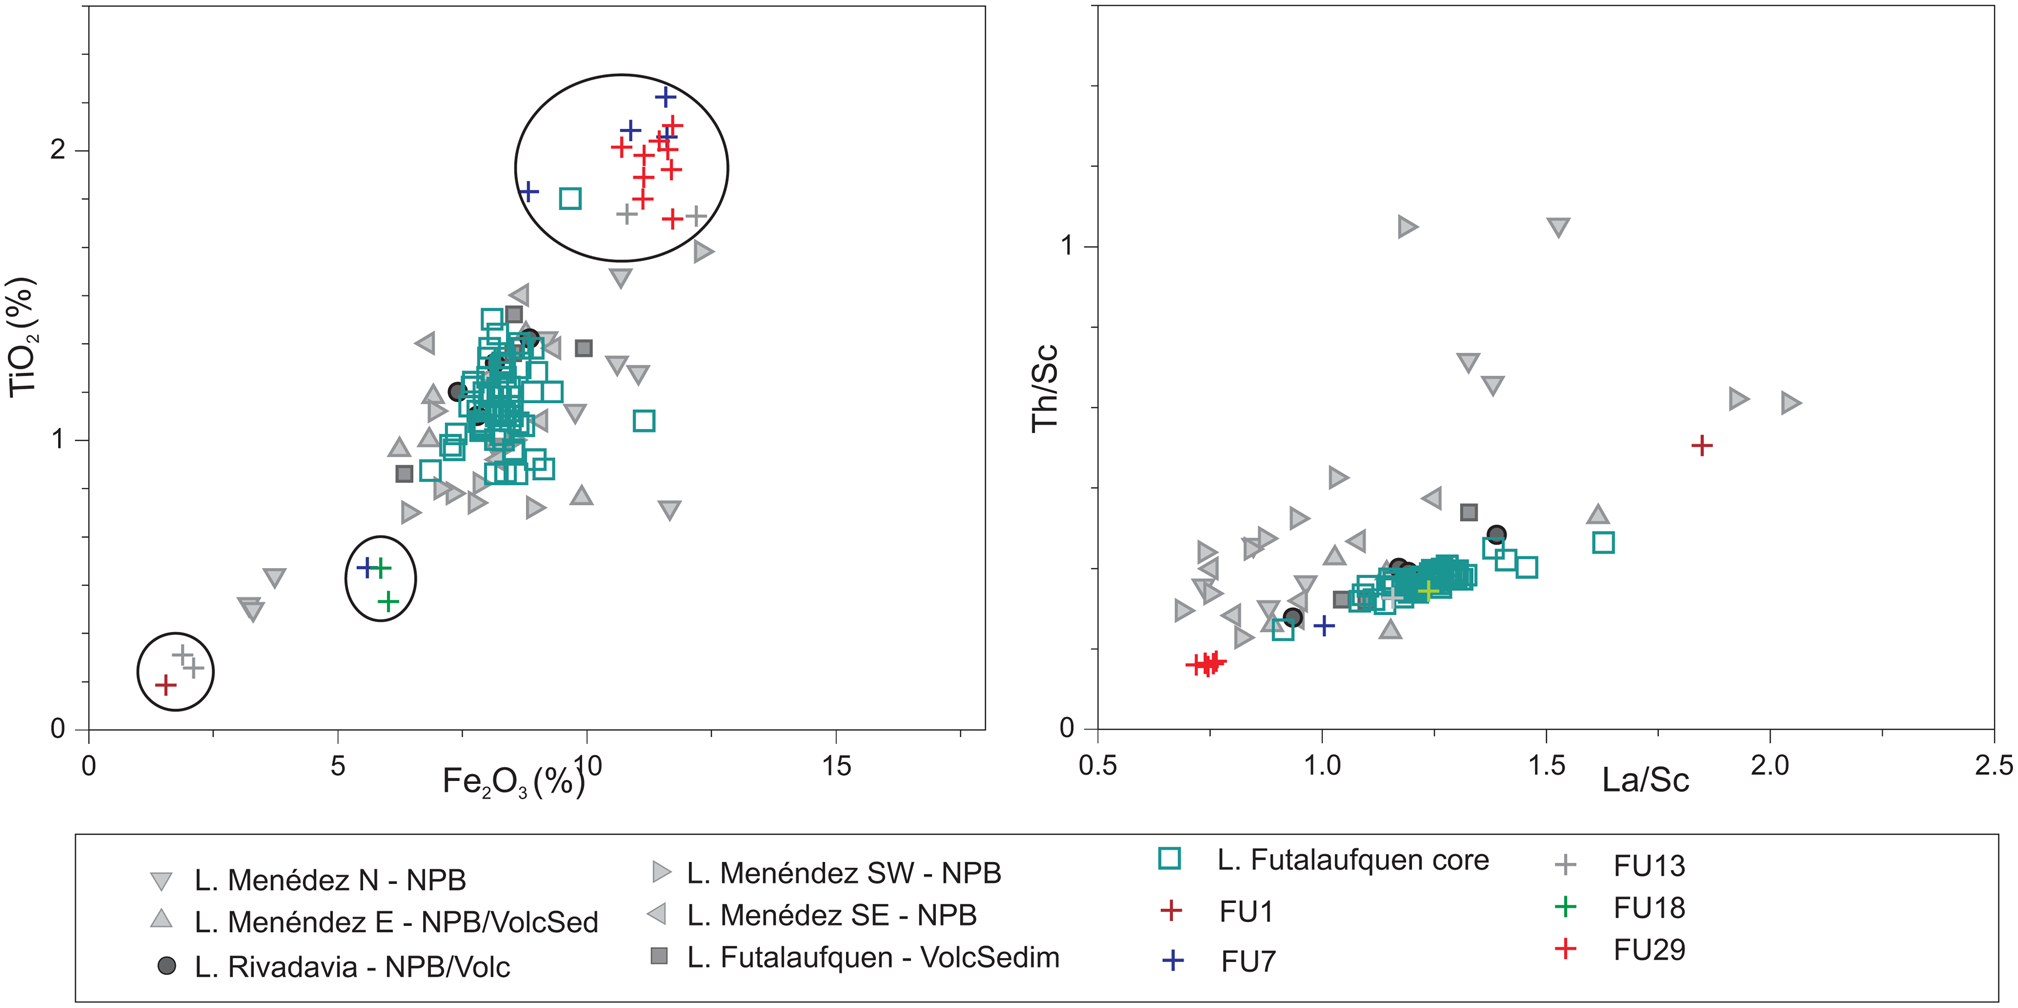
The sedimentary sequence of Lake Futalaufquen shows a relatively homogeneous composition during the last 1600 years, with the main geochemical and mineralogical changes corresponding to tephra layers (see Figs. 2 to 4). The geochemical composition of the lake sediment reflects the geological composition of the catchment, particularly in oligotrophic systems (Boyle, Reference Boyle, Last and Smol2001). Figure 5 shows the correlation between Ti/Fe, as well as Th/Sc and La/Sc for lake sediments and for sediments from different water courses upstream of Lake Futalaufquen (Ferpozzi et al., Reference Ferpozzi, Viera, Butrón Ascona, Anielli, Jones, Casa and Jara2004; also studied for other elements such as Mg, Na, Ca, Ba, Br, Hf, Nd, Sm, and Lu [not shown]). Major and trace elements are comparable between the sediment core from Lake Futalaufquen and stream sediments from the catchment areas of lakes Futalaufquen and Rivadavia, and from streams on the eastern branch of Lake Menéndez, reflecting main source lithologies (see Fig. 5). The differences in geochemistry with other Lake Menéndez branches reflect the variability in catchment lithology (see Fig. 1) and indicate a relatively short transport of sediments arriving to the lake. Samples scattered from the main group in the bivariate graphs correspond to tephra layers (see Fig. 5; Daga et al., Reference Daga, Ribeiro Guevara and Arribére2016b).
(color online) Bivariate graphs showing a comparison of Lake Futalaufquen sediment composition and stream sediments from the watershed (geochemical data from Ferpozzi et al., Reference Ferpozzi, Viera, Butrón Ascona, Anielli, Jones, Casa and Jara2004) close to the coring site. Circled samples correspond to the tephra layers (Daga et al., Reference Daga, Ribeiro Guevara and Arribére2016b). For location of references see Figure 1. NPB = North Patagonian Batholith; VolcSed = volcanic and volcanosedimentary rocks; Volc = volcanic rocks.

The mineralogy of the sequence, on the other hand, is dominated by amorphous material and plagioclase with minor pyroxene, quartz, and clay minerals. The amorphous fraction of the sediment represents the sum of detrital (volcanic glass and allophones) and biogenic (mainly diatoms) material. The varieties of amorphous materials described are typical of lakes in volcanic settings, like Lake Futalaufquen. Allophanes (amorphous clays first formed by hydrolysis of volcanic glass [Henmi and Wada, Reference Henmi and Wada1976]) are mainly sourced from regional volcanic soils of this area (La Manna, Reference La Manna2005). Otherwise, diatoms are the dominant planktonic group identified in Lake Futalaufquen (Pizzolon et al., Reference Pizzolón, Santinelli, Marinone and Menu-Marque1995), a common feature in lakes of volcanic environments where the Si input is high (Rawlence, Reference Rawlence1984; Bertrand et al., Reference Bertrand, Boës, Castiaux, Francois, Urrutia, Espinoza, Lepoint, Charlier and Fagel2005). The total mineralogy reflects the origins of the sediments both from volcanic soils covering the region as well as from granitoids and volcano-sedimentary rocks that constitute the catchment lithology (Lizuain, Reference Lizuain1999). Similar mineralogical compositions were obtained in lake sequences extracted from lakes in north-central Chile; their origins were attributed mainly to andosol outcrops in the catchment areas (Bertrand et al., Reference Bertrand, Boës, Castiaux, Francois, Urrutia, Espinoza, Lepoint, Charlier and Fagel2005; Bertrand and Fagel, Reference Bertrand and Fagel2008).
The correlation between the element contents is the result of proximity of the sediment collection sites (used for comparison) to the core extraction point (<10 km). Thus, the material reaching the lake bottom has only a short transportation pathway. This behavior seems to be the same throughout the sequence (except for tephra layers; see Fig. 5), which is supported by a rather homogenous mineralogical composition vs depth (see Fig. 2). Although small mineralogical changes due to chemical weathering would not be evident in the bulk mineralogical composition, the same mineral assemblage reflects limited chemical weathering along a core, mainly associated with cold climatic conditions in the region, the regional lithology, and recent deglaciation of the region (Paruelo et al., Reference Paruelo, Beltrán, Jobbágy, Sala and Golluscio1998; Bertrand et al., Reference Bertrand, Hughen, Sepúlveda and Pantoja2012).
Integration of organic and inorganic records: paleoenvironmental inferences
Period AD ~400–1500 (79–30 cm depth)
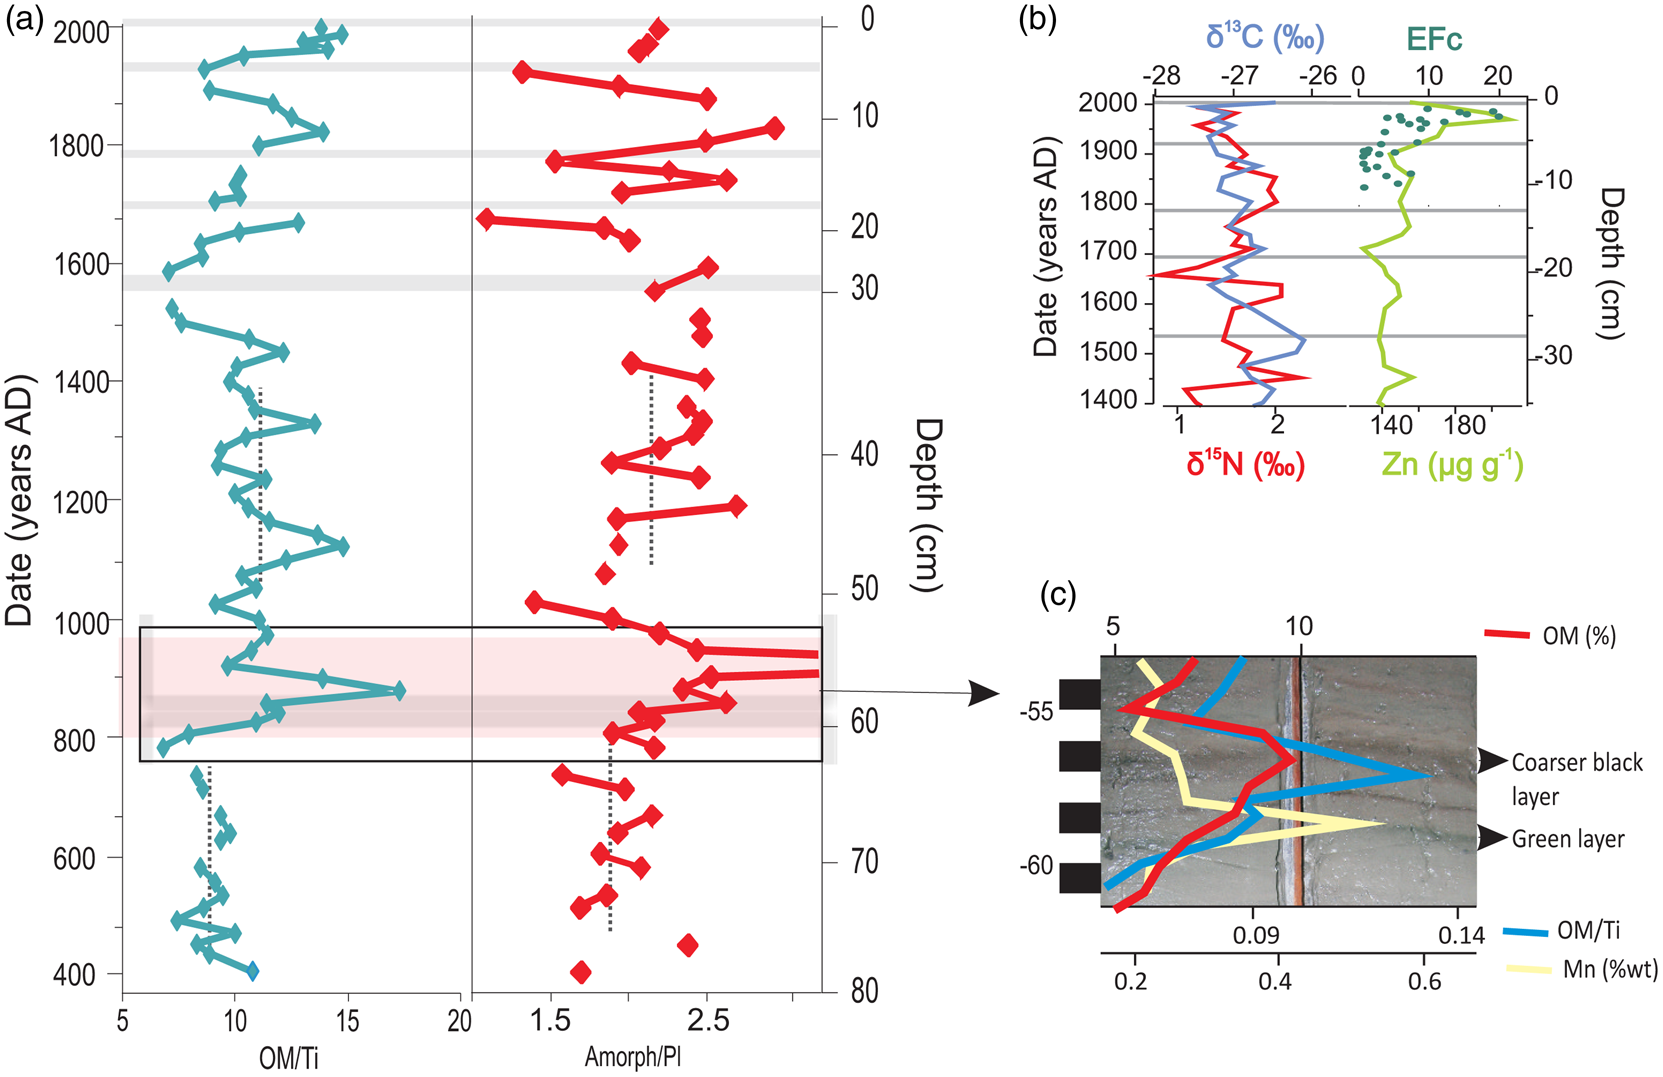
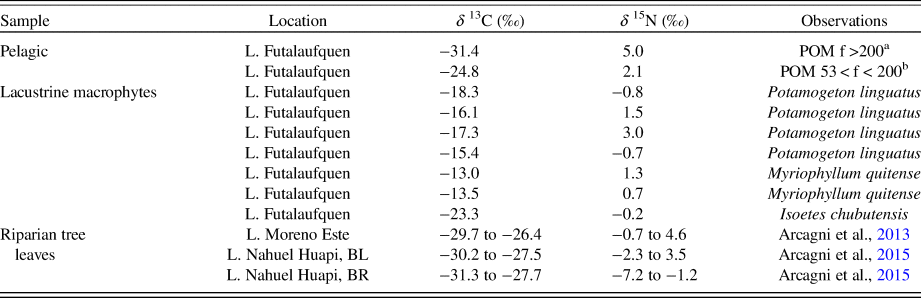
The most remarkable feature in this section corresponds to AD ~800–1000 (~60–52 cm), defined in the core by distinct black and green laminations that disappear upwards, emphasized in the AD ~880–900 section (see Figs. 1, 6). The rather uniform OM levels in the rest of the core increase between 60 and 50 cm, together with δ 13C and δ 15N values (see Fig. 3). Phytoplankton preferentially uses 12C to produce OM, increasing the δ 13C values of the remaining inorganic carbon; increased productivity therefore yields an increase in the δ 13C values of newly produced lacustrine OM buried in the sediment (Meyers and Lallier–Vergès, Reference Meyers and Lallier-Verges1999; Meyers and Teranes, Reference Meyers, Teranes, Last and Smol2001; Meyers, Reference Meyers2003). The biogeochemical cycling of nitrogen is more complex; however, δ 15N values complement the interpretation of δ 13C (Meyers and Teranes, Reference Meyers, Teranes, Last and Smol2001). Similar ranges of δ 15N values were observed for nitrogen sources like modern plankton (2.1–5.0‰, Table 1) and lacustrine macrophytes (−0.8 to 3.0‰, see Table 1) of Lake Futalaufquen. An increase of δ 15N values could be explained by nitrogen consumption via bacterial degradation during sedimentation (Botrel et al., Reference Botrel, Gregory-Eaves and Maranger2014). Higher δ 13C and δ 15N values are generally associated with increasing productivity (Gu, Reference Gu2009; Torres et al., Reference Torres, Inglett, Brenner, Kenney and Reddy2012), like the trend observed for Lake Futalaufquen during the period AD 800–900.
(color online) (a) Organic matter/Ti (OM/Ti) and amorphous/plagioclase (Amorph/Pl) ratios vs. depth. In the Amorph/Pl profile the peak at 54 cm depth was cut off due to such high value corresponds to the effect of a microtephra with high volcanic glass regarding plagioclase, in agreement with a clear decrease in the OM/Ti ratio; as the cause of the peak is not the increase in productivity, this point is not considered in the increasing tendency of the ratio. Bottom right is the view of the 55–60 cm depth section showing the greenish and black layering with the detail of Mn, OM, and OM/Ti variation; (b) raw values of δ 13C, δ 15N, and Zn compared with EFc from Antarctica (modified from Planchon et al., Reference Planchon, Boutron, Barbante, Cozzi, Gaspari, Wolff, Ferrari and Cescon2002); tephra layers are excluded.

Stable isotope ratios of carbon (δ 13C) and nitrogen (δ 15N) for pelagic (POM: particulate organic matter) and lacustrine macrophytes from Lake Futalaufquen and ranges from riparian tree leaves from lakes Moreno Este (Austrocedrus chilensis, Chusquea culeou, Crinodendron patagua, Lomatia hirsuta, Luma apiculata, and Nothofagus chilensis; Arcagni et al., Reference Arcagni, Campbell, Arribére, Kyser, Klassen, Casaux, Miserendino and Ribeiro Guevara2013) and Nahuel Huapi (N.dombeyi, N. antarctica, Weinmannia trichosperma, Lomatia hirsuta, Luma apiculata, A. chilensis, Maytenus boaria, and Amomyrtus luma; Arcagni et al., Reference Arcagni, Rizzo, Campbell, Arribére, Juncos, Reissig, Kyser, Barriga, Battini and Ribeiro Guevara2015).

a Zooplankton: Fifteen species were recorded: 3 cladocerans, 4 copepods, and 8 rotifers. Boeckella michaelseni (Copepoda: Calanoidea) was dominant in density and biomass. Cladocerans and rotifers were in lower proportion (Pizzolón et al., Reference Pizzolón, Santinelli, Marinone and Menu-Marque1995).
b Phytoplankton: the 5 (of 36) most frequent species in L. Futalaufquen northern basin are Synedra nana (30.8%), Asterionella formosa (8.4%), Sphaerocystis schroeteri (7.9%), Rhizosolenia eriensis (7.5%), and Rhodomonas lacustris (5.8%); diatoms was the dominant phytoplanktonic group (Pizzolón et al., Reference Pizzolón, Santinelli, Marinone and Menu-Marque1995).
However, this is not the only possibility for an increase in the δ 13C values. Modern isotopic fingerprints of lacustrine macrophytes from Lake Futalaufquen show higher δ 13C values (−23.3‰ to −13.0‰, see Table 1) in comparison to pelagic contributions from Lake Futalaufquen (−31.4 to −24.8‰, see Table 1) or terrestrial plants analysed in Nahuel Huapi National Park, 200 km north of LANP (−31.3 to −26.4‰, see Table 1; Arcagni et al., Reference Arcagni, Campbell, Arribére, Kyser, Klassen, Casaux, Miserendino and Ribeiro Guevara2013, 2015). Detritus from littoral macrophytes can reach the lake bottom, shifting δ 13C to higher values (Liu et al., Reference Liu, Li, An, Xu and Zhang2013). Moreover, previous research showed a decrease in the Br/OM ratios from 1.4 to 0.7 in sedimentary sequences from different Patagonian lakes associated with increasing littoral macrophytes in sedimentary OM (Br is associated with OM in different concentrations depending on the OM source to lake sediments, e.g., pelagic OM vs macrophytes); Br/OM ratios in the period AD ~800–900 decreased from 1.2–1.3 to 0.73–0.75 in Lake Futalaufquen (Ribeiro Guevara et al., Reference Ribeiro Guevara, Rizzo, Daga, Williams and Villa2019). Consequently, the increase in the δ 13C values in the sequence may reflect (i) the increase in algal production in the lake, but also (ii) a change in the proportion of OM caused by input of detritus from littoral macrophytes.
Geogenic elements exhibit a slight opposite trend with respect to OM and δ 13C and δ 15N values. At around AD 800, Al, Fe, Ti, and Mg concentrations decrease, partially recovering to previous levels at AD 1020–1050. The increase in OM concentration could represent a real increase in OM inputs to the lake diluting the clastic signal, or a decrease in clastic mineral inputs enhancing the OM concentration. If only an increase in OM is considered, the expected decrease in geogenic elements by dilution is not consistent with the concentrations measured; an increase between 15% and 30% of OM would be necessary to dilute Al, Fe, and Ti to the measured concentrations in the sediment. In natural systems different processes interact, and it is reasonable to consider the combination of increasing OM with a decrease in clastic flux to the lake.
The trend starting around AD 800 is better visualized with a parameter that relates a biological indicator with a terrigenous element, like the ratio between OM and Ti (OM/Ti, see Fig. 6a). This ratio attempts to isolate the OM variability from clastic input, amplifying slight variations of individual parameters against short-term background fluctuations. Besides the variations in the AD 800–1050 period, the OM/Ti ratio shows different average values before AD ~800 (8.87) and after AD ~1020 (11.12), reflecting that pre-AD ~800 conditions have not been totally recovered after AD ~1020 (see Fig. 6). Particularly, the decrease at AD ~920 was associated with a steep OM decrease, possibly due to a microtephra, evidenced by an increase in DD, variation of element concentrations, and increase in amorphous fraction (see Fig. 2), corroborated with the observation of high abundance of volcanic particles in the sediment.
Turning to the mineralogic evidence, the ratio of the amorphous fraction with plagioclase of detrital origin (Amorph/Pl ratio) could be considered an indicator of the relative contribution of biogenic material to detrital silicate minerals, mainly reflecting the contribution from diatoms. Although the Amorph/Pl ratio shows short-term variability, an increasing trend from AD 800 to AD 900, in comparison to pre-AD 800 values, is observed (see Fig. 6a). After AD 900, the Amorph/Pl ratio decreases and does not return totally to the pre-AD 800 conditions; instead, it continues with short-term variability upwards. This is consistent with the quantification of inorganic and organic amorphous phases, with an increase in diatoms from AD 800, which reach a maximum value around AD 900, and which is only equalled in the uppermost samples (see Fig. 2). Therefore, the Amorph/Pl ratio at this section of the profile complements other evidence (OM, δ 13C and δ 15N values, OM/Ti) indicating a change in lake productivity around AD 800–900.
Mn and Fe increments at AD ~800 coincide with a greenish layer in the core (59 cm), possibly indicating a paleo-redox horizon due to higher oxygen consumption by OM decomposition (see Fig. 6a). In addition, at AD ~800 the REEs, mainly the light REEs La and Ce, increase following the OM (see Fig. 3). The low oxygen conditions that generate the dissolution/re-precipitation of Mn-Fe compounds can liberate REEs that show affinity to organic compounds (Haley et al., Reference Haley, Klinkhammer and McManus2004; Freslon et al., Reference Freslon, Bayon, Toucanne, Bermell, Bollinger, Chéron and Etoubleau2014). These organic compounds are considered as important REE scavenging phases in aquatic environments, more than Fe-oxyhydroxides (Caetano et al., Reference Caetano, Prego, Vale, de Pablo and Marmolejo–Rodríguez2009; Freslon et al., Reference Freslon, Bayon, Toucanne, Bermell, Bollinger, Chéron and Etoubleau2014). After the maximum at AD ~900, OM decreases, and so do La and Ce. However, La and Ce display a new short-term rise when OM dropped quickly in the mid-tenth century, where a microtephra is defined.
The increases in δ 13C and δ 15N values, Amorph/Pl ratio, and organic amorphous material (diatoms), reflect an increase in algal production (an increase in algal OM), inferring increased lacustrine productivity that may have been generated during a warmer period (Meyers and Lallier–Vergès, Reference Meyers and Lallier-Verges1999), with a maximum expression around AD 900. On the other hand, the increase of δ 13C and δ 15N values could also be related to an increasing proportion of littoral macrophyte detritus vs phytoplankton that could be indicating variations of the lake level and an increase of littoral zones (Liu et al., Reference Liu, Li, An, Xu and Zhang2013; Woszczyk et al., Reference Woszczyk, Grassineau, Tylmann, Kowalewski, Lutynska and Bechtel2014). Due to the complex morphometry of the lake, small changes in water level could affect the littoral perimeter, thereby increasing the incidence of littoral macrophytes in comparison with pelagic contributions, compatible with the increase of δ 13C values measured (Mayr et al., Reference Mayr, Fey, Haberzettl, Janssen, Lucke, Maidana and Ohlendorf2005). The possibility of an increasing littoral zone associated with variations in lake level could be generated by less precipitation, which may also be associated with warmer conditions. Consistent with this, the decrease in the concentration of terrigenous elements (e.g., Al, Fe, Ti, Mg, K, and V) can be associated with a decline in erosion processes due to lower precipitation. Although some independent (geochemical and mineralogical) proposed proxies showed correspondence in the results, their utility and potential should be confirmed by extra information, for example, from C/N ratios or biogenic silica, to reduce the possibilities in the interpretation.
Below-average precipitation and above-average temperatures were identified on tree rings from northern Patagonia pre AD ~900 followed by a cold-moist interval (Villalba et al., Reference Villalba, Leiva, Rubulls, Suarez and Lenzano1990; Villalba, Reference Villalba1994) that is partially consistent with the previous interpretation. After the maximum around AD 880–900, the parameters do not recover completely to those pre-AD 800; this is evidence of less humid/more productive conditions than in the pre–AD ~800 period, conditions that remained relatively stable until AD ~1500.
Period AD ~1500–present (30–0 cm depth)
This segment is characterized by the presence of five tephra layers. Parameters DD and OM show an inflection point from 30 cm depth to the top (see Figs. 2, 3), with rapid recovery after each tephra layer. In contrast to DD and OM, the narrow variation range of most parameters (excluding tephra layers), similar to those values of the AD ~1000–1500 period, reflects relative stability of the conditions controlling sedimentation. The frequency of tephra deposition could cause changes to the lake and catchment (Telford et al., Reference Telford, Barker, Metcalfe and Newton2004; Ayris and Delmelle, Reference Ayris and Delmelle2012), hiding minor climatic changes. Despite this, a general fast recovery of physical and chemical parameters is verified after tephra layers in the sequence.
In contrast to the previous period where δ 13C and δ 15N values accompanied OM variations, these isotopes show different trends during the last five centuries (see Fig. 3, Supplementary Fig. S2). This behavior was not significantly affected by tephra deposition, which was consistently low in OM but without relevant variations in δ 13C and δ 15N values (see Fig. 3). Only after the deposition of a thick tephra layer (FU29) do decreases in δ 13C and increases in δ 15N values (see Figs. 3, 6b) indicate that the eruption affected the system. This tephra layer marked a noticeable decrease in OM content, due to the input of high amounts of inorganic material accumulating at the bottom of the lake in a short period of time altering the normal sedimentation pattern. The lowest δ 13C values could show dilution effects as the sedimentation rate changed (Mayr et al., Reference Mayr, Lucke, Fey, Maidana, Wille, Haberzettl and Corbella2009). On the other hand, the high δ 15N values might be reflecting a more intense denitrification due to decreased oxygen caused by the sealing of the sediment–water interface (Hadas et al., Reference Hadas, Altabet and Agnihotri2009). The younger eruptions were not intense enough to have the same effect. This indicates that volcanic activity results in dilution of sedimentary OM with pyroclastic material but does not cause a significant change in productivity or deposition of terrestrial OM. By removing the tephra layers from the sedimentary record, a sediment column enriched in OM in the upper 30–0 cm with respect to the lower layers is visible.
Effects of tephra deposition on carbon and nitrogen isotope values and then, on productivity, seem to be variable, or scarcely analyzed, in studies from other Patagonian lakes. It is possible to find low isotope variation with tephra layers (Haberzettl et al., Reference Haberzettl, Kück, Wulf, Anselmeti, Ariztegui, Corbella and Fey2008), lower δ 13C values after some (but not all) tephra deposits associated with a decrease in lake productivity (Bertrand et al., Reference Bertrand, Sterken, Vargas-Ramirez, De Batist, Vyverman, Lepoint and Fagel2010), and variable responses in close environments. As an example, in one small lake studied on southernmost Patagonia, δ 15N values were 2.1‰ lower in tephra deposits than in normal sediment (with no variation in δ 13C values), which is explained by higher turbidity during volcanic activity that restricted nitrogen assimilation in the ecosystem; in another nearby small lake, such δ 15N variation was not observed (Mayr et al., Reference Mayr, Smith, García, Massaferro, Lücke, Dubois and Maidana2019).
The decrease of OM concentration with depth is accompanied by increasing δ 13C and δ 15N values, consistent with early diagenesis of organic material (Freudenthal et al., Reference Freudenthal, Wagner, Wenzhöfer, Zabel and Wefer2001; Brahney et al., Reference Brahney, Ballantyne, Turner, Spalding, Out and Neff2014, and references therein). The observed variability of δ 13C and δ 15N values is rather narrow (<2‰); however, it has been shown that effects from diagenetic processes can be even lower (~1‰) without affecting the variability caused by the paleolimnological changes commonly observed in the sediments (Freudenthal et al., Reference Freudenthal, Wagner, Wenzhöfer, Zabel and Wefer2001). An increase of plankton in relation to littoral macrophyte detritus (see Table 1) could also generate the shift to more negative δ 13C values measured in Lake Futalaufquen during the last centuries, supported by increasing OM contents. However, modern δ 15N values from plankton and lacustrine macrophytes collected in Lake Futalaufquen vary in a similar range (see Table 1), which does not allow further interpretations. Warmer temperatures during the last century (Barros et al., Reference Barros, Boninsegna, Camilloni, Chidiak, Magrín and Rustiucci2015) could have caused extended periods of higher biological productivity, which would have increased the amount of autochthonous OM (Teranes and Bernasconi, Reference Teranes and Bernasconi2000). Nevertheless, climate explains neither OM nor isotopic trends since the seventeenth century, favoring the idea of early diagenesis of sedimentary OM as the primary driver of resulting profiles. Similarly, no increased productivity was observed in large Lake Puyehue, central-south Chile (40°S), which has a decreasing trend of OM with depth partially attributed to OM remineralization (Bertrand et al., Reference Bertrand, Boës, Castiaux, Francois, Urrutia, Espinoza, Lepoint, Charlier and Fagel2005). The large lake size and stable catchment characteristics of Lake Futalaufquen mitigate or smooth climatic effects during last centuries.
Lake Futalaufquen is also an archive of metals of atmospheric origin, such as Hg deposition associated mostly with forest fires and volcanic activity (Daga et al., Reference Daga, Ribeiro Guevara, Pavlin, Rizzo, Lojen, Vreča, Horvat and Arribére2016a). Another case of regional or global atmospheric transport corresponds to the up-core increase of Zn (see Figs. 3, 6b) associated with anthropogenic sources. Fossil fuel combustion, mining, and metal production are the main contributors to worldwide anthropogenic emissions of Zn since the Industrial Revolution (Nriagu, Reference Nriagu1996). Lake Futalaufquen is within a National Park (established in 1937), without local pollution sources and industries. The low population of settlements in the area and low environmental pressure activities do not explain the Zn increase. However, frequent studies report depositional patterns resulting from long-range atmospheric transport of Zn in remote areas of Europe (Van de Velde et al., Reference Van de Velde, Boutron, Ferrari, Moreau, Delmas, Barbante, Bellomi, Capodaglio and Cescon2000), the Arctic (Boutron et al., Reference Boutron, Görlach, Candelone, Bolshovy and Delmas1991), and Antarctica (Planchón et al., Reference Planchon, Boutron, Barbante, Cozzi, Gaspari, Wolff, Ferrari and Cescon2002). These studies recorded increasing anthropogenic emissions of metals from the early to mid-twentieth century, with progressive reductions after the 1960s and 1970s as a result of emission control policies and improved combustion technologies. Particularly, enrichment of metals in Antarctica around the 1950s was partly attributed to atmospheric emissions from mining in South America (Planchon et al., Reference Planchon, Boutron, Barbante, Cozzi, Gaspari, Wolff, Ferrari and Cescon2002). In fact, Zn mining is still active in South America, both 1500–2000 km north of Lake Futalaufquen (in Chile and Argentina, active since the 1930s) and 240 km south (in Chile, active since the 1980s). Zn evolution at Lake Futalaufquen is partially in agreement with that in Antarctica (Planchon et al., Reference Planchon, Boutron, Barbante, Cozzi, Gaspari, Wolff, Ferrari and Cescon2002) where crustal enrichment factors (EFc) have increased since the beginning of the twentieth century with maximum values around AD 1980 (see Fig. 6b). Zn deposition has decreased since the 1980s, similar to Antarctica, probably due to improved technologies. However, these studies are not uniform for South America, for example, several lakes from Nahuel Huapi National Park, 200 km north of LANP, did not show evidence of any Zn increase (Ribeiro Guevara et al., Reference Ribeiro Guevara, Rizzo, Sánchez and Arribére2005).
Climatic anomalies during the last millennia
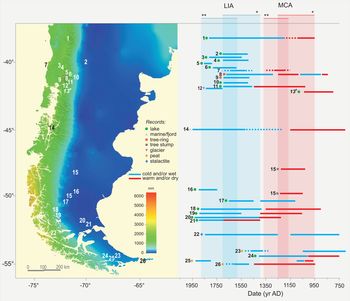
The most relevant climatic alterations during the last 1600 years documented as cold and warm hemispheric conditions are the MCA (AD 950–1250) and the LIA (AD 1400–1700, better explained in the Northern Hemisphere), followed by the geographically extended warming since the middle-to-late-twentieth century (Mann et al., Reference Mann, Zhang, Rutherford, Bradley, Hughes, Shindell, Ammann, Faluvegi and Ni2009). More recently, the PAGES 2k Consortium did not identify globally synchronous warm or cold periods that define a worldwide MCA or LIA, but did identify regional patterns with intra-hemisphere similarities (Ahmed et al., Reference Ahmed, Anchukaitis, Asrat, Borgaonkar, Braida, Buckley and Büntgen2013). Sustained warm intervals around AD 830–1100 and AD 1160–1370 were reconstructed for the Northern and Southern Hemispheres, respectively, while general cold conditions span the AD 1580–1880 period (Ahmed et al., Reference Ahmed, Anchukaitis, Asrat, Borgaonkar, Braida, Buckley and Büntgen2013); these periods are shifted from the definitions in Mann et al. (Reference Mann, Zhang, Rutherford, Bradley, Hughes, Shindell, Ammann, Faluvegi and Ni2009) and have a notably short agreement period (Fig. 7). Actually, different time schemes and durations have been used in the literature, and nowadays both of the previous references are equally referenced for comparison.
(color online) Summary of paleoenvironmental studies (a non-exhaustive list) carried out in Patagonia between 38°S and 54°S reporting wet/cold and dry/warm conditions plotted on a map of annual mean precipitation (Hijmans et al., Reference Hijmans, Cameron, Parra, Jones and Jarvis2005). Modeled climatic anomalies for the last millennia (LIA and MCA) from Mann et al. (2009, indicated by *) and Ahmed et al. (2013, indicated by **) were used as a base for comparison of multiproxy records obtained from tree-ring, glacial, marine, and (predominantly) lake/peat sequences. Note the short time of agreement between both reconstructions. References with indication of chronology quality (dpm: 14C dates per millennium, model applied when corresponds; other methods; Blaauw et al., Reference Blaauw, Christen, Bennett and Reimer2018): 1 Fletcher and Moreno, Reference Fletcher and Moreno2012 (4, Oxcal; 210Pb); 2 Coviaga et al., Reference Coviaga, Rizzo, Pérez, Daga, Poiré, Cusminsky and Ribeiro Guevara2017 (2, Oxcal; 137Cs); 3 Fagel et al., Reference Fagel, Böes and Loutre2008 (varve/137Cs/210Pb); 4 Bertrand et al., Reference Bertrand, Boës, Castiaux, Francois, Urrutia, Espinoza, Lepoint, Charlier and Fagel2005 (varve/137Cs/210Pb/ Tephra); 5 Ariztegui et al., Reference Ariztegui, Bösch and Davaud2007 (4; varve/137Cs); 6 Serra et al., Reference Serra, García, Maidana, Villarosa, Lami and Massaferro2016 (210Pb/Tephra); 7 Lamy et al., Reference Lamy, Hebbeln, Röhl and Wefer2001 (1, linear interpolation); 8 Villalba, Reference Villalba1994 (dendrochronology); 9 Lara and Villalba, Reference Lara and Villalba1993 (dendrochronology); 10 Williams et al., Reference Williams, Rieradevall, Añón Suárez, Rizzo, Daga, Ribeiro Guevara and Arribére2016 (137Cs/210Pb/Tephra); 11 Williams et al., Reference Williams, Añón Suárez, Rieradevall, Rizzo, Daga, Arribére and Ribeiro Guevara2019 (137Cs/210Pb/Tephra); 12 Masiokas et al., Reference Masiokas, Luckman, Villalba, Ripalte and Rabassa2010 (dendrogeomorphic); 13# This study (1.3, Oxcal; 137Cs/Tephra); 14 Bertrand et al., Reference Bertrand, Hughen, Sepúlveda and Pantoja2014 (5, Clam); 15 Stine, Reference Stine1993 (dead trees); 16 Ohlendorf et al., Reference Ohlendorf, Fey, Massaferro, Haberzettl, Laprida, Lücke and Maidana2014 (2, mixed regression); 17 Fey et al., Reference Fey, Korr, Maidana, Carrecedo, Corbella, Dietrich and Haberzettl2009 (4, linear interpolation); 18 Moreno et al., Reference Moreno, Francois, Villa–Martínez and Moy2009 (2, cubic spline); 19 Moy et al., Reference Moy, Dunbar, Moreno, Francois, Villa-Martínez, Mucciarone, Guilderson and Garreaud2008 (3, 3rd-order polynomial); 20 Haberzettl et al., Reference Haberzettl, Fey, Lücke, Maidana, Mayr, Ohlendorf, Schäbitz, Schleser, Wille and Zolitschka2005 (2, polynomial); 21 Mayr et al., Reference Mayr, Fey, Haberzettl, Janssen, Lucke, Maidana and Ohlendorf2005 (3, linear interpolation); 22 Schimpf et al., Reference Schimpf, Kilian, Kronz, Simon, Spötl, Wörner, Deininger and Mangini2011 (Th/U ages); 23 van Bellen et al., Reference Van Bellen, Mauquoy, Hughes, Roland, Daley, Loader, Street-Perrot, Rice, Pancotto and Payne2016 (7–9, Bacon); 25 Waldmann et al., Reference Waldmann, Ariztegui, Anselmetti, Austin, Moy, Stern, Recasens and Dunbar2010 (0.2; Tephra); 25 Mauquoy et al., Reference Mauquoy, Blaauw, van Geel, Borromei, Quattrocchio, Chambers and Possnert2004 (9.3); 26 Ponce et al., Reference Ponce, Borromei, Rabassa and Martinez2011 (0.5, 2rd-order polynomial).

Although the MCA and LIA have been identified in paleoclimate records from both hemispheres, their timing, magnitude, and nature have not been clearly delineated for South America (Moy et al., Reference Moy, Moreno, Dunbar, Kaplan, Francois, Villalba, Haberzettl, Vimeux, Sylvestre and Khodri2009). Furthermore, in southern South America, latitudinal variations of the westerlies at annual to centennial scales define particular climatic variations (rainy seasons and long cold–warm climatic periods, respectively), with a contrasting wet western and dry eastern Patagonia (Toggweiler et al., Reference Toggweiler, Russell and Carson2006; Garreaud et al., Reference Garreaud, Vuille, Campagnucci and Marengo2009) and records opposite conditions at northern and southern wind-belt margins (Lamy et al., Reference Lamy, Kilian, Arz, Francois, Kaiser, Prange and Steinke2010). Owing to these variables and overlapping conditions, studies conducted with different records from Patagonia attempted to reconstruct past climatic variations and compared them with climatic anomalies identified in the Northern Hemisphere. Available records along Patagonia from ~38–54°S are shown in Figure 7 (including proxies used, dating densities, and models applied) in order to compare their variability according to the rainfall gradient vs their latitudinal position and degree of confidence of age-depth models.
The increase of productivity proxies and the slight decrease of clastic indicators from the beginning of the ninth to the eleventh centuries in Lake Futalaufquen evidence a warm-dry period. The age recorded here for this event (~AD 900) is earlier than those reconstructed for the MCA (AD 950–1250 [Mann et al., Reference Mann, Zhang, Rutherford, Bradley, Hughes, Shindell, Ammann, Faluvegi and Ni2009] or AD 1160–1370 [Ahmed et al., Reference Ahmed, Anchukaitis, Asrat, Borgaonkar, Braida, Buckley and Büntgen2013]), but these authors noted that reconstructions of the MCA and LIA are less reliable in extratropical latitudes of the Southern Hemisphere. Moreover, tree-ring records close to Lake Futalaufquen showed a period of below-average precipitations and above-average temperatures around AD 850–900 (without information prior to AD 850; Villalba et al., Reference Villalba, Leiva, Rubulls, Suarez and Lenzano1990), consistent with our record. However, also based on dendrochronology, Villalba (Reference Villalba1994) correlated a warm-dry period from AD 1080–1250 with the MCA, slightly shifted from our record, while at similar latitudes in the windward side of the Andes there is no evidence of warming for this period (see Fig. 7; Lara and Villalba, Reference Lara and Villalba1993). The partial synchrony between tree rings and our lake sequence reflects differences inherent to each climatic record. Thus, comparisons should be made with caution since lake sedimentary records are the result of an integration of processes in the whole drainage area, depending on the waterbody and catchment characteristics. Lake reconstructions capture information at a lower temporal resolution related to large-scale climatic phenomena and dilute local effects, as opposed to single-site climatic high-frequency reconstructions, such as those derived from tree rings (Hughes and Díaz, Reference Hughes and Diaz1994).
Climatic reconstructions based on lake sequences at the lee side of the Andes between 40°S and 43°S generally do not refer to the MCA (see Fig. 7), except for a recent study that identifies dry conditions around AD 1130–1450 (Williams et al., Reference Williams, Añón Suárez, Rieradevall, Rizzo, Daga, Arribére and Ribeiro Guevara2019). However, our results agree with records from southern locations, up to 52°S, while opposite wetter conditions were recorded for southernmost latitudes around the MCA (see Fig. 7). Records located at different latitudes and distances from the Andes provide evidence of different regional circulation patterns. At multi-centennial time scales, shifts in the latitudinal position of the westerlies (equatorward or poleward) indicate synchronous precipitation anomalies of the opposite sign at the northernmost and southernmost margins of the southern westerlies (Lamy et al., Reference Lamy, Kilian, Arz, Francois, Kaiser, Prange and Steinke2010). Particularly, the period generally associated with the MCA was characterized by high precipitation at the southern boundary of the westerly wind belt (southern Patagonia, 51–55°S), as seen in several proxies (Waldmann et al., Reference Waldmann, Ariztegui, Anselmetti, Austin, Moy, Stern, Recasens and Dunbar2010; Schimpf et al., Reference Schimpf, Kilian, Kronz, Simon, Spötl, Wörner, Deininger and Mangini2011; van Bellen et al., Reference Van Bellen, Mauquoy, Hughes, Roland, Daley, Loader, Street-Perrot, Rice, Pancotto and Payne2016), while lower precipitation was recorded at the northern margin of the westerlies (south-central Chile, 38−46°S; see Fig, 7; Lamy et al., Reference Lamy, Hebbeln, Röhl and Wefer2001; Fletcher and Moreno, Reference Fletcher and Moreno2012; Bertrand et al., Reference Bertrand, Hughen, Sepúlveda and Pantoja2014). These opposite conditions were associated with a poleward shift of the southern westerly winds around AD 600–1000, approximately during the MCA (Lamy et al., Reference Lamy, Hebbeln, Röhl and Wefer2001; Bertrand et al., Reference Bertrand, Hughen, Sepúlveda and Pantoja2014). In fact, correlations with twentieth-century instrumental records indicate a southward shift of the westerlies associated with the steady increase in air temperature and glacial recession during the same time as the MCA period (Moreno et al., Reference Moreno, Vilanova, Villa-Martínez, Garreaud, Rojas and De Pol-Holz2014).
The LIA, on the other hand, refers to cooler and wetter climatic conditions over the Northern Hemisphere from AD 1400 to 1700 (Mann et al., Reference Mann, Zhang, Rutherford, Bradley, Hughes, Shindell, Ammann, Faluvegi and Ni2009). According to downscaled model simulations and proxy data (tree-ring and pollen data) for southeastern Patagonia, the LIA is shifted to the period between AD 1550 and 1800, with precipitation anomalies of + 3.4 mm/month compared to the recent period (Meyer and Wagner, Reference Meyer and Wagner2008), in agreement with the cold period defined in Ahmed et al. (Reference Ahmed, Anchukaitis, Asrat, Borgaonkar, Braida, Buckley and Büntgen2013) from AD 1580 to 1880. North Patagonian records show differences in timing, but wetter and/or cooler conditions are supported by dendrochronology, lake sediments, glacial evidence, and chironomid assemblages (see Fig. 7 and references therein). Some studies also suggest an equatorward shift of the southern westerlies paralleling the LIA (Lamy et al., Reference Lamy, Hebbeln, Röhl and Wefer2001; Bertrand et al., Reference Bertrand, Hughen, Sepúlveda and Pantoja2014). However, the frequency and intensity of tephra layers in Lake Futalaufquen since the sixteenth century likely precludes a clear identification of this climatic anomaly (see Figs. 3–4).
The most recent change in climate comprises the global warming since the middle-to-late-twentieth century (Osborne and Briffa, Reference Osborne and Briffa2006; Mann et al., Reference Mann, Zhang, Rutherford, Bradley, Hughes, Shindell, Ammann, Faluvegi and Ni2009). In the northern Patagonian Andes, there was a negative trend in precipitation since the beginning of the last century and a general warming trend during the second half (Barros et al., Reference Barros, Boninsegna, Camilloni, Chidiak, Magrín and Rustiucci2015). These trends in precipitation and temperature have led to retreats of glaciers since the nineteenth century; after 1980, however, climatic conditions have remained relatively stable, but warmer than pre-1980 (Ruiz et al., Reference Ruiz, Berthier, Viale, Pitte and Masiokas2017). For Lake Futalaufquen, although an increase in OM was observed in the last century, the trend seems to start around AD 1600, supporting the idea that the profile represents the common early diagenesis of sedimentary OM rather than an increase in primary productivity in the lake, as previously discussed. Huge lake dimensions and pristine conditions of the region are probably masking or delaying signs of global warming.
CONCLUDING REMARKS
The lacustrine record from Lake Futalaufquen provides information about the potential of sediment geochemistry and mineralogy to reveal environmental changes that occurred during the last 1600 years in a region where few paleoenvironmental studies have been performed. Integration of independent information suggests that an increase in primary lacustrine productivity and/or in the proportion of littoral detritus from macrophytes transported to the lake centre, associated with warmer waters and/or decreasing lake level caused by drier conditions, respectively, occurred around AD 800–1000 with a maximum at AD 880–920. Moreover, such variations were accompanied by a decrease in clastic input, supporting the inference of drier weather conditions. The inferences about OM sources are sustained by geochemical and mineralogical data, including the innovative indicators Br/OM and Amorph/Pl, and should be reinforced by using well-proven paleolimnological tools like C/N or biogenic silica. Consistently, the period AD 800–1000, emphasized for the proposed indicators, partially coincides with the MCA, which was probably expressed in this location as a warmer and drier period compared with the one prior to AD 800. This agrees with the globally warmer nature of the MCA, paralleling a poleward shift of the southern westerlies with contrasting wetter conditions at southernmost latitudes, as several works have proposed. Conversely, the LIA, which is well represented by cold and wet conditions in several regional records, was not identified in the present study, possibly due to the interference in the records caused by frequent depositions of tephra layers during the last 500 years. Furthermore, there was no evidence of the late-twentieth-century warming trend, which has been instrumentally recorded in northern Patagonia. For the last century, however, indications of anthropogenic impacts at this distant location are seen in the up-core increase of Zn; these deposits probably came from distant emissions produced by metal and ore processing activities, which began in South America in the early twentieth century, or from global sources.
Overall, the results of this work demonstrate the importance of multiproxy studies in northern and southern Patagonia reporting on the global LIA and MCA periods. Such studies mainly provide evidence of the variability of the southern westerly winds during the last millennia.
ACKNOWLEDGMENTS
The authors thank Ricardo Sánchez for his collaboration in sampling, the reactor RA6 operation staff for their assistance in sample analysis, the Departamento Caracterización de Materiales (Centro Atómico Bariloche, Argentina) for their support in XRD studies and acces to SEM, the División Física de Metales (Centro Atómico Bariloche, Argentina) for support in TEM studies, and the Facultad de Ingeniería (Universidad Nacional del Comahue, Argentina) for IR measurements. We are grateful to Leonardo Buria (National Parks Administration) and personnel from Los Alerces National Park for fieldwork support. This work was partially funded by Fundación Balseiro (2010/2011), SeCTyP 06/C339, PICT 2012-280 and PICT 2016-0298 projects. Slovenian researchers were supported by the research program P1–0143 funded by the Slovenian Research Agency and the EU Horizon 2020 project MASSTWIN (grant agreement No. 692241). The authors also thank the editors Derek Booth and Lesleigh Anderson, the reviewer Jay Quade, and another anonymous reviewer for valuable suggestions to improve the manuscript.
SUPPLEMENTARY MATERIAL
The supplementary material for this article can be found at https://doi.org/10.1017/qua.2020.34