Introductıon
Disasters are widely acknowledged as disruptive events stemming from natural, technological, or human-related causes that significantly impair societal functioning, daily routines, and public welfare by causing physical, economic, and social damages.Reference Nahsan and Şahinöz1 According to the 2020 report by the International Federation of Red Cross and Red Crescent Societies (IFRC), approximately 1.7 billion people worldwide were affected by disasters between 2010 and 2020.2 Such events, particularly natural disasters, are known to increase the likelihood of both acute and chronic psychological distress, including conditions such as post-traumatic stress disorder (PTSD), depression, and various trauma-related symptoms.Reference Ni, Zhang, Xue, Xu and Tang3
Massive disasters evoke intense emotional reactions-fear, confusion, sorrow, panic, and hopelessness-that affect survivors, their families, communities, and broader society.Reference Steffen and Fothergill4 These experiences threaten individuals’ psychological well-being and contribute to a spectrum of psychosocial stressors, such as the loss of loved ones, confrontation with death, helplessness, grief, and existential anxiety.Reference Tang, Zhao and Lu5 There is increasing awareness that recovery in the aftermath of such events is strongly tied to resilience at the individual and community levels.Reference Makwana6, Reference Eisenman, Chandra and Fogleman7
Understanding the factors that facilitate resilience during recovery is crucial, especially in vulnerable groups. In parallel, there is a growing need for psychometrically sound instruments to evaluate individuals’ ability to adapt and recover from disaster-related adversities. Measuring resilience retrospectively offers insight into how people and communities have navigated previous crises, thus informing future interventions.Reference First, Yu and Houston8
The Disaster Adaptation and Resilience Scale (DARS), initially developed by First et al. in the United States, was designed to assess individual-level disaster resilience.Reference First, Yu and Houston8 A review of the Turkish academic literature reveals a gap in culturally tailored tools that measure adaptation and resilience among those exposed to disasters. This study aims to adapt the DARS to Turkish populations and evaluate its psychometric properties. The primary objective is to introduce a culturally appropriate instrument that measures adaptation and resilience among disaster-experienced individuals in Türkiye. Furthermore, the study seeks to contribute to the Turkish disaster and health sciences literature by offering a standardized tool to support intervention planning and policy development. By emphasizing the role of individual, social, and environmental resources, the adapted scale may aid in identifying strengths that contribute to effective disaster recovery and enhance future research into resilience mechanisms.
Method
Study Design and Participants
This methodological study was conducted to adapt the DARS into Turkish and evaluate its psychometric properties among individuals who had experienced at least one disaster in the past 5 years. The study sample included 335 adults recruited using snowball sampling through online platforms between April and August 2023. The inclusion criteria were: (1) being aged 18 years or older, (2) having experienced a disaster (e.g., earthquake, flood, fire, etc.) within the past 5 years, and (3) providing informed consent. Participants who failed normality assumptions or left more than 10% of items blank were excluded (n = 9). The final sample size exceeded the minimum recommended ratio of 5-10 participants per item for scale validation.Reference Karakoç and Dönmez9, Reference Aksu, Eser and Güzeller10
Instruments
-
1. Demographic Data Form: A short questionnaire was developed to gather sociodemographic and contextual data, including gender, age, marital status, education level, perceived income status, and type of disaster experienced.
-
2. Disaster Adaptation and Resilience Scale: The original DARS was developed by First et al. to assess individual resilience after disasters. It includes 43 items across 5 domains: Physical Resources (items 1-9), Social Resources (10-19), Problem Solving (20-27), Stress Management (28-36), Optimism (37-43). Items are rated on a 5-point Likert scale from 0 (“not true”) to 4 (“almost always true”). Higher scores indicate greater resilience. The original version demonstrated high internal consistency (Cronbach’s alpha = 0.96) and robust factorial validity.Reference First, Yu and Houston8
Translation and Cultural Adaptation Process
The adaptation followed international guidelines for cross-cultural scale validation:
-
1. Forward Translation: The original English version of DARS was translated into Turkish by four independent experts fluent in both languages.
-
2. Expert Review and Cultural Relevance Check: A multidisciplinary panel (including specialists in disaster management, public health, clinical psychology, and Turkish linguistics) evaluated the translations for content validity. The item-level content validity index (I-CVI) values ranged from 0.90 to 1.00.
-
3. Back Translation: A native English speaker, unaware of the original items, translated the Turkish version back into English. No significant semantic deviations were observed.
-
4. Pilot Testing: The pre-final Turkish version was administered to 55 individuals to assess clarity, cultural relevance, and internal consistency. Cronbach’s alpha for this pilot version was 0.953.
Data Collection Procedure
The final Turkish version of the DARS and the demographic form were distributed online. All participants provided electronic informed consent. Participation was voluntary and anonymous.
Statistical Analysis
Data analysis was conducted using IBM SPSS 22 and AMOS software. Normality was assessed using skewness and kurtosis values. Items with item-total correlation values below 0.30 were removed.Reference Steffen and Fothergill4
Exploratory Factor Analysis (EFA)
Performed using Promax rotation to explore the underlying factor structure. Sampling adequacy was evaluated using the Kaiser-Meyer-Olkin (KMO) statistic and Bartlett’s Test of Sphericity.
Confirmatory Factor Analysis (CFA)
Conducted on the final model derived from EFA to confirm the factor structure. Model fit was assessed using χ2/df, RMSEA, CFI, TLI, SRMR, AGFI, IFI, PGFI, and PNFI.
Ethical Considerations
Ethical approval was obtained from the [Institutional Ethics Committee] (Ref. No: E-95531838-050.99-67857, Date: March 23, 2023). Written informed consent was collected electronically. The original authors of the DARS granted formal permission for the scale adaptation via email correspondence.
Result
Sample Characteristics
Among the final 335 participants, the majority (68.7%) were women, while 31.3% identified as men. Participants aged 26 years and older made up 35.2% of the sample. In terms of marital status, 75.5% were single. Regarding education, 52.8% held a bachelor’s degree, and 22.4% had completed an associate degree. Most respondents (62.7%) reported a moderate income level. The most frequently encountered disaster was earthquakes, reported by 91.6% of participants.
Exploratory Factor Analysis
Preliminary checks confirmed that the data were suitable for factor analysis, following the exclusion of 9 responses that failed normality assumptions. The Kolmogorov-Smirnov test was nonsignificant (P = 0.200), and skewness (−0.008) and kurtosis (−0.277) values supported the assumption of normal distribution. The sample size remained at 335.
Three items (i1, i2, i28) exhibited item-total correlations below the 0.30 threshold and were removed. The remaining 40 items had correlations between 0.301 and 0.619, and Cronbach’s alpha for this set was 0.935. The KMO value was 0.916, and Bartlett’s Test of Sphericity was significant (P < 0.001), confirming data suitability for factor analysis.
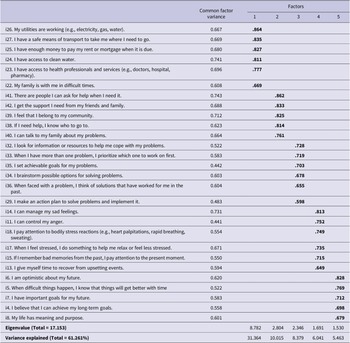
Using Promax rotation, 13 items were excluded due to cross-loadings with differences below 0.10, resulting in a final 28-item version. This refined model showed improved sampling adequacy (KMO = 0.893) and high anti-image correlations (0.797-0.949). The Scree Plot and eigenvalue analysis supported a 5-factor structure, explaining 61.26% of the total variance (Table 1).
Item level descriptive statistics and internal consistency analysis

The 5 identified dimensions were: (Table 2 and Figure 1).
Structural validity findings of the AES (EFA)

Visualization of factor structure: scree plot.

Factor 1—Problem Solving (Items 22-27): Explained 31.36% of the total variance; reflected coping resources such as logistics and infrastructure.
Factor 2—Optimism (Items 38-42): Accounted for 10.02% of variance; related to hopeful, future-oriented beliefs.
Factor 3—Stress Management (Items 29, 32-36): Represented 8.38% of variance; encompassed emotional regulation strategies.
Factor 4—Social Resources (Items 11, 13-15, 17, 18): Covered 6.04% of variance; focused on social support and connectedness.
Factor 5—Physical Resources (Items 4-8): Contributed 5.46% of variance; included access to health care and community infrastructure.
Confirmatory Factor Analysis
To validate the factor structure identified in the EFA, CFA was conducted using AMOS. The 5-factor model demonstrated acceptable to excellent fit across multiple indices (Table 3). Factor loadings ranged from 0.41 to 0.88 across all subscales, confirming that each item was strongly associated with its intended dimension. The structural model demonstrated adequate internal coherence (Figure 2).
CFA goodness-of-fit indices and normal values

AES Confirmatory Factor Analysis diagram.

Internal Consistency (Cronbach Alpha) Coefficients
The internal consistency of the scale was evaluated using Cronbach’s Alpha coefficients. The results demonstrated high reliability, with coefficients ranging from 0.785 to 0.901 across the 5 factors. The Cronbach’s Alpha for the entire scale was 0.910, indicating excellent internal consistency.Reference DeVellis12, Reference Tavşancıl13
Two Half Reliability Coefficients
The two-half reliability analysis of the finalized 28-item scale yielded satisfactory results. The Spearman-Brown and Guttman Split-Half coefficients were 0.714, indicating acceptable split-half reliability. Additionally, the Cronbach’s Alpha values were 0.855 for the first half and 0.888 for the second half, demonstrating high internal consistency across the scale.Reference Seçer11
Determination of the Distinctiveness of the Scale
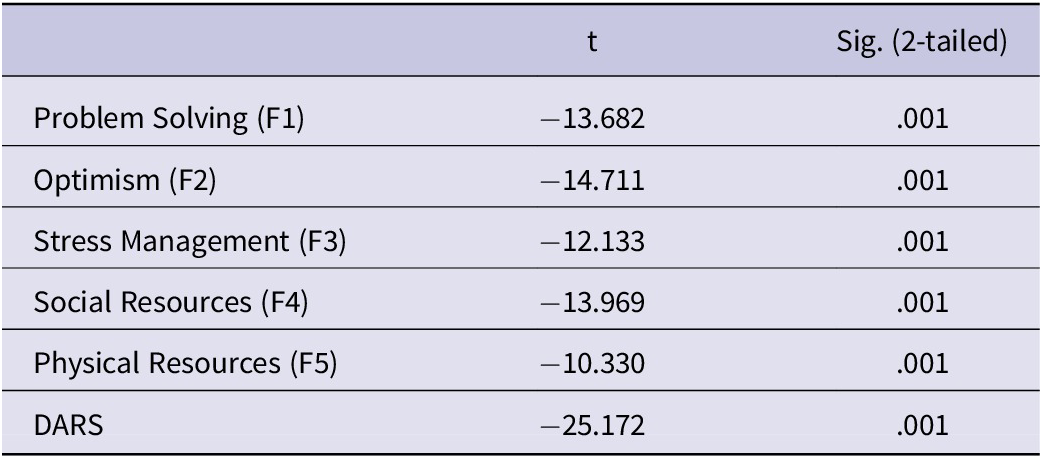
The discriminative validity of the scale and its sub-dimensions was examined through independent samples t-tests comparing the mean scores of the lower and upper 27% groups. The analysis revealed statistically significant differences (P < 0.05), indicating that the scale has strong internal consistency and satisfactory discriminative power. Detailed t-test results for each item are presented in Table 4.
Determination of the discrimination power of DARS and its subscales

The Relationship Between DARS and Its Sub-Dimensions
Correlation analysis was conducted as an additional measure of reliability in the scale development process. Table 5 shows strong positive correlations between the DARS total score and its sub-dimensions, further supporting the scale’s structural coherence and overall reliability.
Mean, minimum and maximum scores, and correlation analysis results for the DARS and its subscales

** Correlation is significant at the 0.01 level (2-tailed).
Temporal Invariance
Test-retest analysis with 30 participants showed a strong correlation between the 2 administrations (r = 0.753; P = 0.001), supporting the scale’s temporal stability.
Discussion and Conclusion
The DARS underwent a meticulous translation process, cultural adaptation, and validation to ensure its appropriateness among Turkish-speaking populations. The initial translation by language experts was followed by comprehensive evaluations conducted by Turkish language specialists and professionals in scale development and relevant disaster-related fields. Necessary revisions aligned the scale with Turkish linguistic and cultural norms. The final Turkish version was then back-translated into English by a bilingual expert, and no semantic discrepancies were detected between the original and translated versions, confirming linguistic equivalence.
Following the translation phase, a pilot study was conducted, which demonstrated that the scale was understandable and psychometrically sound. Based on the positive pilot findings, the main implementation proceeded. EFA revealed a clear 5-factor structure, and subsequent CFA validated this structure. The CFA indices fell within acceptable or ideal ranges, with values such as CMIN/DF = 1.811, RMSEA = 0.049, CFI = 0.94, RMR = 0.063, SRMR = 0.0405, and TLI = 0.933, indicating strong model fit and structural validity.Reference Yaşlıoğlu14 Reliability analyses conducted after CFA confirmed the scale’s internal consistency, with a total Cronbach’s Alpha of 0.910 and subscale coefficients ranging from 0.785 to 0.901. Additional analyses, including split-half and test-retest reliability, further demonstrated the robustness and temporal stability of the Turkish version. The final scale consists of 28 items grouped into 5 dimensions: Problem-Solving, Optimism, Stress Management, Social Resources, and Physical Resources. All 5 subscales showed statistically significant discriminatory power between high and low scorers, affirming their sensitivity and reliability in distinguishing resilience levels.
A national literature review conducted through TOAD and Google Scholar using keywords such as “disaster,” “resilience,” and “adaptation” identified 14 relevant scales.Reference Bennur, Çağan and Aysun15-Reference Şeyma Nur Aksaç, Fatma Çapcıoğlu and Çınar28 However, none were found to measure both disaster adaptation and resilience comprehensively. Furthermore, the subscales of these instruments did not overlap with those in the DARS, highlighting their originality and contribution to the field.
In conclusion, the Turkish version of the DARS presents a reliable and valid instrument for assessing adult disaster-related resilience and adaptation. The scale includes 28 items across 5 subdimensions: 6 items under Problem-Solving, 5 items each under Optimism and Physical Resources, and 6 items under Stress Management and Social Resources. No reverse-coded items are present in the scale. Scores are interpreted by calculating the mean score per item, with higher average scores indicating stronger resilience and adaptation. The scale’s ability to explain 61.261% of the total variance and its confirmed temporal stability make it a valuable resource for academic research and practical applications in disaster contexts.
Utilization of Results in Practice
The revised Turkish DARS version strongly aligns with the original scale. It offers robust psychometric properties, establishing its value as a reliable tool for evaluating disaster-related adaptation and resilience. The scale’s concise structure and clear subdimensions enhance its usability in research and field settings, allowing for efficient assessment.
Its integration into public health initiatives, community resilience programs, and psychological support services could help identify individuals or populations with reduced adaptive capacity following disasters. In addition, the DARS can assist in monitoring changes in resilience over time or evaluating the effectiveness of intervention strategies.
Notably, the scale emphasizes the interconnected role of personal, social, and environmental resources in fostering psychological resilience. It can serve as a framework for designing context-sensitive intervention models, improving disaster preparedness policies, and guiding professional training. Moreover, the scale’s structure allows it to contribute to comparative studies and international research on resilience in disaster-prone populations.
Limitations
This study has certain limitations. Firstly, the sample does not fully represent the entire adult population in Türkiye who have experienced disasters, which may restrict the broader applicability of the results. Secondly, although the original DARS included 43 items, some were removed during the cultural adaptation due to low factor loadings or redundancy. While these modifications enhanced the scale’s psychometric properties, they might have excluded items that hold important relevance. Moreover, the use of self-reported responses raises the potential for bias in participants’ answers. Future research should consider employing larger, more heterogeneous samples that cover different geographic areas, age groups, and socioeconomic statuses to further confirm the scale’s validity in diverse settings.
Acknowledgments
We thank the participant for taking part in the study. We wish to thank the experts for their valuable feedback on the questionnaire.
Author contribution
Research idea: CA, AD; Design of the study: CA, AD; Acquisition of data for the study: CA, AD; Analysis of data for the study: CA, AD; Interpretation of data for the study: CA, AD; Drafting the manuscript: CA, AD; Revising it critically for important intellectual content: CA, AD; Final approval of the version to be published: CA, AD
Funding statement
The author(s) received no financial support for the research.
Competing interests
None.