

Introduction
Polar® equipment (Polar® Electro Öy, Kempele, Finland) has been validated for use in human sports and clinical research for many years, and has recently been adapted for use in horses (Polar Equine®). Polar® have developed a number of heart rate monitors (HRMs) which are typically used in general sports or sports medicine research (see von Borell et al. Reference von Borell, Langbein, Després, Hansen, Leterrier and Marchant-Forde1 for a review). There are a number of systems available from Polar® that record interbeat intervals (IBIs) through the detection of R-peaks at a sampling rate of 1000 Hz. The Polar® system has been validated against a gold-standard electrocardiogram (ECG) during increasing levels of exercise in humans, and a good level of agreement was found between the two systemsReference Kingsley, Lewis and Marson2, Reference Gamelin, Berthoin and Bosquet3.
Many observational studies of equine behaviour include a physiological indicator of autonomic responses to stress or activity. Cost, practical and ethical considerations have led many researchers to favour the use of portable HRMs over blood and salivary glucocorticoids, and hence many have elected to collect heart rate (HR) data as a non-invasive measure of physiological responsesReference Ninomiya, Sato, Kusunose, Mitumasu and Obara4–Reference Jezierski, Jaworski and Górecka6. From this, for example, HR variability (HRV), a non-invasive method for obtaining information about the functionality of the autonomic nervous system (ANS), can be calculatedReference Norman, Eager, Waran, Jeffery, Schroter and Marlin7–Reference Goodwin12.
A validation of the use of Polar® monitors in pigs has been recently carried out. There, IBIs were simultaneously recorded using a Polar® R-R recorder and a telemetric ECG systemReference Marchant-Forde, Marlin and Marchant-Forde13. The authors found that Polar® IBIs showed a number of specific, measurement-related (i.e. non-ectopic in origin) errorsReference Marchant-Forde, Marlin and Marchant-Forde13, but that these could be effectively eliminated, post hoc, by processes of visual identification and correction of the Polar® ECG. The errors were characterized as types 1–3 (single IBI discrepancies from the ECG data, either negative or positive) and types 4 and 5 (a sequence of either ‘missing’ or ‘extra’ IBIs in the series, respectively). The authors demonstrated that uncorrected Polar® data could not be used interchangeably with ECG data in pigs, owing to the presence of these errors, but that data corrected as described above were acceptableReference Marchant-Forde, Marlin and Marchant-Forde13. Despite this, a number of published equine behaviour papers have reported behavioural, as well as HRV, data generated from the Polar® systems (see von Borell et al. Reference von Borell, Langbein, Després, Hansen, Leterrier and Marchant-Forde1 for a review), without any reference to having corrected the Polar® ECG with such a procedure in place (but seeReference Minero, Zucca and Canali14 for an exception). If errors and discrepancies that are similar to those observed in pigs are observed, this may call into question the reliability and validity of IBIs generated from Polar® devices, without similar corrections taken into account. In addition, it is presently unclear as to whether the same errors are found in the Polar® data acquired from horses.
The aims of this study were (1) to collect simultaneous IBI data using Polar® S810i and ECG while horses were standing, stabled in a loose box and at liberty in a field; (2) to compare uncorrected and corrected Polar® data with ECG data according to previously used methods in pigsReference Marchant-Forde, Marlin and Marchant-Forde13; (3) to examine typical errors in Polar® data and attempt to correct them according to previous methodsReference Marchant-Forde, Marlin and Marchant-Forde13; and (4) to assess the validity of corrected and uncorrected Polar® S810i data for recording time and frequency domain HRV data as an indicator of autonomic responses under three ambulatory conditions.
Methods and materials
Subjects
Six mature horses were used to obtain ECG and Polar® recordings (four Thoroughbred geldings (G1–G4), one native pony mare (M5) and one Anglo-Arab mare (M6)). All were kept exclusively at a pasture. In addition to grazing, all the horses had access to haylage ad libitum during the study. None of the horses had any history or current evidence of cardiovascular disease (CVD), as assessed by a registered cardiologist.
Data acquisition
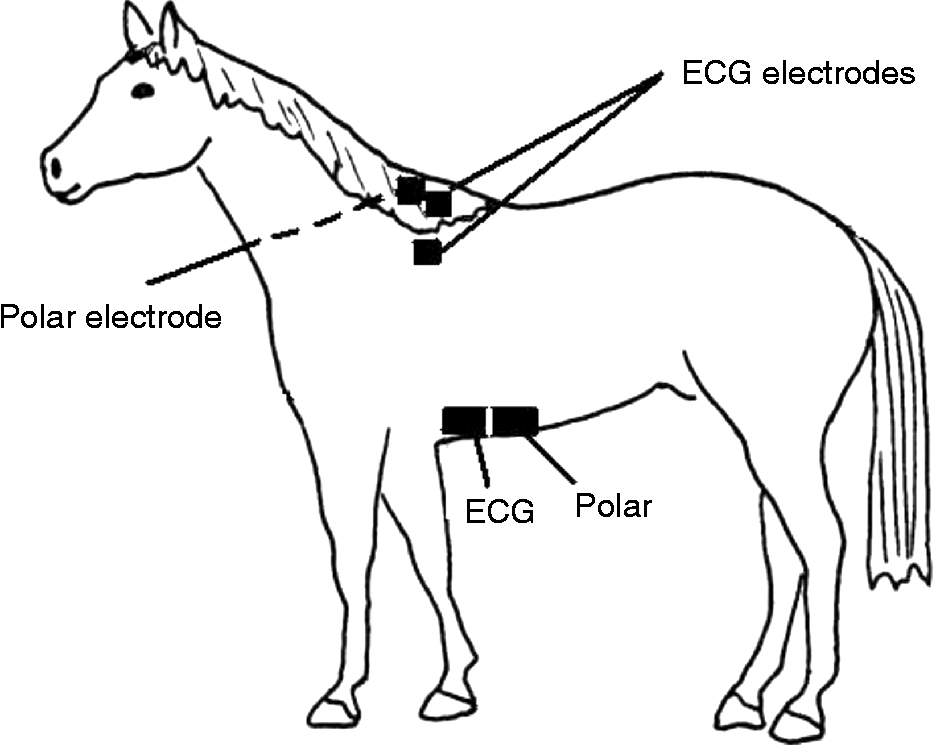
Data were acquired simultaneously from the subjects using two different systems, a 24-h Polar® Equine S810i R-R Recorder (Polar® Electro Öy) with two electrodes, and a Telemetric ECG system (Nihon Kohden, Brentford, Middlesex, UK) with three electrodes (two-lead, base-apex; two recording, one ground/transmitter; C220 ECG electrodes, Cardicare, Essex, UK). The ECG electrodes were attached marginally to the left of the ventral midline, in the typical position of a girth (one electrode), and the nearside withers (two electrodes). The Polar® electrodes were attached to the ventral midline (one electrode, posterior and close to the ECG electrode) and the far side withers (one electrode), secured under a roller around the girth. The coat was clipped at the electrode sites of the lower girth and the nearside and far side withers (see Fig. 1). Electrode coupling gel (Henley's Medical, Welwyn Garden City, Herts, UK) was liberally applied to all the electrode sites to promote conductivity.
Polar and ECG electrode placement for subjects

Both monitoring systems were fitted to all the subjects. Polar® and ECG recordings were started simultaneously. This was achieved by simultaneously engaging the Polar® system and marking the ECG with an event time stamp. The two sets of IBIs were also visually compared on a spreadsheet following data collection to ensure that the systems started simultaneously, in case of any short delay in the Polar® system logging the first R-wave. Each recording session was run continuously for 15 min in order to ensure that each horse provided a minimum of 512 beats. Each animal was tested once in each of the three conditions: loose in the field, at liberty in the stable and standing still in the stable.
Analogue ECG data were simultaneously digitized (1000 Hz) using a computerized data-acquisition programme (PoNeMah Physiology Platform; Gould Instrument Systems, OH, USA). The PoNehMah software platform includes an integral algorithm to detect R-peaks automatically, and the R-peak recognition threshold is set manually. Polar® data were transmitted at the end of each recording period to a laptop computer via a bi-directional infrared interface using the Polar® Horse Trainer™ software platform (Polar® Electro Oy).
Data preparation and analysis
Following data collection, 512 consecutive IBIs from the ECG and the Polar® were isolated for analysis, and were imported into Microsoft Excel® spreadsheets. For the HRV analysis, both time and frequency domain indices were calculated using a widely utilized Windows®-based HRV analysis programmeReference Niskanen, Tarvainen, Ranta-aho and Karjalainen15. These particular measures were chosen in order to represent all the most commonly reported time and frequency domain indices of HRVReference von Borell, Langbein, Després, Hansen, Leterrier and Marchant-Forde1. Frequency domain indices were generated by creating a power spectral density using fast Fourier transformReference Niskanen, Tarvainen, Ranta-aho and Karjalainen15. The frequency domain HRV indices were very low (VLF), low (LF), high (HF) and total power (Total), parasympathetic nervous system indicator (PNSI) and sympathetic nervous system indicator (SNSI)Reference von Borell, Langbein, Després, Hansen, Leterrier and Marchant-Forde1, Reference Norman, Eager, Waran, Jeffery, Schroter and Marlin7, Reference Marchant-Forde, Marlin and Marchant-Forde13. The time domain parameters were the square root of the mean of the sum of squared differences (RMSSD) of heartbeats and percentage of differences between all IBIs greater than 50 ms (pNN50)Reference von Borell, Langbein, Després, Hansen, Leterrier and Marchant-Forde1, Reference Norman, Eager, Waran, Jeffery, Schroter and Marlin7, Reference Marchant-Forde, Marlin and Marchant-Forde13. All data pertaining to the uncorrected Polar®, corrected Polar® and ECG were subjected to a log (base 10) transformation to normalize the distribution, and repeated-measures ANOVA (general linear model, SPSS 14 for Windows®) was carried out with measurement method as the independent measure. Differences between corrected Polar®, uncorrected Polar and ECG were examined using paired sample t-tests, corrected for multiple tests. Finally, Bland–Altman analysis was carried out on the IBIs to examine the rate of agreement between the two measurement systems. Data are presented as mean ( ± SD) unless otherwise indicated. All statistical analyses were carried out with respect to a type 1 error rate of 0.05.
Results
Raw ECG data were replayed following completion of data collection and visually examined using the PoNeMah on-screen validation tool, to check for the correct identification of R-peaks. The Polar® data were also examined for the presence of errors (types 1–5; see above), and we found errors that were similar to those identified previously in pig Polar® IBI dataReference Marchant-Forde, Marlin and Marchant-Forde13. Type 1–3 errors were corrected according to a previously described algorithmReference Cheung16. In the ‘field’ condition, in particular, there were a high number of type 4 errors. This appears to have been the result of loss of contact between the electrodes, particularly during ambulatory conditions. This made effective and accurate comparison of the two methods problematic. Therefore, in order to allow a statistical comparison between ECG and Polar®, sham IBI values of ‘0 ms’ were added into the Polar® dataset for missing beats (i.e. as a result of type 4 errors), and into the ECG for any extra beats in a sequence (i.e. for type 5 errors) to re-establish synchrony between the two measurement systems (as described previouslyReference Marchant-Forde, Marlin and Marchant-Forde13). These sham values were not included in data analysis.
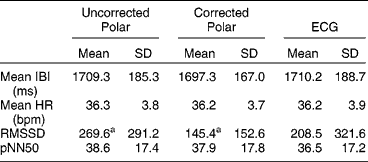
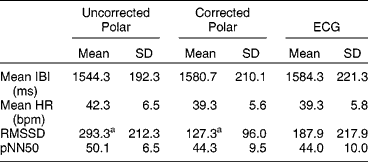
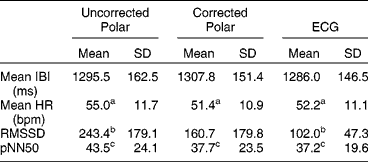
The three conditions, stand (standing still), stable (loose in a stable) and field (at liberty in a field), successfully induced a range of mean HRs in the subjects, from 36 bpm for ‘stand’ to 52 bpm for ‘field’; see Tables 1–3).
Summary statistics for time domain indices for ‘stand’ condition

aRepresents significantly different comparisons (P < 0.02).
Summary statistics for time domain indices for ‘stable’ condition

aRepresents significantly different comparisons (P < 0.05).
Summary statistics for time domain indices for ‘field’ condition

a,b,cRepresents significantly different comparisons (P < 0.02).
Stand
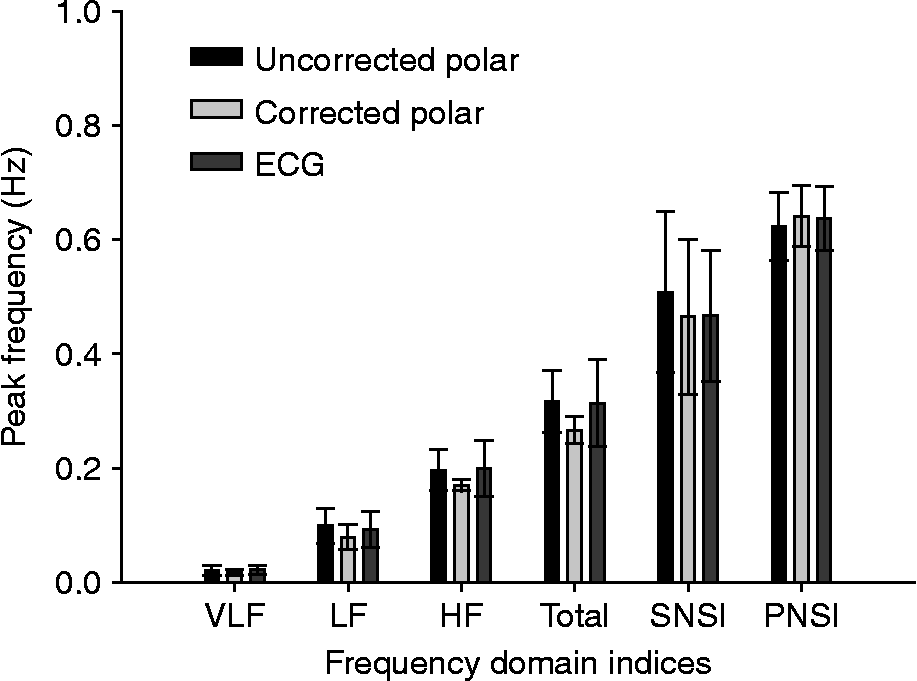
For time domain indices, there were significant main effects of measurement type (i.e. corrected Polar®, uncorrected Polar® and ECG) in relation to RMSSD [F (2, 10) = 5.57, P < 0.05]. Pairwise comparisons (see Table 1) suggested a closer agreement between the uncorrected than the corrected Polar® data and the ECG. There were no main effects of measurement type on any of the frequency domain indices (see Fig. 2).
Effects of measurement type on frequency domain indices for ‘stand’ condition. VLF = very low frequency; LF = low frequency; HF = high frequency; Total = VLF+LF+HF; SNSI = LF/HF; PNSI = HF/Total

Stable
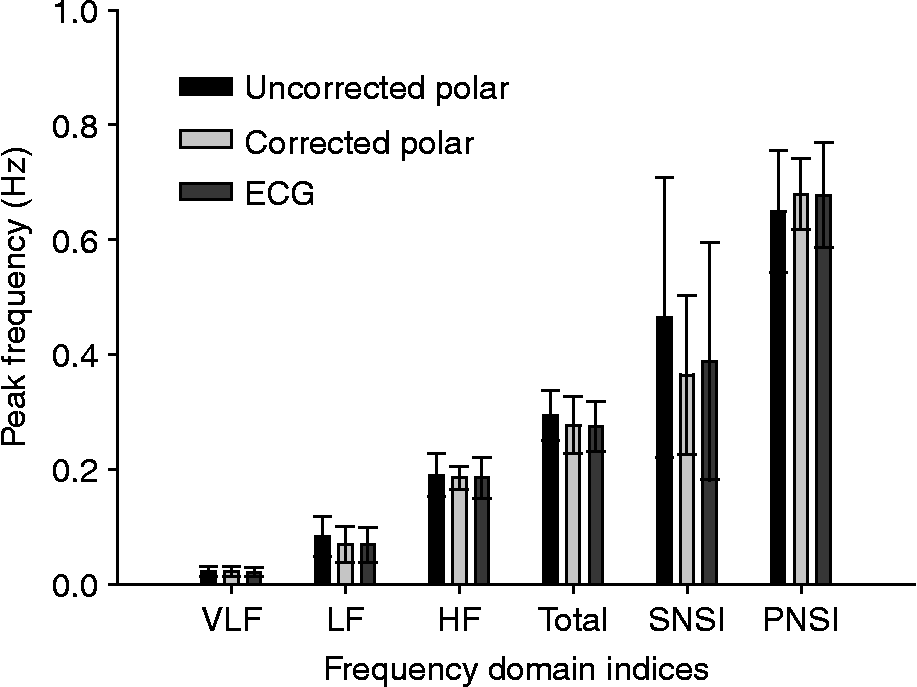
For time domain indices, there was a significant main effect of measurement type on RMSSD [F (2, 10) = 6.12, P < 0.05]. Pairwise comparisons suggested that the corrected Polar® data were closer to the ECG recording than the uncorrected Polar® data. There were no main effects of measurement found for any of the frequency domain indices (Fig. 3).
Effects of measurement type on frequency domain indices for ‘stable’ condition. VLF = very low frequency; LF = low frequency; HF = high frequency; Total = VLF+LF+HF; SNSI = LF/HF; PNSI = HF/Total

Field
For two of the subjects, the field data from the Polar® monitor were unusable, owing to very high numbers of type 4 errors and subsequently excessive noise in the IBIs. Therefore, data from these two subjects were not included in any analysis for the field condition.
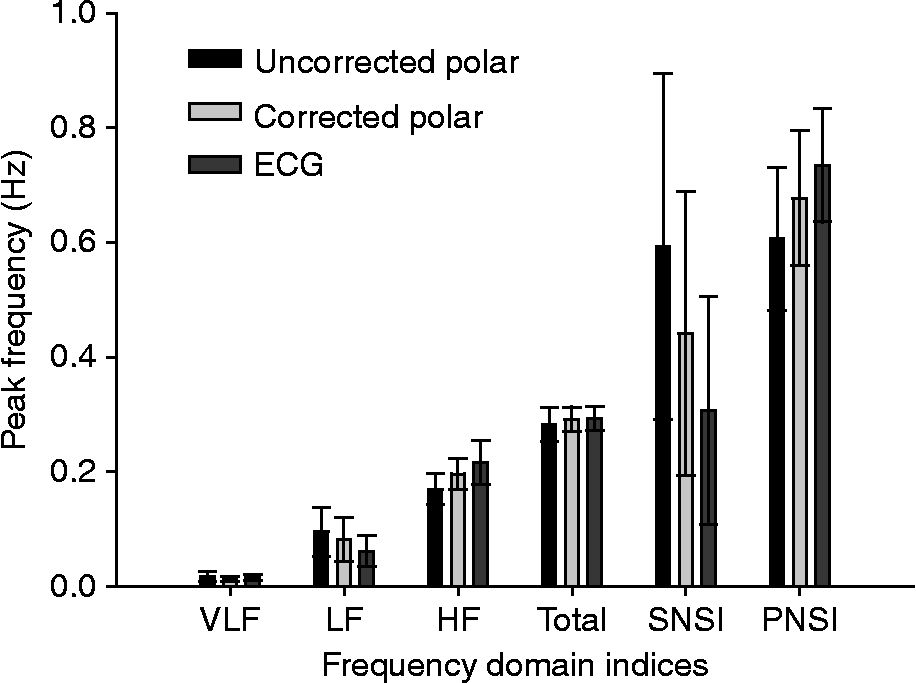
For time domain indices (Table 3), main effects of measurement type were found for mean HR [F (2, 6) = 28.67, P = 0.01], RMSSD [F (2, 6) = 7.26, P < 0.05] and pNN50 [F (2, 6) = 13.92, P < 0.01]. Pairwise comparisons (see Table 3) suggested that the corrected Polar® data followed the ECG data more closely than the uncorrected Polar® data. Figure 4 displays the results obtained in the frequency domain analysis for the field condition. There were no significant main effects revealed for frequency domain in the field condition.
Effects of measurement type on frequency domain indices for ‘field’ condition. VLF = very low frequency; LF = low frequency; HF = high frequency; Total = VLF+LF+HF; SNSI = LF/HF; PNSI = HF/Total

Bland–Altman analysis
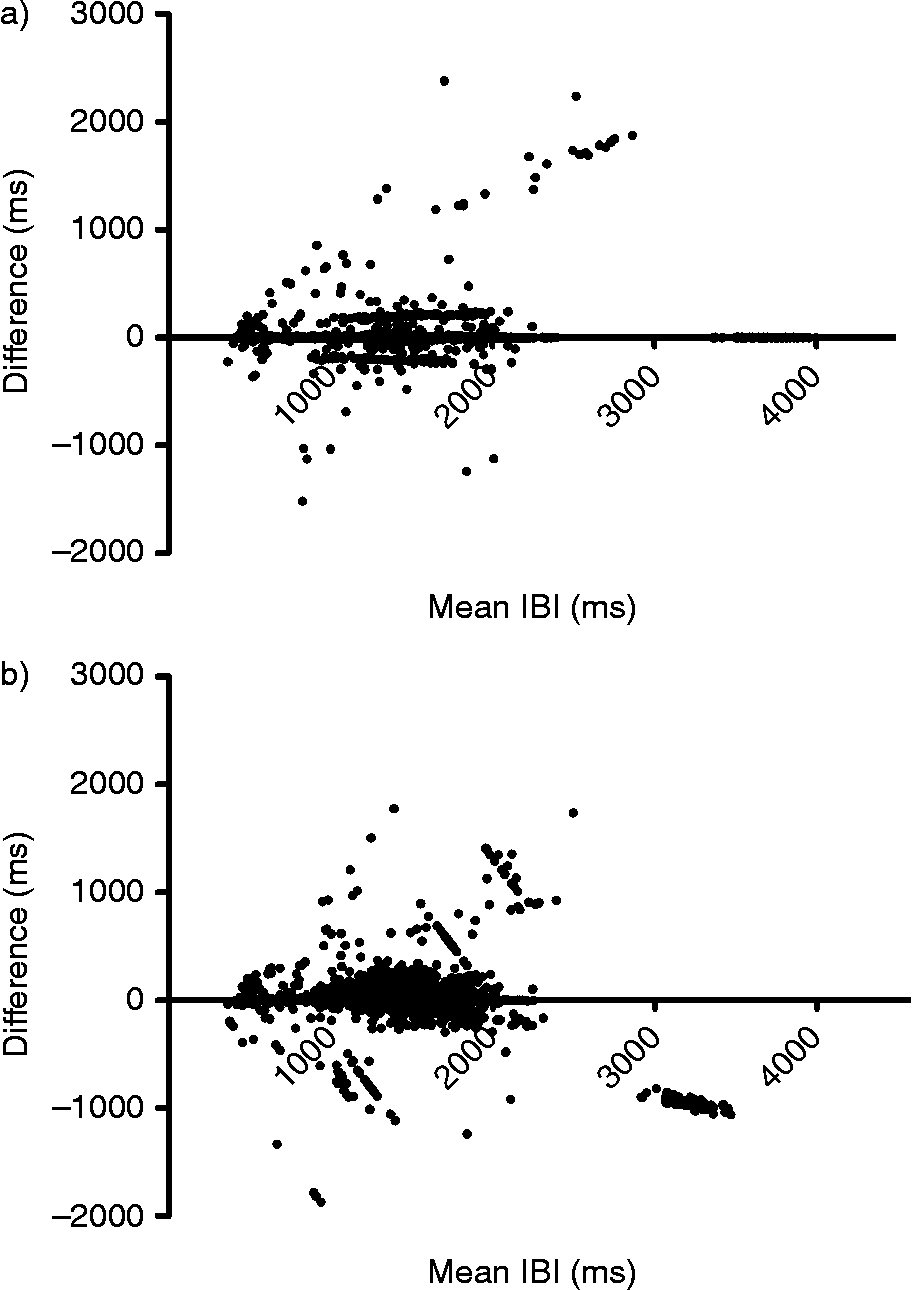
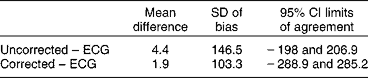
Bland–Altman analysisReference Bland and Altman17 was performed to assess the similarity between the three measures of IBI. Plots for corrected and uncorrected Polar® data versus IBIs derived from ECG, pooled across subjects and for each of the three ambulatory conditions, are shown in Fig. 5. Table 4 summarizes the mean differences between measurement types and limits of agreement (95% CI). Corrected data show a better agreement than uncorrected data, but both show wide limits of agreement indicating that the Polar® was regularly and significantly under- and overestimating IBIs.
Bland–Altman plots comparing IBIs generated from corrected and uncorrected Polar® and ECG for all subjects in all conditions; (a) uncorrected versus ECG, (b) corrected versus ECG

Summary statistics for Bland–Altman analysis

Discussion
Simultaneous data collection using Polar® S810i and ECG indicated that agreement between ECG and uncorrected Polar® data, particularly with relation to time domain indices, reduced as the movement of the horses increased. This raises concerns about the reliability of previously published studies reporting Polar® data, and about the reliability of collecting HRV data from non-stationary horses using Polar® electrodes. The various sources of errors, issues associated with correction of data and concerns relating to electrodes have been raised previouslyReference von Borell, Langbein, Després, Hansen, Leterrier and Marchant-Forde1, Reference Gamelin, Berthoin and Bosquet3, Reference Marchant-Forde, Marlin and Marchant-Forde13, and the present study confirms some of these concerns empirically. Others have demonstrated that correction of the data for certain specific error types may help to minimize erroneous, missing or misclassified beats in pigsReference Marchant-Forde, Marlin and Marchant-Forde13 and humansReference Kingsley, Lewis and Marson2, Reference Gamelin, Berthoin and Bosquet3. We found, however, that while correction of the Polar® data was successful to some extent, it was not clear whether even this was sufficient to produce results that were reliable enough for HRV analysis in horses.
A Bland–Altman analysis is a useful way of assessing the similarity between two measurement systemsReference Norman, Eager, Waran, Jeffery, Schroter and Marlin7, Reference Marchant-Forde, Marlin and Marchant-Forde13, Reference Bland and Altman17. It is more useful than, for example, correlation coefficients where, with such a large dataset, significant and high r values may be yielded even when there are differences within the data. According to the analysis, it appears that the correction procedure did go some way to decreasing the mean differences (bias) between the Polar® and ECG, but as is also clear, the limits of agreement were very high, suggesting that the Polar® system was regularly and significantly under- and overestimating the IBIs.
We have raised a number of specific concerns of relevance to any study using the Polar® system to generate IBIs for HRV analysis. First, we have demonstrated the increased risk of loss of contact of the electrodes as movement increases, even at low levels of physical exertion. Secondly, our data raise concerns about the reliability and validity of Polar® S810i-generated IBIs for recording, in particular, time domain HRV data, e.g. HR as an indicator of ANS responses to activity. Thirdly, it may also be a concern for those seeking to use the Polar® system as a training aid at high levels of physical exertion if accurate and reliable time domain data are necessary. It is worth noting, however, that despite there being no statistically significant differences between the groups pertaining to frequency domain indices, this is not necessarily indicative of interchangeability of the systems. Frequency domain data are highly sensitive to missing or misclassified beats, and thus, even small inconsistencies or anomalies cannot be tolerated. With respect to the problems with signal-to-noise ratio here, it may be that even a lack of significant difference between the measurements is not indicative of equivalence of the two methods.
It is difficult to ensure that constant contact between electrodes and the skin is maintained in subjects unless they are stationary, the coat has been newly clipped, the skin is clean and sufficient electrode gel is applied; therefore, it is not unusual to find errors in Polar® data collected from animalsReference Marchant-Forde, Marlin and Marchant-Forde13. Despite the corrections being carried out on the Polar® data in the present study, there were still inconsistencies between the Polar® data and the ECG. For example, for the time domain indices, the correction procedure appears only to have been successful on the Polar® data (compared with the telemetric ECG) in the ‘stable’ condition. This result casts some doubt over the validity of post hoc corrections of Polar® IBIs to correct missed beats and erroneous detections, even in non-ambulatory conditions, and further illustrates difficulties associated with data generated from this medium. In addition, correction of the data relies on accurate visual discrimination of typical errors generated from Polar® data. Without the gold-standard ECG for comparison, it may not always be possible to accurately and reliably identify such errors.
One possible solution to the issues raised above may be to use ECG electrodes with the Polar® monitoring software. The Polar® system uses contact electrodes, whereas the ECG system uses standard electrodes. Therefore, it is possible therefore that the initial signal quality is better with the ECG, owing primarily to the greater contact. For future studies using the Polar® system, it may be prudent to adopt ECG electrodes to improve the quality of the recording. In addition, the equine ECG has a pronounced t-wave, which may be mistaken for an R-peak by R-R detectors such as the Polar® systemReference von Borell, Langbein, Després, Hansen, Leterrier and Marchant-Forde1. It may therefore be prudent to examine other ways of correcting the Polar® data for horses, particularly in the light of potential problems associated with R-wave detection.
Acknowledgements
DG, MP and ESR gratefully acknowledge the Animal Health Trust and staff for the use of their horses and facilities. They also thank Martin Whiting, Emily O'Connor and Siobhan Abeyesinghe and two anonymous reviewers for their helpful comments on earlier drafts of this paper.