Introduction
Problems of aging and degradation of GaN-based devices were discussed during last years in papers [Reference Osinski, Perlin, Eliseev, Liu and Barton1-Reference Kovalev, Manyakhin, Kudryashov, Turkin and Yunovich6]. Lifetimes of GaN- based light-emitting diodes (LEDs) at normal current conditions may be of 105-106 hours. That is why it is essential to evaluate these lifetimes using short periods of working at high currents. It was shown that quantum efficiency of LEDs with single quantum wells (of Nichia Chemical) at relatively high currents (J=80 MA) can grow up during ≈100 hours and then gradually fall down during a working time of ≈1000 hours [Reference Kovalev, Manyakhin and Yunovich4-Reference Kovalev, Manyakhin, Kudryashov, Turkin and Yunovich6].
It was interesting to study a process of aging and degradation in analogous conditions on LEDs of various laboratories. We have shown in a recent paper [Reference Yunovich, Kudryashov, Mamakin, Turkin, Kovalev and Manyakhin7] that minor differences in quantum efficiency (≈10% at working currents) of green LEDs based on InxGa1−xN/AlyGa1−y/GaN heterostructures with multiple quantum wells (MQW) (of Hewlett-Packard laboratories [Reference Martin8, Reference Lester, Ludowise, Killeen, Perez, Miller and Rosner9]) are connected with large differences of intensity and quantum efficiency dependence on current. These differences are caused by different distribution of effective charges in the space charge regions and role of tunnel component of currents at low voltages. In this work we study processes of aging and degradation of these LEDs at relatively high currents at room temperature.
Experimental
Green LEDs based on InxGa1−xN/AlyGa1−y/GaN heterostructures with MQWs [Reference Yunovich, Kudryashov, Mamakin, Turkin, Kovalev and Manyakhin7-Reference Lester, Ludowise, Killeen, Perez, Miller and Rosner9] were studied. They were divided on three groups (Q, P, N) of 20 samples according to a difference in quantum efficiencies (±10%) at normal currents (J = 10 mA). Properties of these groups of LEDs were studied in a wide range of J (10−7 – 3 10−1 A) in [Reference Yunovich, Kudryashov, Mamakin, Turkin, Kovalev and Manyakhin7].
Parameters of 3 LEDs chousen for careful measurements are given in Table 1. Spectral maxima (ħωmax), power efficiencies η%, the hole concentration p on the p- side of the junction, a width of the space charge region w are given in the Table 1 with parameters describing the exponential tails of the main spectral band. The long wavelength side parameter is E0; the short wavelength one is E1 = m·kT. The distributions of charges in the space charge regions NA - (w) and p-values for Q, N and P LEDs derived from dynamic capacitence measurements see Fig. 3 in [Reference Yunovich, Kudryashov, Mamakin, Turkin, Kovalev and Manyakhin7]. The LEDs Q and P had more compensated space charge regions; the LED N had the lowest value of the width of the space charge region and clearly pronounced tunnel radiation band with ħωmax ≈ eU.
Parameters of LEDs before aging.

The first experiment of LED’s aging was performed in the same conditions as in [Reference Kovalev, Manyakhin and Yunovich4-Reference Kovalev, Manyakhin, Kudryashov, Turkin and Yunovich6] that is at J = 80 mA. The LEDs at this current strongly degraded during 24 hours. That is why the conditions were choused by gradual changing of working currents in the range J = 30 ÷ 60 mA during 168 hours (see Table 2). Spectra and quantum efficiency of the LEDs were measured in the range J = 10 μA ÷ 60 mA each 24 hours.
Conditions of aging.

Experimental Results
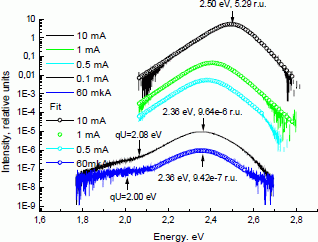
Spectra of two LEDs (N and P) before and after aging during 144 hours are given in Figs. 1 (a, b, c, d). Spectral maxima at J > 1 mA shift with current in the range ħωmax ≈ 2.36÷2.50 eV. The tunnel band at low currents had maxima according to the applied voltage: ħωmax ≈ eU =1.92÷2.13 eV. It is essential that we could trace changes of spectral form during aging. The exponents of spectral tails (E0 and E1 = m⋅kT, see a discussion lower) change during the aging. Spectral intensities at low currents fell down during aging. This is more pronounced for the LED P (the lowest current at which the spectra could be measured was 60 µA before aging and 1 mA after aging).
Spectra of LED N and their approximations before degradation.

Spectra of LED N and their approximations after degradation.

Spectra of LED P and their approximations before degradation.

Spectra of LED P and their approximations after degradation.

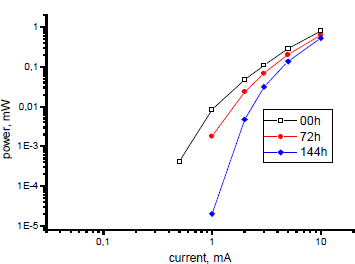
Changes of LED’s integrated external radiation power versus current are shown during aging in Figs. 2 (a, b, c). The integral intensity at normal current (J = 10 mA) for LED Q fell down of 15%, for P fell down of 2%, it has grown up for LED N of 3%. But the integral intensity at low currents fell down 10÷100 times.
These changes correlate with growing of nonradiative leakage currents at low voltages, see current-voltage characteristics J(V) after aging in Fig. 3. Before aging the J(V) curves differed slightly. The J(V) curve of a not aged LED Q is shown for a comparison.
It is to be noted that the process of aging was step like. We could see at some moment a jump of light intensity and a jump of voltage on the LED at a constant current. The light intensity changed non-monotonically: sometimes jumps were positive, sometimes negative. During the last periods of aging the intensity and voltage were unstable: sometimes properties of LEDs recovered to previous measurements.
Output power versus current in dependence on the degradation time for LED N.

Output power versus current in dependence on the degradation time for LED P.
Output power versus current in dependence on the degradation time for LED Q.

Current - voltage characteristics after aging (for LEDs N, P, Q) and without aging (for LED Q).

Discussion
The spectral changes were analyzed by a phenomenological equation with three adjustable parameters: ħωmax, E0 И E1 = m·kT, which describes the spectra with a good accuracy [Reference Yunovich, Kudryashov, Mamakin, Turkin, Kovalev and Manyakhin7]:

This approximation was used to determine electron temperatures in the active region at aging currents (see details in [Reference Kovalev, Manyakhin and Yunovich4, Reference Schwegler, Kirchner, Kamp, Ebeling, Kudryashov, Turkin, Yunovich, Link and Limmer10]). The m values were adjusted at low currents (J = 5÷10 mA) and changes of E1 then were accounted to changes of T. Temperatures T at J = 50÷60 mA were of 330÷350 K.
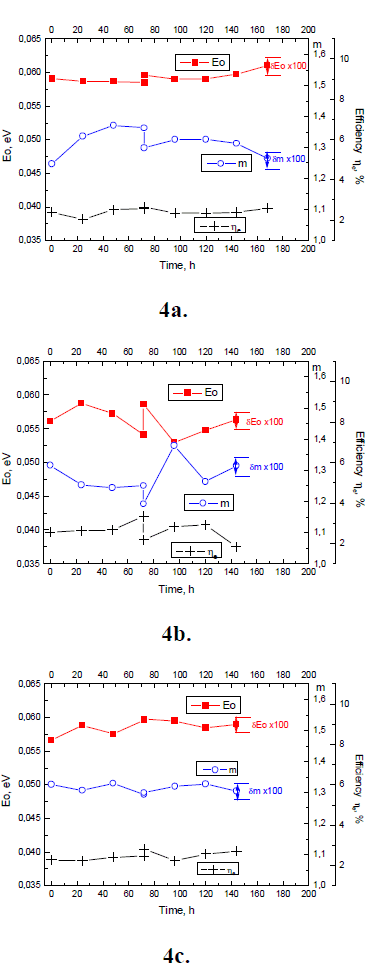
Changes of spectral parameters at J = 10 mA during the aging process are shown in Figs. 4 (a, b, c). Values of E0 were changing in the range 55 ÷ 61 meV, E1 = m⋅kT – in the range 30 ÷ 36 meV (range of m = 1.2 ÷ 1.4). These changes were of the decimal order higher then the accuracy of fitting the parameters (δE0 ≈ 0.4 meV, δE1 ≈ 0.1 meV). A distinct change of parameters is seen after a short period of reverse current (at 72 hours point, J < 1 mA, V ≈ −10 V). After this procedure spectra changed with aging more quickly.
Dependence of spectral parameters and efficiency of LEDs N (a), P (b), Q (c) on the degradation time.

It is to be noted that parameter of the low energy tails E0 may be connected with microscopic potential fluctuations in the active region [Reference Yunovich, Kudryashov, Mamakin, Turkin, Kovalev and Manyakhin7]. It has grown after the aging process. However there were small non- monotonic jumps of E0 during the aging. Spectra of green GaN- LEDs with MQWs (from Toyoda Gosei) had on the high-energy side an additional band of low intensity [Reference Kudryashov, Turkin, Yunovich, Kovalev and Manyakhin11]. This was described due to macroscopic potential fluctuation. Values of m in the fitting procedure were growing due to the additional band and changes of m were understood due to these fluctuations. We may understand changes of m during the aging in our case also due to some changes of these fluctuations.
It is necessary to explain why some defects can be formed at comparatively low temperatures 330÷350 K during degradation. We will use a model of under threshold defect’s creation by hot electrons in heterostructures with quantum wells and defects migration in the space charge region. This model was applied for GaN LED’s structures in [Reference Kovalev, Manyakhin and Yunovich4, Reference Kovalev, Manyakhin, Kudryashov, Turkin and Yunovich6]. Electrons are injected from n-GaN side into the active region with quantum wells. Electron energy over the bottom of conduction band is >> kT if the mean free path lfp is higher than the width of the active layer.
Some hot electrons at high currents do not recombine in the active region and enter compensated layer on the p-side of the active region. If the width of the compensated layer is higher than the mean free path, electrons with an electron temperature Te can create defects with a probability w ∼ exp (-ED/kTe), ED being an energy threshold for a point defect creation [Reference Manyakhin12]. In such a model it is understandable why the degradation is so sensitive to a reverse current at voltages sufficient for impact ionization (V ≈ −10 V). It is understandable why a process of aging is sensitive to the voltage eV > Eg on the structure (see Table II). It is understandable why LEDs P and Q (with a higher width of the compensated layer) degrade more quickly than LED N. Concentration of various complex defects in the compensated layers is greater than in non-compensated ones. Creation of defects by hot electrons is also more probable near the existing defects.
Created defects may migrate in the space charge region and in some cases form conductive channels, for example along dislocations. These channels will shunt the compensated region or p-n junction. The shunting channels will work as nonraditive paths of the current at low voltages. That may describe the aging in our experiments.
One of the main problems in growing of GaN structures is p-type doping. A distribution of charged acceptors NA + on the p-side of LED’s from various origins was compared in [Reference Yunovich, Kudryashov, Mamakin, Turkin, Kovalev and Manyakhin7]. Capacitance-voltage measurements had shown that Nichia’s green LEDs have higher NA + (≈ 5⋅1017 cm−3) and lower values of the space charge region width w (≈ 80 nm, that is less compensation). This may be a cause of longer times of aging (100-1000 hours [Reference Kovalev, Manyakhin and Yunovich4-Reference Kovalev, Manyakhin, Kudryashov, Turkin and Yunovich6]) in those samples than in samples studied in this paper.
Conclusions
Aging of green LEDs based on InGaN/AlGaN/GaN heterostructures with multiple quantum wells at currents J = 30 ÷ 60 mA can lead to remarkable changes of quantum efficiency at low currents during 100-200 hours. Spectral form is sensitive to the aging and it is possible to study this process by changes of exponential spectral tails.
Minor differences in LED’s parameters before aging may cause remarkable different behavior during aging. The LEDs with more compensated space charge region near the active MQW layer are more sensitive to the aging process. Quantum efficiency and spectral parameters of the LEDs change non-monotonically during aging.
Mechanism of defect’s creation by hot electrons entering the compensated layer and migration of these defects forming shunting paths for the current is proposed to explain experimental results.
Acknowledgements
Authors thank Dr. Paul Martin (HP Labs.) for sending LEDs to MSU.