I. Introduction
Private equity has become an important player in the economy. As such, its impact on firms’ environmental performance, especially in terms of greenhouse gas emissions, has drawn increased attention. Due to their opaque business operations, high-powered profit motive, and relatively short investment horizons, private equity firms’ acquisitions of high-emission (brown) assets such as fossil fuel power plants are viewed by many critics as a climate threat.Footnote 1 Meanwhile, some industry experts argue that private equity is well placed to take the lead in sustainability investing (Eccles, Shandal, Young, and Montgomery (Reference Eccles, Shandal, Young and Montgomery2022)). Despite the strong public interest, research on the environmental impact of private equity remains sparse.
We investigate the effect of private equity ownership on the emissions of environmentally harmful gases by U.S. fossil fuel power plants. The electric power sector offers a unique opportunity to study the environmental impact of private equity. First, the sector, which generated 61.5% of electricity in the United States from fossil fuels in 2020, is a major emitter. It accounted for 30.5% of carbon dioxide (CO2) emissions and 24.8% of total greenhouse gas emissions in the United States in 2020 (U.S. Environmental Protection Agency (2022)).Footnote 2 It is also an important emitter of two precursor greenhouse gases: sulfur dioxide (SO2) and nitrogen oxides (NOx, shorthand for NO and NO2), contributing 58.4% and 11.3%, respectively, of their emissions from energy-related activities in the United States in 2020.Footnote 3 Second, private equity firms have become a major owner of power plants. According to Andonov and Rauh (Reference Andonov and Rauh2024), private equity owns, on average, 14.5% of U.S. power plants with a nameplate capacity of at least 20 MW in the period from 2005 to 2020. Third, a unique feature of electricity production, that is, the homogeneity of input and output, together with the comprehensive and accurate data on power plant emissions and operations available from the regulators, allows us to separate the efficiency and nonefficiency components of environmental performance. This separation is a formidable task in other industries. Specifically, the emission intensity, defined as the volume of emissions scaled by electricity produced and referred to as the output emission rate, can be decomposed into two parts: the heat rate and the input emission rate. The former is the heat input per unit of electricity output, which inversely measures a plant’s production or thermal efficiency. The latter is measured by the volume of emissions scaled by the heat input, which captures the effectiveness of a plant’s emission control system.
We hypothesize that private equity buyouts should lead to a reduction in the heat rate, but their effect on the input emission rates is generally more ambiguous. Our hypothesis builds on a simple logic: while profit-maximizing private equity firms may have mixed incentives regarding socially beneficial but privately costly investments in the reduction of input emission rates, they should have a strong incentive to reduce the heat rate even in the absence of a prosocial preference because a lower heat rate means lower fuel costs. We also hypothesize that environmental benefits should be larger for deals backed by pro-ESG (environmental, social, and governance) private equity firms because of their prosocial motives.
To test these hypotheses, we obtain data on annual CO2, SO2, and NOx emissions and operations of fossil fuel power plants from the Clean Air Markets Division (CAMD) of the U.S. Environmental Protection Agency (EPA). Our sample includes 1,340 power plants with 4,181 unique electricity generating units (EGUs) from 2003 to 2021. The gross electricity generation by the plants in our sample totaled 2.04 million gigawatt-hours (GWh) in 2021, which was 80% of the U.S. electricity generation from fossil fuels in that year. For a subset of plants, we also obtain data on fuel cost, electricity price, operation & maintenance (O&M) expenditures, and capital expenditures related to pollution abatement from the U.S. Energy Information Administration (EIA). By merging plant owners with targets of private equity buyout deals from PitchBook, we identify 137 power plants bought out by private equity firms for the first time. We focus on the first buyout deals because the private equity treatment effect may be diminished in subsequent deals.
We analyze the impact of private equity buyouts by running stacked difference-in-differences (DiD) regressions based on matched samples. To understand the nature of the potential selection effect, we first analyze private equity firms’ choice of buyout targets. We find that the buyout probability is positively related to plant electricity generation capacity and negatively related to plant age, but it is not significantly related to the emission rates or the heat rate. Based on these results, and to further enhance comparability, we match each acquired plant to a control plant based on year, state, primary fuel type, and a Mahalanobis distance measure calculated using log capacity, capacity factor, log plant age, and the level and slope of log heat rate. Using this procedure, we identify 102 pairs of acquired and control plants. We stack all the pairs, referred to as cohorts, and run DiD regressions, controlling for both year-cohort and plant-cohort fixed effects. This approach allows us to exploit within-plant variation in each cohort, which largely mitigates the concern about unobservable differences between acquired and control plants driving our results.
We find strong evidence in support of our hypothesis. Our DiD analysis at the EGU level shows that, on average, the CO2 and NOx output emission rates decline by 4.2% and 9.0%, respectively, following private equity buyouts. Given the large emission volumes of the U.S. electric power sector (1,439 million metric tons for CO2 and 733 thousand tons for NOx in 2020, according to U.S. Environmental Protection Agency (2022)), the economic magnitudes of these estimates are large. Importantly, the decline in the CO2 output emission rate results almost entirely from a 4.0% decrease in the heat rate. In fact, our baseline analysis finds no statistically significant buyout effect on any input emission rate. Furthermore, the plant-level DiD analysis shows that while fuel costs per MWh of electricity output decline by 7.3% after buyouts, expenditures related to pollution abatement do not change significantly. These results are consistent with our hypothesis that while private equity firms are keen on increasing production efficiency, they generally do not have strong incentives to make costly investments to improve emission control.
To test whether the beneficial effects described previously are unique to first buyouts backed by private equity, we conduct the same analysis for M&A deals not backed by private equity as well as secondary private equity buyout deals. We do not find any significant change in either production efficiency or emission rates following those deals.
Our results confirm the importance of private equity firms’ ESG preferences in driving the buyout effect. While buyouts backed by private equity with no stated preference for ESG investments are followed by a decline of 2.7% in the CO2 output emission rate, which is almost entirely attributable to the decline in the heat rate, the decline in this emission rate following buyouts backed by private equity with such a preference is larger by a factor of 3. Buyouts backed by pro-ESG private equity are also associated with a 16.6% decline in NOx input emission rate. Furthermore, plants acquired by pro-ESG private equity from non-ESG private equity show a marginal improvement in the CO2 input emission rate after the SBO. These results suggest that deals backed by pro-ESG private equity generate larger environmental benefits not only through greater increases in production efficiency but also through improvement in emission control.
We also explore other potential mechanisms underlying the private equity buyout effects. Regulatory and social environments appear to play an important role. The efficiency gains following private equity buyouts are concentrated in target plants operating in the deregulated and thus more competitive markets, which are characterized by the existence of an independent system operator (ISO) serving as the balancing authority. The improvement in environmental performance is also more significant in the states where public support for government action in lowering power plant emissions is above the median level across states. In addition, it is more significant in acquired plants with above-median nameplate capacity, plants acquired through corporate divestiture deals, and plants held by the acquiring private equity firms for more than 4 years. We also find that private equity buyouts have no significant effect on the scales of input, output, and operating time and that controlling for the output scale has little impact on the estimated buyout effects on production efficiency and emission rates.
The EGU-level data allow us to investigate whether the improvement in production efficiency arises from within-EGU variation or changes in the EGU composition. We find that for coal- or oil-fired power plants, which constitute a small fraction of our sample, the efficiency improvement arises mainly from changes in EGU composition. In contrast, for natural gas-fired plants, the improvement comes almost entirely from increased efficiency of existing EGUs.
We conduct a series of robustness tests. Specifically, we use a 7-year instead of 11-year event window, a 1-to-4 instead of 1-to-1 treatment-to-control ratio, and three alternative sets of matching variables. Our results remain largely the same in all these alternative tests. To further address the concern about the sensitivity of our results to the matching methods, we also perform panel DiD regressions using the full sample, controlling for a variety of fixed effects. These results are slightly stronger than those from the stacked DiD regressions, suggesting that our baseline estimates are conservative.
Our study is one of the few recent studies on the effect of private equity ownership on environmental performance.Footnote 4 Shive and Forster (Reference Shive and Forster2020) find that public firms and private equity-backed private firms are more likely to pollute than independent private firms, while there is no significant difference between the pollution levels of the former two groups. Bellon (Reference Bellon2025) studies the effect of private equity ownership on toxic pollution released by U.S. oil and gas companies. He finds that private equity buyouts reduce pollution of the target firm when environmental liability risks are high but increase pollution when such risks are low. Kumar (Reference Kumar2024) finds that private equity acquisitions of fossil fuel power plants facilitate the development of solar energy. Our work differs from these studies by focusing on a homogeneous sample of electricity-generating plants and examining the differential impacts of private equity ownership on the efficiency and nonefficiency components of environmental performance. We also show a rich set of cross-sectional variation in private equity buyout effects, especially between deals backed by pro-ESG and non-ESG firms.
Our article is related to two studies contemporaneous with ours on ownership changes in the electricity sector. Andonov and Rauh (Reference Andonov and Rauh2024) document a significant increase in the power plant ownership by private equity, institutional investors, and foreign corporations in the United States (from 7% in 2005 to 24% in 2020). They show that these investors facilitate energy transition in deregulated markets by creating more efficient plants and improving the efficiency of acquired plants. Demirer and Karaduman (Reference Demirer and Karaduman2024) study the mergers and acquisitions of U.S. power plants and document a 2% average increase in efficiency for acquired plants. Our article differs from these studies in several important aspects. First, while these studies focus primarily on production efficiency, we focus on the environmental effect of power plant ownership changes. Although production efficiency is an important determinant of environmental performance, the relation is not one-to-one, as we show for SO2 and NOx output emission rates and for buyouts backed by pro-ESG private equity firms. Second, while these studies do not distinguish between private equity-backed buyouts and other M&As, we focus on buyouts backed by private equity, which are at the center of public debates. Our stacked DiD analysis shows that private equity-backed buyouts lead to a production efficiency increase twice as high as the estimate reported by Demirer and Karaduman (Reference Demirer and Karaduman2024), while M&As not backed by private equity have no significant effect.
Our article contributes to the growing literature on the interaction between finance and ESG performance. Previous studies have examined various channels through which finance can affect firms’ environmental behavior, including cost of capital (Heinkel, Kraus, and Zechner (Reference Heinkel, Kraus and Zechner2001), Pástor, Stambaugh, and Taylor (Reference Pástor, Stambaugh and Taylor2021)), financial constraints (Bartram, Hou, and Kim (Reference Bartram, Hou and Kim2022), Xu and Kim (Reference Xu and Kim2022)), shareholder engagement and activism (Dimson, Karakaş, and Li (Reference Dimson, Karakaş and Li2015), Akey and Appel (Reference Akey and Appel2019)), and lender monitoring (Houston and Shan (Reference Houston and Shan2021)). Duchin, Gao, and Xu (Reference Duchin, Gao and Xu2025) study the asset market for pollutive plants, focusing primarily on nonfinancial buyers and sellers in manufacturing industries. They find that pollution levels of those plants do not decrease after they are divested. Hartzmark and Shue (Reference Hartzmark and Shue2023) show that relaxing financial constraints of brown firms has large environmental benefits, which is consistent with our finding of a positive buyout effect on power plant environmental performance.
Our study also contributes to the literature on the real effects of private equity ownership. The post-buyout increase in production efficiency we document resonates with the positive efficiency effects of private equity ownership found in the literature (e.g., Davis, Haltiwanger, Handley, Jarmin, Lerner, and Miranda (Reference Davis, Haltiwanger, Handley, Jarmin, Lerner and Miranda2014)). Our finding of a post-buyout decrease in emission intensity adds to the literature on the effects of private equity on nonfinancial stakeholders. The evidence on this aspect of private equity is more mixed (see the literature review by Sorensen and Yasuda (Reference Sorensen, Yasuda, Eckbo, Phillips and Sorensen2023)). For example, Gupta, Howell, Yannelis, and Gupta (Reference Gupta, Howell, Yannelis and Gupta2024) find that private equity ownership of nursing homes reduces the quality of patient care, while Gao, Kim, and Sevilir (Reference Gao, Kim and Sevilir2025) find that health care quality does not deteriorate at hospitals acquired by private equity. Eaton, Howell, and Yannelis (Reference Eaton, Howell and Yannelis2020) find that private equity buyouts in higher education lead to worse educational outcomes and higher school profits.
II. Hypotheses
Since the volume of emissions naturally increases with production scale, to allow more meaningful comparisons between plants of different sizes, it is useful to normalize emissions by output size. We use emissions scaled by electricity produced, referred to as the output emission rate, as our measure of emission intensity. Previous studies have used emissions scaled by sales or dollar values of output to measure emission intensity (e.g., Shive and Forster (Reference Shive and Forster2020), Shapiro (Reference Shapiro2020), Bolton and Kacperczyk (Reference Bolton and Kacperczyk2021), and Hartzmark and Shue (Reference Hartzmark and Shue2023)). Our quantity-based measure has the advantage of not being affected by output prices, which can be influenced by firms’ market power.
How will private equity ownership affect emission intensity? On the one hand, a lower emission intensity can reduce the cost of capital by reducing a firm’s exposure to environmental risk; it can also improve a firm’s reputation and social capital.Footnote 5 Therefore, private equity firms may have an incentive to reduce emission intensity for both financial and nonfinancial considerations. On the other hand, measures used for emission control and mitigation are costly. Thus, private equity firms may have an incentive to cut them back to improve short-term profitability, especially because they typically do not hold the plants for a long time. Which of these two forces is stronger is an empirical question.
However, sharper predictions can be made if we look further into the components of the emission intensity. The output emission rate of a gas can be expressed as the product of its input emission rate and the heat rate, the former defined as the emissions per unit of heat input and the latter as the heat input per unit of electricity produced:

where the heat input is equal to the quantity of fuel used in electricity production times the fuel’s heat content. It follows that the log output emission rate can be fully decomposed into two parts:

The heat rate inversely measures the thermal efficiency of the electricity production process, which can be viewed as the efficiency component of emission intensity. The input emission rate inversely measures the effectiveness of emission control, which can be viewed as the nonefficiency component of emission intensity. To reduce the output emission rate, a firm can invest either in measures and technologies that improve production efficiency or in those that reduce emissions per unit of heat input.
From the private equity firm’s perspective, the two alternative approaches have very different profit implications. The reduction of the heat rate means a lower fuel consumption rate and thus lower production costs, which improves not only a plant’s environmental performance but also its gross margin. In other words, it is profit-boosting. Since the societal and private benefits are well aligned in this component of environmental performance, even if a private equity firm has no prosocial preference, it should still have a strong incentive to reduce the heat rate. Given that private equity firms are known for their ability to improve operational efficiency, we expect the heat rate to decline after they take over. In contrast, investments in measures to reduce the input emission rate, while socially beneficial, are expenditures that reduce short-term profits (i.e., profit-draining). Therefore, private equity firms may not be keen on undertaking such efforts, unless they have a strong commitment to social responsibility. Based on these considerations, we hypothesize that private equity buyouts should, on average, lead to a reduction in the heat rate, but their effect on the input emission rate is generally ambiguous.
For the subset of private equity firms that embrace ESG objectives in their investment policy, we expect their prosocial preferences to reinforce their profit motive to bring about more significant reductions in the heat rate. Furthermore, it is likely that they are more willing to spend resources on improving emission control, which leads to further reductions in emission intensities via lower input emission rates.
III. Data and Summary Statistics
A. Sample Construction
1. Power Plant Emissions and Operating Data
We obtain the annual emissions and operating data for U.S. fossil fuel power plants from the Clean Air Markets Division (CAMD) of the EPA. Title 40 Code of Federal Regulations Part 75 established requirements for large electricity generating units with nameplate capacity greater than 25 MW burning fossil fuel(s) for sale to continuously measure emissions and report them, along with operating data, to the EPA. EPA and state agencies use these data to assess compliance with emission trading programs and other air quality programs. These data, collectively referred to as CAMD’s Power Sector Emissions Data, are publicly available on the EPA website.
The CAMD data are at the electricity generating unit (EGU) level. An EGU is a combination of one or more generators and associated apparatus within a power plant for which input, output, and emissions can be separately metered. An average power plant (or facility) in our sample has three EGUs. The key data items include the raw quantities of carbon dioxide (CO2), sulfur dioxide (SO2), and nitrogen oxides (NOx) emissions; heat input; electricity generated (referred to as Gross Load in the database); and the owner and primary fuel type(s) of each unit.Footnote 6 We exclude unit-years with missing emissions or electricity output data (including those with a recorded quantity of 0). Most observations with missing electricity data are about units generating steam instead of electricity. A very small number of units generate simultaneously both steam and electricity. We exclude those units as well to maintain the homogeneity of output.
While we do most of our analysis at the EGU level, we also conduct some analysis at the plant level, and our matching of the acquired and control plants is based on plant-level data. We aggregate the data from the EGU to the plant level using the facility ID associated with each EGU. We exclude plant-years with aggregate electricity output less than 1 GWh. We record plant ownership at the year-end and exclude units/plants with multiple owners at a given time (about 6% of the observations).Footnote 7 Since the name of the same plant owner may be recorded slightly differently in different years, we manually create an owner ID that is consistent across years. Although emissions data are available from 1995 to 2021, the ownership information is only available since 2003. Thus, our sample period is from 2003 to 2021.
Our final sample includes 4,181 unique EGUs in 1,340 plants owned by 1,007 owners, with a total of 56,575 annual observations. In 2021, the gross electricity generation by the plants in our sample is 2.04 million GWh. According to U.S. Energy Information Administration (2022), the net electricity generation (i.e., generation excluding electricity used for power plant operations) from fossil fuels was 2.51 million GWh in 2021. Assuming a commonly used net-to-gross electricity generation ratio of 0.98, our sample covers 80% of the U.S. electricity generation from fossil fuels in 2021.
2. Power Plant Financial Data
We obtain limited plant-level financial data for a subset of plants from Form EIA-923 filings available from the EIA website. Starting from 2008, EIA-923 contains (in Schedule 2) transaction-level data on fuel costs, which include all costs incurred in the purchase and delivery of the fuel to the plant. Thermoelectric power plants with a total steam turbine capacity of 100 MW or greater are also required to report (in Schedule 8) the total operation and maintenance (O&M) expenditures associated with collection and disposal of combustion by-products (such as fly and bottom ash) and related pollution abatement activities. These plants are also required to report annual capital expenditures on pollution abatement, such as the expenditures on new structures and/or equipment purchased to reduce, monitor, or eliminate airborne or waterborne pollutants. Starting in 2011, nonutility power plants, defined as plants that, instead of selling electricity at regulated rates, sell electricity in wholesale markets or directly to consumers at market prices, are required to report quantity and revenues of electricity sales in wholesale markets. This allows us to calculate the electricity wholesale price for such plants.
3. Private Equity Buyout Data
We construct our sample of power plants bought out by private equity using the December 2021 version of the PitchBook database. We focus on the completed buyout/LBO deals in the Private Equity deal class where the target firm is headquartered in the United States. We first match the target companies to plant owners by name using a fuzzy matching algorithm. We then manually check the algorithm-generated matches to identify the correct matches, using deal- and plant-related information gathered from both databases and the Internet. We read the PitchBook deal synopses and related news articles from the Internet to identify the plant(s) sold in each deal, as some deals may include only a subset of an owner’s plants. A plant can be bought by a private equity firm and sold to another multiple times. To examine the private equity treatment effect, we focus on a plant’s first buyout deal in our baseline analysis, as the effect of subsequent ones is likely diminished. For comparison, we also collect data on subsequent buyout deals, referred to as secondary buyouts (SBOs).
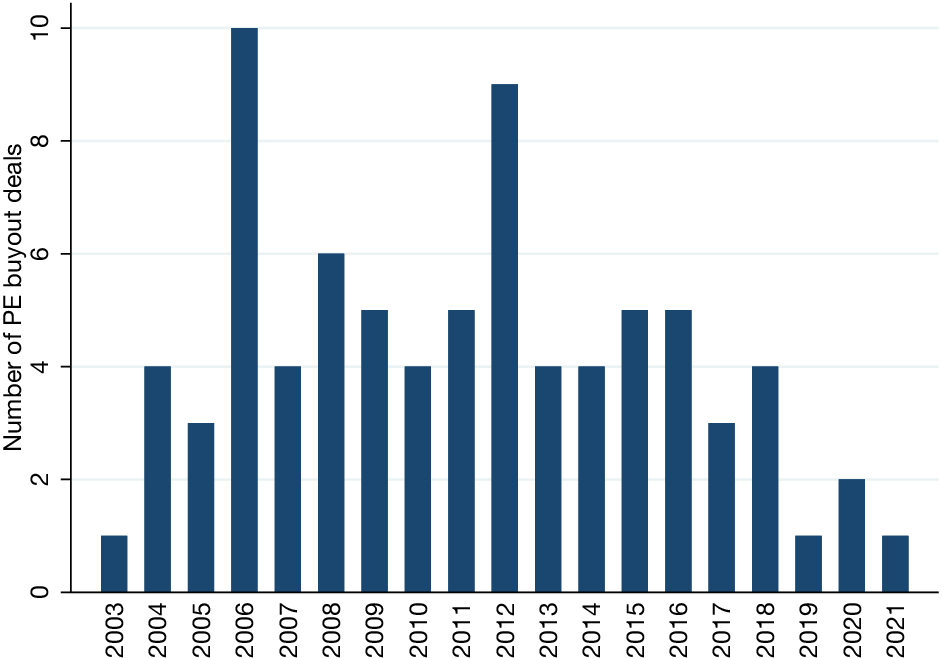
Among the 1,340 power plants in our emissions sample, we identify 137 that are bought out by private equity for the first time, through 80 deals involving 90 plant owners. Figure 1 shows the breakdown of the number of such deals by year. The first deal occurred in 2003, which coincides with the start year of our emissions data.Footnote 8 We also identify 22 secondary buyout deals involving 30 plants.
Figure 1 shows, year by year, the number of completed private equity buyout deals in which the target firm is an owner of an electric power plant in our emissions data set. If a firm is acquired by private equity in multiple deals, we only count the first deal.

FIGURE 1 Long description
The vertical Y-axis is labeled Number of P E buyout deals with increments of 2 from 0 to 10. The horizontal X-axis lists years from 2003 to 2021. The data is represented by dark blue vertical bars for each year.
* 2003: 1 deal
* 2004: 4 deals
* 2005: 3 deals
* 2006: 10 deals (the highest peak)
* 2007: 4 deals
* 2008: 6 deals
* 2009: 5 deals
* 2010: 4 deals
* 2011: 5 deals
* 2012: 9 deals (a secondary peak)
* 2013: 4 deals
* 2014: 4 deals
* 2015: 5 deals
* 2016: 5 deals
* 2017: 3 deals
* 2018: 4 deals
* 2019: 1 deal
* 2020: 2 deals
* 2021: 1 deal
The chart shows significant volatility with major peaks in 2006 and 2012, followed by a general decline in deal volume toward 2021.
4. Mergers and Acquisitions Data
To compare private equity-backed buyout deals with mergers and acquisitions (M&As) deals not backed by private equity, we construct a sample of power plants acquired by nonprivate equity firms using the M&A database from PitchBook. Because PitchBook’s coverage of M&A deals is not as complete as their coverage of private equity buyout deals, we supplement it with the M&A database from S&P Capital IQ. To avoid confounding the effect of PE buyouts with mergers, we require that merger deals do not occur within 5 years before or after a private equity buyout. We also require that at least 50% of the target’s ownership share is acquired by the acquirers and that the deal is recorded as being completed. Using the procedures described previously, we identify a total of 66 unique M&A deals involving 111 power plants in our sample.
B. Variables and Summary Statistics
The EGU electricity generation capacity is measured in megawatts (MW). It represents the maximum electricity output an EGU is capable of producing on a steady-state basis. The capacity factor is a measure of an EGU’s actual utilization relative to its full capacity. The raw emission quantities are measured in short tons, the heat input in million British thermal units (MMBtu), and the electricity output in megawatt hours (MWh). We convert them into metric tons, billion British thermal units (BBtu), and gigawatt hours (GWh), respectively.Footnote 9 We scale the emissions by electricity produced to obtain our output emission rates CO2/E, SO2/E, and NOx/E, measured in kilograms (kg) per MWh. We scale the emissions by heat input to obtain our input emission rates CO2/H, SO2/H, and NOx/H, measured in kilograms per MMBtu. We also scale the heat input by the electricity produced to obtain the heat rate H/E, expressed in MMBtu per MWh (or equivalently, Btu/Wh). Because the emission rates and heat rate variables are highly skewed, we take the natural log of them in most of our analysis. One additional advantage of using the log rates is that it allows an additive decomposition of the output emission rate, as shown in equation (2). We also use the raw emissions and heat rates in some of our analyses, in which case the rates are winsorized at the 1st and 99th percentiles to mitigate the effect of outliers.
We sum the input, output, and emissions across EGUs to obtain quantities at the plant level and calculate the plant-level ratios accordingly. We measure plant age by the number of years since the start of commercial operation (based on the earliest start date across all EGUs in the plant). We drop the first operation year of each plant, as it is generally not a full year. We do not drop the first operation year of EGUs subsequently added to an existing plant, as such additions represent a plant expansion.
Fuel costs reported in Form EIA-923 are expressed in cents per MMBtu of heat content. The number of plants reporting at least some transaction-level fuel cost data varies from over 700 in 2008 to over 500 in 2021. Many plants report the quantity of each fuel purchase but not the cost. To expand the sample coverage, we first estimate the average cost per MMBtu of each fuel type in each year using all transactions with nonmissing cost data, weighted by heat contents obtained in each transaction. We then calculate the average fuel cost per MMBtu at the plant-year level, also weighted by heat content obtained in each transaction, using the imputed fuel cost per MMBtu when necessary.Footnote 10 We multiply the fuel cost per MMBtu by the heat rate to obtain fuel cost per MWh electricity generated.
Similarly, we normalize the annual O&M and capital expenditures related to pollution abatement by electricity generated. We set these expenditures to 0 for plants that file Schedule 8 of Form EIA-923 but do not report such expenditures, and we treat them as missing for plants that do not file this schedule in a given year. For plants with revenues from electricity sales in wholesale markets, we calculate the electricity price by dividing the revenues by the sale volume. All financial variables are expressed in dollars per MWh.
The Appendix summarizes the variable definitions. Panels A and B of Table 1 show the summary statistics at the EGU and plant levels, respectively. The average plant in our sample produces 1,988 GWh of electricity annually, with the largest producing 25,400 GWh. The average plant is 27 years old, with the oldest one being 86 years old. 73% of EGUs use natural gas as the primary fuel, 21% use coal, and only 6% use oil.

TABLE 1 Long description
Panel A. Summary Statistics at the E G U Level. This panel contains 30 rows of variables across 6 statistical columns: Mean, Std. Dev., Min, p50, Max, and Count. Key variables include:
* Capacity: Mean 237.73, Std. Dev. 209.91, Count 56,567.
* Electricity: Mean 681.21, Std. Dev. 1,094.62, Count 56,575.
* Age: Mean 23.19, Std. Dev. 18.03, Max 75.00.
* C O sub 2 / E: Mean 676.16, Std. Dev. 219.79.
* S O sub 2 / E: Mean 0.88, Std. Dev. 2.25.
* N O sub x / E: Mean 0.67, Std. Dev. 0.92.
* Fuel Dummies: D Gas 0.73, D Coal 0.21, D Oil 0.06.
Panel B. Summary Statistics at the Plant Level. This panel contains 32 rows of variables. Key variables include:
* Capacity: Mean 693.69, Std. Dev. 726.75, Count 19,386.
* Electricity: Mean 1,987.60, Std. Dev. 3,056.51, Count 19,390.
* Age: Mean 27.43, Std. Dev. 19.75, Max 86.00.
* C O sub 2: Mean 1,411,444.01, Std. Dev. 2,503,767.54.
* S O sub 2: Mean 3,064.36, Std. Dev. 10,326.60.
* N O sub x: Mean 1,250.35, Std. Dev. 3,134.04.
* N Unit: Mean 2.92, Std. Dev. 2.31, Max 24.00.
* Price: Mean 58.51, Std. Dev. 54.12, Count 3,436.
Logarithmic transformations for emission intensities (ln C O sub 2 / E, ln S O sub 2 / E, etc.) are provided in both panels, showing negative mean values for S O sub 2 and N O sub x ratios.
IV. Empirical Methodology
Following Gormley and Matsa (Reference Gormley and Matsa2011), Fracassi, Previtero, and Sheen (Reference Fracassi, Previtero and Sheen2022), and Sheen, Wu, and Yuan (Reference Sheen, Wu and Yuan2025), we run stacked DiD regressions using matched samples to analyze the private equity buyout effect on emissions. Recent studies (e.g., Baker, Larcker, and Wang (Reference Baker, Larcker and Wang2022)) show that this method can estimate the treatment effect efficiently while circumventing the problems introduced by staggered treatment timing and treatment effect heterogeneity. We acknowledge that our approach does not fully resolve selection concerns arising from unobservables.
A. Stacked DiD Regressions
We match each private equity-acquired plant to a control plant based on year, state, primary fuel type, and a Mahalanobis distance measure (explained hereafter). Each pair of matched treated and control plants forms a cohort, and all cohorts are stacked together for the DiD regressions. The baseline specification for our EGU-level regressions is as follows:

where
$ {y}_{i,j,c,t} $
 is the outcome variable for EGU
$ i $
 of plant
$ j $
 belonging to cohort
$ c $
 in year
$ t $
 ;
$ {Buyout}_{j,c} $
 and
$ {Post}_{t,c} $
 are the dummy variables indicating the acquired plants and post-buyout years (after the year 0), respectively;
$ {\lambda}_{j,c} $
 and
$ {\sigma}_{t,c} $
 are the terms capturing plant and year fixed effects within each cohort, respectively. The plant-cohort fixed-effects term
$ {\lambda}_{j,c} $
 captures the difference in the outcome variables between the treated and control plants due to time-invariant plant characteristics within a cohort, while the year-cohort fixed-effects term
$ {\sigma}_{t,c} $
 captures the common variation within each year of a cohort. The main outcome variables of interest include the output and input emission rates and the heat rate. We cluster the standard errors by plant owner. If private equity buyout leads to a decline in an outcome variable, the coefficient on the interaction term
$ Buyout\times Post $
 ,
$ \beta $
 , should be significantly negative. Note that the dummy variables
$ Buyout $
 and
$ Post $
 themselves are subsumed because we control for both plant-cohort and year-cohort fixed effects. Considering the typical holding period of private equity firms, we adopt an 11-year buyout event window for our baseline analysis, from 5 years before to 5 years after the event year (i.e., year 0).
We run similar regressions using the plant-level data, with the observations weighted by the number of EGUs that a plant has.
B. Matching
The stacked DiD regressions identify the treatment effect only if the control group and the treatment group follow parallel trends. This assumption is more likely to hold if the two groups are observably similar. The purpose of the matching procedure is to construct a sample of control plants that are as close as possible to those that are acquired by private equity based on observables.
The pool of potential control plants includes all plants that have never been acquired by private equity. To avoid potential contaminating effects caused by other merger events, we also exclude plants that are acquired by nonprivate equity firms during our sample period from this pool. We require the control and treated plants to be located in the same state because emissions may be affected by state-specific emission and energy policies. We also require them to use the same type of primary fuel because technologies may progress at different paces for different fuel types. Among the plants that satisfy these conditions, we select (with replacement) for each acquired plant a control plant based on the shortest Mahalanobis distance. This distance measure accounts for covariance among the matching variables, and it is calculated using plant characteristics observed in the year before the buyout.
To determine the selection of variables used in the calculation of the distance measure, and to shed light on private equity firms’ motives in acquiring power plants, we estimate several linear probability models to examine private equity’s choice of buyout targets using annual plant-level data. The dependent variable equals 1 if a plant is bought out by private equity in a given year, and 0 otherwise. All explanatory variables are lagged by 1 year. Because we are interested in the first buyout deal for each target plant, we drop the observations after a plant is bought out by a private equity firm for the first time (i.e., we do not model the probability that an acquired plant is subsequently bought out by another private equity firm). We control for year fixed effects in all models and cluster the standard errors by plant owner.
Table 2 shows the estimation results for eight model specifications. In the first five specifications, we consider only explanatory variables available in the CAMD database, including the log output emission rates of CO2, SO2, and NOx, log heat rate, log plant age and log nameplate capacity, capacity factor, and three primary fuel dummies (with Other being the base group). The results consistently show that the buyout probability is negatively related to log plant age and positively related to log capacity, suggesting that private equity is more interested in new and large plants. This does not support the idea that private equity extends the lifespan of old fossil plants by buying those plants from incumbents. None of the output emission rates are significantly related to the buyout probability, irrespective of whether they enter the model jointly (column 1) or separately (columns 2–5). Nor is the heat rate or the capacity factor.Footnote 11 These results suggest that private equity does not filter targets by emission intensities of environmentally harmful gases, nor does it target plants struggling with low efficiency.

TABLE 2 Long description
The table presents regression coefficients and t-statistics for eight models. The dependent variable is Buyout.
Independent variables include:
* ln(C O sub 2 / E): Coefficients range from -0.038 to 0.244, all statistically insignificant.
* ln(S O sub 2 / E): Coefficients range from -0.013 to 0.056, all statistically insignificant.
* ln(N O sub x / E): Coefficients range from 0.031 to 0.108, all statistically insignificant.
* I S O: Significant positive coefficient of 0.455 in model 6.
* ln(FuelCost / E): Negative coefficients in models 7 and 8, statistically insignificant.
* O M / E: Significant negative coefficient of -0.046 in model 8.
* Capx / E: Significant negative coefficient of -0.008 in model 8.
* ln(Age): Consistently negative coefficients across all models, significant at the 5 percent or 1 percent level in models 1 through 7 (e.g., -0.271 in model 1).
* ln(Capacity): Significant positive coefficients in models 1 through 6 (e.g., 0.164 in model 1).
* CapFactor: Significant negative coefficients in model 7 (-0.882) and model 8 (-1.639).
* D(Coal), D(Gas), and D(Oil): Dummy variables for fuel types, generally statistically insignificant.
Summary statistics at the bottom:
* No. of obs.: Decreases from 18,181 in models 1-5 to 6,805 in model 8.
* R-squared: Ranges from 0.007 to 0.011.
* Year F E: Included (Yes) for all models.
Andonov and Rauh (Reference Andonov and Rauh2024) find that ownership changes are more frequent in deregulated than in regulated electricity markets. Their broadest measure of whether a market is deregulated is a dummy variable, indicating whether it is operated by an Independent System Operator (ISO) serving as a balancing authority. Consistent with their finding, column 6 shows that the ISO dummy positively predicts private equity buyout.Footnote 12 In columns 7 and 8, we further examine whether financial variables, including fuel costs, O&M, and capital expenditures related to pollution abatement, affect the buyout probability. Column 8 shows that buyout probability is negatively related to expenditures on pollution abatement. This result should be interpreted with caution, as the sample size decreases by almost two-thirds upon the inclusion of these variables.
The full-sample results in columns 1–5 of Table 2 suggest that the treatment and control groups in our DiD analysis should be matched on log plant age and log capacity. Columns 6 and 8 suggest that one may also consider matching on whether a plant operates under the ISO regime and on pollution abatement expenditures; however, doing so would result in a smaller sample for our DiD analysis. Therefore, we do not include these variables in our baseline matching scheme.Footnote 13 To enhance the comparability, we also consider the capacity factor, the logarithm of the average heat rate, and the average change in the log heat rate in the years (up to three) prior to the buyout in our distance measure. The heat rate not only measures a plant’s thermal efficiency but also indirectly captures a plant’s emissions intensity, as it is positively related to output emission rates for all gas types. We require both the treated and control firms to have data for at least the 2 years before the buyout and the first year after the buyout. About 105 acquired plants satisfy this requirement, and 102 of them are successfully matched.
Table 3 presents the comparison of the treatment and control groups in the year before the buyout for 102 acquired plants that are successfully matched based on our criteria, each on average with three EGUs. It shows that the two groups are comparable in all potentially relevant dimensions that are observable. None of the variables shows a statistically significant difference between the two samples. This provides the foundation for our match-based DiD analysis.

TABLE 3 Long description
The table contains five columns: Variable, Mean (Treatment), Mean (Control), Difference, and t-Stat. There are 102 observations for both groups.
* Capacity: Treatment 674.249, Control 595.006, Difference 79.243, t-Stat 1.05.
* Electricity: Treatment 1,391.702, Control 1,222.775, Difference 168.927, t-Stat 0.68.
* Age: Treatment 17.824, Control 16.814, Difference 1.010, t-Stat 0.44.
* C O sub 2 / E: Treatment 584.425, Control 597.426, Difference minus 13.000, t-Stat minus 0.50.
* S O sub 2 / E: Treatment 0.203, Control 0.336, Difference minus 0.133, t-Stat minus 0.78.
* N O sub x / E: Treatment 0.370, Control 0.281, Difference 0.089, t-Stat 1.28.
* H / E: Treatment 10.086, Control 10.318, Difference minus 0.232, t-Stat minus 0.82.
* C O sub 2 / H: Treatment 57.012, Control 57.192, Difference minus 0.180, t-Stat minus 0.13.
* S O sub 2 / H: Treatment 0.019, Control 0.032, Difference minus 0.013, t-Stat minus 0.77.
* N O sub x / H: Treatment 0.033, Control 0.025, Difference 0.008, t-Stat 1.44.
* I S O: Treatment 0.804, Control 0.802, Difference 0.002, t-Stat 0.03.
* CapFactor: Treatment 0.576, Control 0.585, Difference minus 0.009, t-Stat minus 0.37.
* D (Gas): Treatment 0.922, Control 0.922, Difference 0.000, t-Stat 0.00.
* D (Coal): Treatment 0.069, Control 0.069, Difference 0.000, t-Stat 0.00.
* D (Oil): Treatment 0.010, Control 0.010, Difference 0.000, t-Stat 0.00.
* D (Other): Treatment 0.000, Control 0.000, Difference 0.000.
* N_Unit: Treatment 2.971, Control 3.196, Difference minus 0.225, t-Stat minus 0.80.
* FuelCost / E: Treatment 48.042, Control 54.375, Difference minus 6.332, t-Stat minus 1.42.
* O M / E: Treatment 0.074, Control 0.758, Difference minus 0.684, t-Stat minus 1.05.
* Capx / E: Treatment 0.052, Control 0.193, Difference minus 0.141, t-Stat minus 1.01.
* Price: Treatment 57.914, Control 55.550, Difference 2.365, t-Stat 0.20.
V. Private Equity Buyout Effects: Baseline Results
In this section, we present the baseline results on the effects of private equity buyouts on power plant gas emission rates and production efficiency.
A. Baseline Stacked DiD Regression Results
Table 4 shows the results of the baseline stacked DiD regressions at the EGU level. In Panel A, we use the logarithms of output emission rates (columns 1–3), heat rate (column 4), and input emission rates (columns 5–7) as the dependent variables. In Panel B, we use the winsorized raw rates as the dependent variables. We include the log EGU age, which is unlikely to be affected by the buyout, as a control variable.

TABLE 4 Long description
Panel A presents results for Log Emission Rates and Heat Rate. The primary variable, Post times Buyout, shows significant negative coefficients for ln(C O sub 2/E) at -0.042, ln(N O sub x/E) at -0.090, and ln(H/E) at -0.040. Other variables like ln(C O sub 2/H), ln(S O sub 2/H), and ln(N O sub x/H) show no statistically significant change. ln(Age) is positively correlated with ln(N O sub x/E) at 0.659 and ln(N O sub x/H) at 0.626.
Panel B presents results for Winsorized Raw Emission Rates and Heat Rate. Post times Buyout shows significant negative coefficients for C O sub 2/E at -22.009, N O sub x/E at -0.079, H/E at -0.358, and N O sub x/H at -0.005. A small positive significant effect is noted for S O sub 2/H at 0.009.
Both panels include 6,076 observations across all 7 columns. R-squared values range from 0.816 to 0.933 in Panel A and 0.825 to 0.906 in Panel B. All models include Year-cohort F E and Plant-cohort F E.
The first three columns of Panel A show that the log output emission rates of both CO2 and NOx decrease significantly after the private equity buyout. The DiD coefficient on the interaction term
$ Post\times Buyout $
 is −0.042 (with a t-stat of −3.44) in column 1, suggesting that buyouts on average lead to a decline of the CO2 output emission rate by 4.2%.Footnote
14 Similarly, the estimate of the same coefficient in column 3 suggests that buyouts on average lead to a 9.0% decline in the NOx output emission rate (with a t-stat of −2.53). Given the large volumes of total emissions of these gases in the power sector, the economic magnitudes of these estimates are significant. The estimate of the DiD coefficient for the log output emission rate of SO2 is statistically insignificant.
Instead of changes in percentage points, we can also assess the economic magnitudes of these effects in terms of standard deviations. The standard deviations of ln(CO2/E) and ln(NOx/E) are 0.36 and 1.43, respectively, in the full sample. The aforementioned coefficient estimates suggest that the declines in ln(CO2/E) and ln(NOx/E) are equivalent to 0.12 and 0.06 standard deviations of these variables, respectively.
Equation (2) implies that the decline in the log output emission rate is the sum of the declines in the log heat rate and log input emission rate. Columns 4–7 show that private equity buyouts on average lead to a decline in the heat rate by 4.0% (with a t-stat of 3.38), but they have no statistically significant effect on any of the input emission rates. The post-buyout decline in output-scaled CO2 emissions is almost entirely due to lower heat input required for each unit of electricity output. While the decline in the input emission rate of NOx also contributes to the reduced output emission rate of NOx, this decline itself is statistically insignificant. Thus, the post-buyout improvements in environmental performance are mainly due to increased production efficiency instead of more effective emission control measures. This supports the hypothesis we propose in Section II, and it is consistent with the profit motive of private equity firms: Private equity buyouts improve the efficiency (profit-boosting) component of acquired plants’ environmental performance, but they have no statistically significant effect on the nonefficiency (profit-draining) component.
Panel B of Table 4 shows similar results in terms of the raw emission rates and heat rate. The point estimates in columns 1 and 3 suggest that buyouts, on average, are followed by declines in CO2 and NOx emissions by 22.009 kg and 0.079 kg, respectively, for each MWh of electricity produced. Column 4 shows that buyouts are associated with a decline in heat input by 0.358 MMBtu per MWh. These numbers are equivalent to 10%, 9%, and 16% of the standard deviations of the corresponding variables in the full sample, which further suggests that the buyout effect is economically large. The buyout effects on the raw input emission rates are more mixed: the coefficient estimates are insignificant for CO2, positive with marginal significance for SO2, and negative at the 5% significance level for NOx.
B. Pretrends and Treatment Effect Dynamics
The key identifying assumption for our DiD analysis is that the outcome variables for both the treated and control plants follow parallel trends in the absence of the buyout. To test whether this assumption holds for the pre-buyout years and to examine the dynamics of the buyout effect, we modify equation (3) to allow the coefficient on the interaction term to vary across the event-time years. Specifically, we create a dummy variable for each event-time year in the 11-year window and replace the interaction term in (3) with the interactions of the Buyout dummy with all the event-time year dummies. That is, we estimate the following generalized DiD model:

where
$ {T}_{\tau, c} $
 is a dummy variable that equals 1 for observations in year
$ \tau $
 relative to the buyout year and 0 for all others, with
$ \tau \in \left\{-5,\dots, 5\right\}\backslash \left\{-1\right\} $
 . We use the year
$ \tau =-1 $
 as the base year.
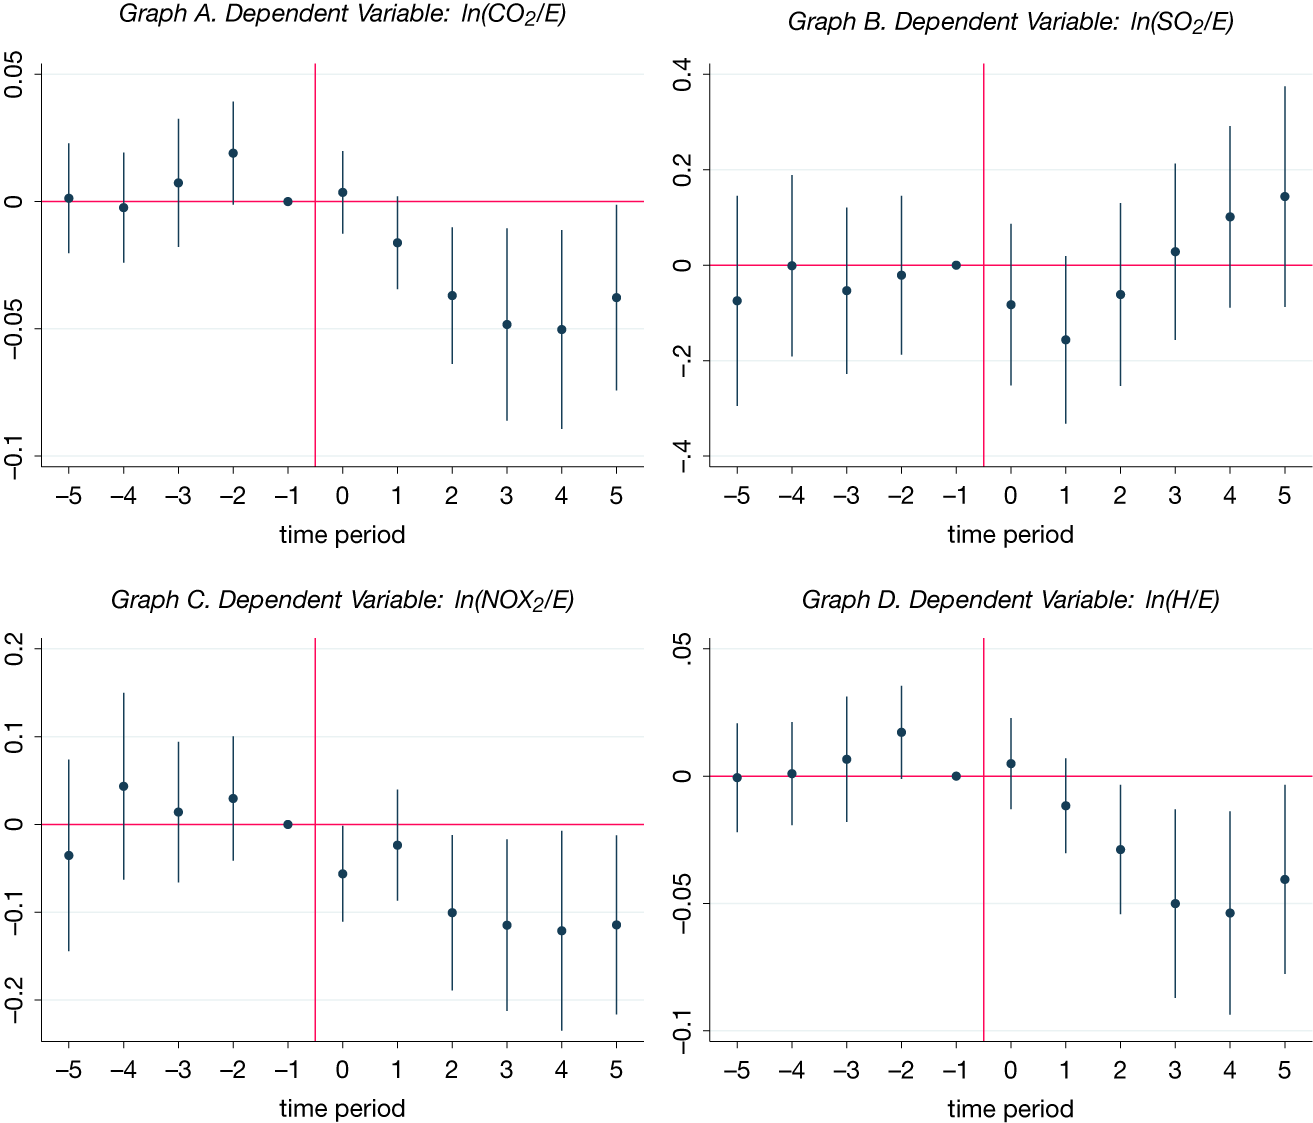
We plot the coefficients on the interaction terms in Figure 2 for the models of the output emission rates and heat rate. All four graphs in the figure show that the coefficients for the pre-buyout years are largely flat, supporting the parallel trend assumption and our empirical design. Graphs A and D show significant declines in ln(CO2/E) and ln(H/E) starting from the first year after the buyout. Graph B shows a temporary drop in ln(SO2/E) in the first two post-buyout years, which was reversed subsequently. Graph C shows a steady decline in ln(NOx/E) starting from the buyout year. These patterns are consistent with the results reported in Table 4.
Figure 2 shows the point estimates and 95% confidence intervals of the coefficients
$ {\beta}_{\tau } $
 in equation (4), where
$ \tau $
 is the year relative to the buyout year (year 0) and
$ \tau =-1 $
 represents the base year. The dependent variables are the logarithms of the CO2, SO2, NO2 output emission rates, and the heat rate, respectively, in Graphs A–D.

FIGURE 2 Long description
A four-panel coefficient plot. Each graph shares a common x-axis labeled time period, ranging from minus 5 to 5, with a vertical red line at minus 0.5 representing the pre-event base year at minus 1. A horizontal red line is set at 0 on the y-axis.
* Graph A: Dependent Variable is natural log of C O sub 2 all over E. The y-axis ranges from minus 0.1 to 0.05. Coefficients are stable near zero before the event, then show a significant downward trend starting at year 1, reaching approximately minus 0.05 by year 5.
* Graph B: Dependent Variable is natural log of S O sub 2 all over E. The y-axis ranges from minus 0.4 to 0.4. Data points show high variance with wide 95 percent confidence intervals. There is no clear trend, with most intervals crossing the zero line.
* Graph C: Dependent Variable is natural log of N O sub 2 all over E. The y-axis ranges from minus 0.2 to 0.2. Similar to Graph A, coefficients are near zero pre-event and shift to a sustained negative level around minus 0.1 from year 2 through year 5.
* Graph D: Dependent Variable is natural log of H all over E. The y-axis ranges from minus 0.1 to 0.05. Coefficients remain near zero until year 0, followed by a steady linear decline to approximately minus 0.05 by year 5.
C. Comparison with M&As and SBOs
To examine whether the effects we find in Table 4 are specific to private equity-backed buyouts, we compare them with the effects of M&A deals not backed by private equity. Applying the same method that we use to identify control plants for the private equity-acquired plants, we identify 77 pairs of treatment and control plants for the M&A deals. We combine the stacked buyout and M&A samples to run stacked DiD regressions jointly at the EGU level. We extend the model specification (3) to include an additional interaction term:
$ Post\times M\&A $
 , where
$ Post $
 is a dummy that equals 1 for post-buyout or post-M&A years and 0 for other years, and
$ M\&A $
 is a dummy that equals 1 for target plants and 0 for control plants.
Panel A in Table 5 shows the regression results. While the buyout effects are largely the same as our baseline estimates, both qualitatively and quantitatively, we find no significant M&A effect on any of the outcome variables. The coefficients on
$ Post\times M\&A $
 are insignificant in all columns. This suggests that M&As not backed by private equity do not bring the same operational and environmental benefits as do private equity-backed buyout deals. The table also reports the
$ F $
 -statistics and p-values for the
$ F $
 -tests of the null hypothesis that the coefficients on
$ Post\times Buyout $
 and
$ Post\times M\&A $
 are equal. They suggest that the differences between PE buyout and M&A effects on the heat rate, NOx output, and input emission rate are statistically significant at the 5% level.

TABLE 5 Long description
The table consists of two panels, Panel A and Panel B, each with 7 columns representing different dependent variables: 1. natural log of C O sub 2 all over E, 2. natural log of S O sub 2 all over E, 3. natural log of N O sub x all over E, 4. natural log of H all over E, 5. natural log of C O sub 2 all over H, 6. natural log of S O sub 2 all over H, and 7. natural log of N O sub x all over H.
Panel A compares first buyouts with M and As.
* For Post times Buyout, significant negative coefficients are found for C O sub 2 all over E (-0.040), N O sub x all over E (-0.089), and H all over E (-0.040).
* For Post times M and A, no coefficients are statistically significant.
* The F-statistic and p-values indicate significant differences between buyout and M and A effects for C O sub 2 all over E, N O sub x all over E, and H all over E.
Panel B compares first buyouts with secondary buyouts (S B Os).
* For Post times Buyout, results are similar to Panel A with significant negative coefficients for C O sub 2 all over E (-0.042), N O sub x all over E (-0.087), and H all over E (-0.040).
* For Post times S B O, no coefficients are statistically significant.
* The F-test shows significant differences between first buyouts and S B Os specifically for C O sub 2 all over E and H all over E.
Both panels include controls for natural log of Age, number of observations (11,288 in Panel A; 8,330 in Panel B), R-squared values ranging from 0.774 to 0.942, and fixed effects for Year-cohort and Plant-cohort.
Our analysis so far focuses on the effect of the first private equity buyout of each target plant. To compare it with the effect of secondary private equity buyouts, we extend our analysis to include SBO deals. Applying the same matching procedure described in Section IV.B, we identify 29 pairs of SBO treatment and control plants. We add EGUs of those plants to the baseline DiD sample and run regressions similar to those in Panel A of Table 5. The results, presented in Panel B, show that SBOs have no significant effect on either the heat rate or emission rates. The
$ F $
 -tests show that, in terms of the effects on the heat rate and the CO2 output emission rate, the difference between first buyouts and SBOs is statistically significant at the 1% level. This suggests that positive effects of private equity ownership are concentrated in first buyouts.
D. Stacked DiD Regressions at the Plant Level
While we focus primarily on the EGU-level data in our analysis, which provides more power due to the larger number of observations, we perform a similar analysis using the plant-level data. Because financial variables are observed at the plant level, we examine the effect of private equity buyouts on financial variables only at the plant level. To account for the higher importance of larger plants, we weight the observations by the number of EGUs that a plant has.
The results from the plant-level stacked DiD regressions are presented in Table 6. Panel A shows the estimates from the baseline model specification. Consistent with the EGU-level baseline results, there are statistically significant drops in both the CO2 output emission rate and heat rate after the buyout. The magnitudes of these drops are very close to each other (3.6% and 3.4%, respectively), suggesting that the drop in the CO2 output emission is almost fully due to the improvement in production efficiency. The effect on the NOx output emission rate is also very similar to what we estimate using the EGU-level data, with a post-buyout drop of 8.7%.

TABLE 6 Long description
Panel A, Environmental Performance, contains 7 columns measuring emission rates and heat rates. The primary variable, Post times Buyout, shows significant negative effects on l n (C O sub 2 / E) at -0.036 (t-stat -2.04), l n (N O sub x / E) at -0.087 (t-stat -1.77), and l n (H / E) at -0.034 (t-stat -1.98). Other columns for l n (S O sub 2 / E), l n (C O sub 2 / H), l n (S O sub 2 / H), and l n (N O sub x / H) show statistically insignificant results. The control variable l n (Age) is significant only for l n (S O sub 2 / E) at -0.308. Number of observations is 1,894 with R-squared values ranging from 0.948 to 0.990.
Panel B, Financial Variables, contains 4 columns. Post times Buyout shows a significant negative effect on l n (FuelCost / E) at -0.073 (t-stat -2.16). Effects on O M / E (-0.091), Capx / E (2.732), and l n (Price) (-0.202) are statistically insignificant. Number of observations varies from 292 to 1,144. Both panels include Year-cohort F E and Plant-cohort F E.
Panel B shows the buyout effect on financial performance. Consistent with the post-buyout reduction in heat rate, fuel costs per MWh drop significantly by 7.3%. This is about twice the reduction in the heat rate at the plant level. It suggests that private equity ownership reduces fuel costs not only through improvements in production efficiency but also through cost savings in fuel procurement potentially because of improved fuel sourcing decisions or stronger bargaining power against suppliers.Footnote 15
Columns 2–4 show that private equity ownership does not significantly alter O&M and capital expenditures on pollution abatement per MWh. This is consistent with our baseline result that buyouts have no significant effect on input emission rates. While spending on emission control is environmentally beneficial, it is privately costly for the owners. Therefore, private equity firms in general do not have strong incentives to increase such spending. The last column shows that private equity buyouts do not have a significant effect on power plants’ wholesale price of electricity potentially because of the competitiveness of the wholesale markets. However, this result should be interpreted with caution due to the small sample size.
VI. Exploring the Mechanism
We now explore the mechanisms underlying the private equity buyout effects documented in Section V. We first present a set of cross-sectional results and then examine the roles of within-EGU improvements versus changes in the EGU composition. We also examine the buyout effects on other aspects of plant operations that can potentially affect gas emission rates.
A. The Role of Private Equity Firms’ ESG Preferences
Given the active role played by private equity firms in the operations of their portfolio companies, we expect the post-buyout reductions in harmful gas emissions to be strongly influenced by the deal-backing private equity firms’ attitudes toward ESG. One way to measure a firm’s ESG attitude is to use its stated investment preferences. PitchBook records such preferences for each investor in its database in a variable called “other stated preferences,” which includes content such as “Prefers majority stake,” “Will lead on a deal,” “Seeks ESG investments,” “Seeks Impact investments,” and so forth. We use this information to determine whether a deal is backed by pro-ESG private equity.
Specifically, we classify a private equity investor as pro-ESG if its “other stated preferences” include “Seeks ESG investments” or “Seeks Impact investments.”Footnote 16 About 30% of deals in our sample have more than one private equity investor. In such cases, if one of them is designated as the lead investor, we classify the deal based on the preferences of the lead investor; otherwise, we classify it as backed by pro-ESG private equity if more than 50% of private equity firms in the deal are pro-ESG. Based on this classification scheme, 34 of the 102 acquired plants used in the stacked DiD analysis are acquired by pro-ESG private equity. The rest are acquired by non-ESG private equity.Footnote 17 If private equity firms are truly committed to their stated preference for ESG, then we should expect plants acquired by pro-ESG private equity to exhibit more significant post-buyout emission reductions. In contrast, if private equity firms use their stated ESG preferences just for greenwashing, then there will be no difference.
To test which scenario is supported by the data, we extend our baseline model by adding a triple interaction term
$ Post\times Buyout\times ESG $
 , with
$ ESG $
 being a cohort-level dummy variable indicating deals backed by pro-ESG private equity.Footnote
18 The results are reported in Panel A of Table 7. The coefficient estimates on
$ Post\times Buyout $
 are significantly negative in columns 1 and 4. They show that buyouts backed by non-ESG private equity are followed by a decline in CO2 output emission rates by 2.7%, which is almost entirely explained by a 2.6% decline in heat rate. Interestingly, the reductions are significantly stronger for deals backed by pro-ESG private equity. The significantly negative coefficient estimates on
$ Post\times Buyout\times ESG $
 in columns 1 and 4, combined with those on
$ Post\times Buyout $
 , suggest that buyouts backed by pro-ESG private equity reduce the CO2 output emission rate and the heat rate by 7.9% and 7.5%, respectively. This is consistent with our hypothesis that a pro-ESG preference brings further incentive to improve production efficiency beyond the profit motive.

TABLE 7 Long description
The table is divided into Panel A (First Buyouts) and Panel B (First and Secondary Buyouts). Both panels feature seven columns representing different dependent variables: 1. ln(C O sub 2 / E), 2. ln(S O sub 2 / E), 3. ln(N O sub x / E), 4. ln(H / E), 5. ln(C O sub 2 / H), 6. ln(S O sub 2 / H), and 7. ln(N O sub x / H).
In Panel A, the interaction term Post times Buyout times E S G shows significant negative coefficients for ln(C O sub 2 / E) at -0.052, ln(N O sub x / E) at -0.212, ln(H / E) at -0.049, and ln(N O sub x / H) at -0.163. This indicates that pro-E S G buyouts lead to greater reductions in these emissions compared to non-E S G buyouts. The number of observations is 6,076 with R-squared values ranging from 0.817 to 0.933.
In Panel B, which includes secondary buyouts (S B O), the interaction Post times Buyout times E S G remains significant for similar variables. The specific interaction for secondary buyouts, Post times S B O times E S G, shows a significant negative coefficient only for ln(C O sub 2 / H) at -0.009. The number of observations increases to 8,330 with R-squared values between 0.835 and 0.942. Both panels include Year-cohort and Plant-cohort fixed effects.
More remarkably, while buyouts backed by non-ESG private equity have no significant relation with any input emission rate, those backed by pro-ESG private equity are followed by a significant decline of 16.6% in NOx input emission rate. Combined with the decline in heat rate, NOx output emission rate declines by 24.1% for plants bought out by pro-ESG private equity. This suggests that pro-ESG private equity firms generate more significant environmental benefits not only through more significant production efficiency increases but also through improvements in emission control. Thus, the pro-ESG preference stated by private equity firms appears to be a credible commitment instead of a greenwashing tool.
In Panel B, we extend this analysis to SBO deals. Given the stronger effect of deals backed by pro-ESG private equity, a plant’s performance may improve after it is acquired by a pro-ESG private equity firm from a non-ESG one. For each SBO deal, we create a dummy variable that equals 1 if it is backed by pro-ESG private equity and the prior acquirers of the target plant are non-ESG private equity firms. The results show that while SBOs backed by non-ESG private equity have no significant effect, those backed by pro-ESG private equity are associated with a significantly stronger improvement in CO2 output emission rate, and the difference is statistically significant at the 5% level.Footnote 19 This further suggests that ESG preferences of private equity firms matter for the environmental performance of deals they back.
We also examine whether deals backed by pro-ESG and non-ESG private equity have different effects on financial variables. The results, reported in Table IA1 in the Supplementary Material, do not show any significant difference.
One may wonder whether pro-ESG and non-ESG private equity firms choose different buyout targets. To shed light on this question, we estimate two multinomial logistic models in which the outcome variable is 1 (2) if a plant is bought out for the first time in a deal backed by non-ESG (pro-ESG) private equity in a given year, and 0 otherwise. The results are reported in Table IA2 in the Supplementary Material. The more parsimonious model, which contains no financial variables, shows that non-ESG private equity firms target newer and larger power plants, while pro-ESG ones do not. As we show later in Panel A of Table 9, the buyout effect is stronger for larger plants. Therefore, the stronger effect of deals backed by pro-ESG private equity cannot be explained by this difference in the choice of target plants between pro-ESG and non-ESG private equity. The extended model, which includes financial variables and is estimated on a significantly smaller sample, shows that pro-ESG private equity shows a preference for power plants operating at a higher capacity factor, while non-ESG private equity does not.
Since pro-ESG private equity firms tend to be larger, one may wonder whether the difference reported previously is due to differences between large/experienced and small/young private equity firms. To test this possibility, we split the sample into two based on the size/experience of the lead private equity investor relative to the median. We measure size/experience by the number of deals a firm has participated in by the year of each deal in our sample. The result does not support this conjecture. If anything, they show that improvements in environmental performance are less significant in deals led by large/experienced private equity firms.
B. The Role of Regulatory and Social Environments
Power plants in the United States operate in two distinct regulatory and market environments: ISO (Independent System Operator) and non-ISO regimes. These regimes represent different approaches to managing and operating electrical grids and electricity markets. In the ISO system, the transmission grid and the flow of electricity over the network are controlled by entities separate from power generation (i.e., ISOs). In contrast, in the non-ISO regime, the generation, transmission, and distribution of electricity are typically managed by vertically integrated utilities. ISOs were created following the adoption of the Energy Policy Act of 1992 and the issuance of Federal Energy Regulatory Commission Orders 888 and 889 in 1996, which opened wholesale electricity markets to competition. Markets are generally more competitive in the ISO regime than in the non-ISO regime (see Cicala (Reference Cicala2022) for more detailed descriptions). The coexistence of the two regimes allows us to examine the variation of the buyout effect across regulatory and market environments.
To explore this variation, we extend our baseline model (3) to include a triple interaction term
$ Post\times Buyout\times ISO $
 , with
$ ISO $
 being a cohort-level dummy variable that equals 1 if the acquired plant operates in an ISO regime in the year prior to the buyout.Footnote
20 We report this set of triple DiD results in Panel A of Table 8. Columns 1 and 4 show that the post-buyout decrease in CO2 emission intensity and improvement in production efficiency are concentrated in plants operating in the ISO regime. This is consistent with the finding in the literature that private equity tends to have more positive effects in markets that are more competitive (Sorensen and Yasuda (Reference Sorensen, Yasuda, Eckbo, Phillips and Sorensen2023)). Columns 5 and 7 show post-buyout declines in CO2 and NOx input emissions for non-ISO plants, but the effects are only statistically significant at the 10% level.

TABLE 8 Long description
The table consists of 7 columns representing dependent variables: 1. natural log of C O sub 2 over E, 2. natural log of S O sub 2 over E, 3. natural log of N O sub x over E, 4. natural log of H over E, 5. natural log of C O sub 2 over H, 6. natural log of S O sub 2 over H, and 7. natural log of N O sub x over H.
Panel A: Regulatory Environment: I S O versus Non-I S O.
* Post times Buyout: Coefficients range from -0.078* (column 7) to 0.221 (column 2).
* Post times Buyout times I S O: Significant negative coefficients for C O sub 2 over E (-0.056**) and H over E (-0.069***).
* Number of observations: 6,014. R-squared values range from 0.816 to 0.933.
Panel B: Public Support for Lowering Power Plant Emissions: Strong versus Weak.
* Post times Buyout: Significant negative coefficients for C O sub 2 over E (-0.014*) and H over E (-0.014*).
* Post times Buyout times LowerEmi: Significant negative coefficients for C O sub 2 over E (-0.043**), N O sub x over E (-0.210***), H over E (-0.041**), and N O sub x over H (-0.169***).
* Number of observations: 6,076. R-squared values range from 0.817 to 0.933.
Panel C: Public Support for Stricter Environmental Regulations: Strong versus Weak.
* Post times Buyout: Significant negative coefficients for C O sub 2 over E (-0.032**) and H over E (-0.028***).
* Post times Buyout times StricterReg: Significant negative coefficient for N O sub x over E (-0.134*) and N O sub x over H (-0.115*).
* Number of observations: 6,076. R-squared values range from 0.816 to 0.933.
All models include controls for natural log of Age, Year-cohort F E, and Plant-cohort F E.
The buyout effect may also differ under different social environments. In a state with strong public support for environmental protection and emissions control, private equity firms may face more pressure to improve environmental performance. To test this conjecture, we use two survey results to gauge the strength of public support for government intervention and regulation on environment protection. The first is the 2020 Climate Insights survey conducted by researchers at Stanford University, Resources for the Future, and ReconMR (see Tyson, Funk, and Kennedy (Reference Tyson, Funk and Kennedy2020)). The second is the 2014 Religious Landscape Survey conducted by the Pew Research Center (see Pew Research Center (2016)).Footnote 21 Both surveys break down the opinions of respondents by state. The first survey includes a question directly related to our study, asking the respondents whether they believe the government should take action to lower power plant gas emissions. The second includes a question asking respondents whether they believe “stricter environmental laws and regulations are worth the cost.” We use the fraction of respondents providing an affirmative answer to these questions to measure public opinions in a state. We create a cohort-level dummy variable LowerEmi (StricterReg) that equals 1 if an acquired plant is located in a state where the fraction of respondents answering “yes” to the first (second) question is above the median across states. We extend the baseline model to include a three-way interaction term to capture the differential buyout effect under different social environments.
The results in Panel B of Table 8 show that in states where the public support for government action in lowering power plant emissions is stronger than the median, the post-buyout reductions in heat rate and NOx input emission rate are more significant, resulting in more significant improvements in output emission rates of CO2 and NOx. The results in Panel C show that the buyout effects on NOx input and output emission rates also differ between states differing in public support for stricter environmental regulations, but the differences are only marginally significant at the 10% level. These results suggest that the environmentally beneficial effect of private equity buyouts is stronger in states in which the public shows strong interest in lowering power plant emissions. Public opinion on environmental regulations in general also matters, but to a lesser extent.
To verify whether the responses to the two survey questions indeed capture some underlying differences in social and regulatory environments, we run panel regressions to examine the power plant performance differences between states classified previously using the full sample of the plant-level data.Footnote 22 The results are reported in Table IA3 in the Supplementary Material. While no significant difference in production efficiency is observed, input emission rates are lower in states with strong public support for government action in lowering power plant emissions or stricter environmental regulations. The differences are statistically significant for CO2 and NOx. The differences in SO2 input emission rate are statistically insignificant, but the economic magnitudes of the coefficient estimates are even larger (−0.563 on the dummy variable LowerEmi and −0.641 on StricterReg). Obviously, one cannot draw causal claims from these results; however, they do suggest that the survey responses reflect some genuine differences across states.
C. Other Cross-Sectional Patterns in the Buyout Effect
We next explore the heterogeneity in the buyout effect along other dimensions.
1. High Versus Low Plant Capacity
The postbuyout improvements in operational and environmental performance likely depend on private equity firms’ attention and focus. With limited attention, private equity firms are more likely to focus on plants with large capacity, as they are more important drivers of their portfolio performance. Large plants are also likely to attract more public attention and regulatory scrutiny. We, therefore, expect the private equity buyout effect to be stronger among large plants. We test this conjecture by splitting the sample for the stacked DiD analysis into two groups based on whether the nameplate electricity generation capacity of the acquired plant is above the median of all acquired plants in the year prior to the buyout. The results from the triple DiD regressions, reported in Panel A of Table 9, are consistent with our conjecture. The buyout effects are concentrated in plants with above-median capacity. None of the coefficient estimates on
$ Post\times Buyout $
 is significant, suggesting no buyout effect for plants with below-median capacity.

TABLE 9 Long description
The table is organized into seven columns representing dependent variables: 1 ln(C O sub 2 / E), 2 ln(S O sub 2 / E), 3 ln(N O sub x / E), 4 ln(H / E), 5 ln(C O sub 2 / H), 6 ln(S O sub 2 / H), and 7 ln(N O sub x / H).
Panel A. Plant Capacity: High vs. Low.
- Post times Buyout shows mostly insignificant coefficients.
- Post times Buyout times HighCap shows significant negative coefficients for C O sub 2 / E (-0.071), N O sub x / E (-0.249), H / E (-0.076), and N O sub x / H (-0.173).
- Number of observations: 6,076. R-squared ranges from 0.818 to 0.933.
Panel B. Deal Type: Divestiture vs. Nondivestiture.
- Post times Buyout times Divestiture shows significant negative coefficients for C O sub 2 / E (-0.049), H / E (-0.041), and C O sub 2 / H (-0.008).
- Number of observations: 6,076. R-squared ranges from 0.817 to 0.933.
Panel C. Holding Period: Long vs. Short.
- Post times Buyout times Long shows significant negative coefficients for C O sub 2 / E (-0.075), N O sub x / E (-0.262), H / E (-0.063), C O sub 2 / H (-0.012), and N O sub x / H (-0.199).
- Post times Buyout times Short shows no statistically significant coefficients.
- Number of observations: 2,118. R-squared ranges from 0.874 to 0.936.
Panel D. Exit Channel: S B O vs. M and A.
- Post times Buyout times ExitSBO shows a significant positive coefficient for S O sub 2 / E (0.290) and S O sub 2 / H (0.294), but negative for N O sub x / E (-0.208), C O sub 2 / H (-0.013), and N O sub x / H (-0.204).
- Post times Buyout times ExitM and A shows significant negative coefficients for C O sub 2 / E (-0.131) and H / E (-0.123).
- Number of observations: 1,689. R-squared ranges from 0.904 to 0.945.
All models include controls for ln(Age), Year-cohort F E, and Plant-cohort F E.
2. Corporate Divestiture Deals Versus Nondivestiture Deals
The buyout effects may also depend on the financial situation and objective of plant sellers. One example is plants acquired through corporate divestiture deals. A divestiture is the disposal of some assets or business units by a company. This often occurs when a business unit is no longer viewed as a core competency or when a company is in financial distress. In either case, the company is unlikely to invest much in the unit before it is disposed. Therefore, we expect the private equity buyout effect to be greater for plants acquired by private equity through corporate divestiture deals. To test this hypothesis, we extend the baseline specification (3) by adding a three-way interaction term,
$ Post\times Buyout\times Divestiture $
 , where
$ Divestiture $
 is a dummy variable that equals 1 for cohorts with a plant acquired in a divestiture deal (47 of the 102 acquired plants fall into this category). The results from the triple DiD regressions are presented in Panel B of Table 8. The coefficient estimates on the three-way interaction term are significantly negative in columns 1, 4, and 5, suggesting a stronger buyout effect following a divestiture deal.
3. Long Versus Short Holding Periods
Investments in efficiency improvements and emission reductions are not only financially costly but also take time. This suggests that post-buyout improvements in production efficiency and environmental performance may depend on how long a power plant is held by the acquiring private equity firm. To test this possibility, we examine the exit date of the acquiring private equity firms based on subsequent deals captured in the PitchBook database. We calculate the duration of the holding period based on the exit date and the acquisition date, and we create a cohort-level dummy Long (Short) that equals 1 if the holding period is longer (shorter) than 4 years.Footnote 23 Consistent with the conjecture, the results in Panel C of Table 9 show that post-buyout improvements are concentrated in plants held by the acquiring private equity firm for more than 4 years.Footnote 24
4. Differences in Exit Channels
Given the heterogeneity in the buyout effect, it would be interesting to see how the post-buyout changes in production efficiency and environmental performance are related to the exit outcome. Unfortunately, financial information for power plant deals is limited and the transaction values are generally undisclosed. Nevertheless, we are able to classify the exit channel based on the subsequent deals covered by PitchBook. The two most common exit channels are M&As and SBOs. To examine whether the buyout effects are different between these two exit channels, we create two cohort-level dummy variables, ExitM&A and ExitSBO, to indicate cohorts in which the private equity firm exits through an SBO and M&A, respectively.Footnote 25 To ensure that the post-buyout performance is not affected by the subsequent acquirers, if the exit occurs within the 5-year post-buyout window, we include the observations only up to the year of the exit. Panel D of Table 9 shows that power plants exited via an M&A show a significant post-buyout reduction in the heat rate potentially because the improvement in production efficiency makes the plant more attractive to other firms in the electricity industry. In contrast, plants exited via an SBO show no significant buyout effect on the heat rate and mixed effects on input emission rates: the CO2 and NOx input emission rate decline significantly, while the SO2 input emission rate increases significantly.
Given the concern about the lack of transparency in firms owned by private equity, we have also examined whether buyout effects are different between public-to-private deals and private-to-private deals. Among the 102 acquired plants, 22 are bought out through public-to-private deals. The rest are bought out through private-to-private deals. We do not find a significant difference in the buyout effect between these two deal types.
D. Within-EGU Improvements Versus EGU Composition Effect
The post-buyout reductions in the heat rate and CO2 and NOx output emission rates can be due to either improvements of existing EGUs or changes in the EGU composition (through the retirement of old EGUs and the installation of new EGUs). To examine which force is more important, we extend the baseline model specification (3) by controlling for EGU-cohort fixed effects, which subsume the less granular plant-cohort fixed effects. This allows us to identify the within-EGU effects of private equity buyouts. If private equity mainly improves the performance of existing EGUs through, for example, software or equipment upgrades, more efficient planning/scheduling, or more efficient operating procedures, then the results should be largely the same irrespective of whether we control for plant-cohort or EGU-cohort fixed effects. In contrast, if private equity improves the output emission rates and production efficiency by replacing old and inefficient EGUs with new ones, the buyout effect should diminish after controlling for the EGU-cohort fixed effects.
Panel A of Table 10 shows the results from the extended model for the full sample. For the log heat rate, the coefficient on
$ Post\times Buyout $
 drops in magnitude from −0.40 in Table 4 to −0.32 after controlling for EGU fixed effects, suggesting that within-EGU variation accounts for 80% of the post-buyout efficiency improvement estimated from our baseline regression. The DiD coefficient estimate for ln(CO2/E) shrinks by 17% in magnitude, and the estimate for ln(NOx/E) remains almost exactly the same. This suggests that, for the full sample, the large majority of the private equity buyout effects we uncover in the baseline model come from improvements in existing EGUs instead of changes in the EGU composition.

TABLE 10 Long description
Panel A: Controlling for E G U-Cohort Fixed Effects. This panel contains 7 columns representing different dependent variables: 1. natural log of C O sub 2 over E, 2. natural log of S O sub 2 over E, 3. natural log of N O sub x over E, 4. natural log of H over E, 5. natural log of C O sub 2 over H, 6. natural log of S O over H, and 7. natural log of N O sub x over H.
Key results for the interaction term Post times Buyout:
- Column 1: -0.035*** (t-stat -2.99)
- Column 3: -0.092** (t-stat -2.54)
- Column 4: -0.032*** (t-stat -2.84)
- Column 7: -0.060* (t-stat -1.91)
Other variables include natural log of Age, Number of observations (6,074 for all), and R-squared values ranging from 0.887 to 0.976. Fixed effects for Year-cohort and E G U-cohort are applied to all columns.
Panel B: Coal- or Oil-Fired Plants versus Gas-Fired Plants. This panel focuses on the dependent variable natural log of H over E across 4 columns.
- Columns 1 and 2: Coal- or Oil-Fired Plants. Post times Buyout is -0.141** in column 1 and -0.019 in column 2.
- Columns 3 and 4: Gas-Fired Plants. Post times Buyout is -0.033*** in column 3 and -0.032*** in column 4.
Observations: 464 for coal/oil and approximately 5,610 for gas. R-squared values range from 0.396 to 0.889. Fixed effects vary by column, including Year-cohort, Plant-cohort, and E G U-cohort.
The importance of changes in the EGU composition is likely to be different for coal or oil-fired plants than for natural gas-fired plants. For gas-fired plants, which tend to be newer, replacing an existing EGU is likely to be less important. However, for coal- or oil-fired plants, which are older and operate at lower fuel efficiency, replacements with or switching to natural gas-fired EGUs can lead to substantial efficiency gains. To test this possibility, we separate coal- and oil-fired target plants from natural gas-fired ones and examine the buyout effect on log heat rate separately for these two subsamples.
Among the 102 acquired plants in our sample for DiD analysis, there are only 8 plants fired with coal or oil, with a total of 21 EGUs. The results, reported in Panel B of Table 10, show striking differences between these plants and the natural gas-fired plants. The decrease in heat rate is much greater for coal- or oil-fired plants than for natural gas-fired plant: 14.1% versus 3.3%. Furthermore, while post-buyout efficiency improvement in natural gas-fired plants comes almost exclusively from within-EGU variation (the coefficients in columns 3 and 4 are almost identical), this variation accounts for only for 13% of the efficiency gain in coal- or oil-fired plants: the coefficient shrinks from −0.141 to −0.019 after controlling for the EGU fixed effects. This shows that EGU upgrades indeed play a much more important role in efficiency improvements for coal- or oil-fired plants than for natural gas-fired plants.
E. Production Scale and Other Operational Changes
The post-buyout decrease in output emission rate and heat rate may also be due to an increase in production scale. To examine this possibility, we extend the baseline model by controlling for log electricity output. The results reported in Table 11 show that output scale is indeed negatively related to the CO2 and NOx output emission rates and heat rate. But its ability to explain the buyout effect on CO2 output emission rate and heat rate is rather minor. Compared to the baseline results in Panel A of Table 4, the DiD coefficient estimates remain almost identical, suggesting that changes in production scale play little role in explaining the post-buyout improvements in production efficiency and emission intensity.

TABLE 11 Long description
The table is divided into two sections.
Panel A, Controlling for Output Scale, includes 7 columns of dependent variables: natural log of C O sub 2 over E, S O sub 2 over E, N O sub x over E, H over E, C O sub 2 over H, S O sub 2 over H, and N O sub x over H.
* The interaction term Post times Buyout shows significant negative coefficients for ln(C O sub 2 over E) at -0.040, ln(N O sub x over E) at -0.081, and ln(H over E) at -0.038.
* Controls include ln(Age) and ln(Electricity).
* All models include 6,076 observations with R-squared values ranging from 0.859 to 0.951.
* Year-cohort and Plant-cohort fixed effects are included for all columns.
Panel B, Other Operational Changes, includes 7 columns: ln(Electricity), ln(HeatInput), ln(O P T), ln(E over O P T), ln(H over O P T), CapFactor, and Retirement.
* The Post times Buyout interaction shows a significant negative effect on ln(H over O P T) at -0.046.
* Other coefficients for buyouts on electricity output, heat input, and capacity factor are not statistically significant.
* Retirement shows a small significant positive correlation with ln(Age) at 0.004.
* All models include 6,076 observations with R-squared values ranging from 0.667 to 0.916.
* Year-cohort fixed effects are included for all; Plant-cohort fixed effects are included for all except the Retirement column.
In Panel B of Table 11, we examine the effect of private equity buyouts on various aspects of plant operations, including total output, input, operating time (OPT), hourly output and input (E/OPT and H/OPT), capacity factor (CapFactor), and EGU retirement. The first four columns show that private equity buyouts are insignificantly related to the total output, total input, total operating hours, and hourly output at the EGU level. However, column 5 shows that they are associated with a significant decline in hourly heat input by 4.6%. This provides further evidence for the positive buyout effect on production efficiency. Columns 6 and 7 show that buyouts have no significant relation with EGU capacity factor or retirement. This suggests that private equity does not operate EGUs more intensively, or prolong their lifespan, consistent with the findings of Andonov and Rauh (Reference Andonov and Rauh2024).Footnote 26
We conduct a similar analysis at the plant level and report the results in Table IA4 in the Supplementary Material. As in the EGU-level regressions, controlling for log electricity output has almost no effect on the estimates of the DiD coefficients; moreover, private equity buyouts have no significant effect on aggregate capacity, electricity output, heat input, and emission volumes at the plant level, or the number of EGUs in each plant. This further suggests that the private equity buyout effect on production efficiency and emission intensity is not due to an expansion of production scale.
VII. Robustness Checks
We perform a series of robustness checks on our main results.
A. Variations of Match-Based Stacked DiD Regressions
We first consider variations of our stacked DiD regressions, repeating our baseline analysis using an alternative event window, an alternative treatment-control ratio, and three alternative sets of matching variables. The results from these tests, reported in Table 12, further show that private equity buyouts are associated with an improvement in the efficiency component of acquired plants’ environmental performance, but their relation with the nonefficiency component is mostly insignificant.

TABLE 12 Long description
The table consists of 7 columns representing different dependent variables: 1. ln(C O sub 2 / E), 2. ln(S O sub 2 / E), 3. ln(N O sub x / E), 4. ln(H / E), 5. ln(C O sub 2 / H), 6. ln(S O sub 2 / H), and 7. ln(N O sub x / H).
* Panel A (7-Year Event Window): Post times Buyout coefficients are -0.042*** for column 1, -0.079** for column 3, and -0.037*** for column 4. Number of observations is 4,223.
* Panel B (1-to-4 Treatment-Control Ratio): Post times Buyout coefficients are -0.045*** for column 1, -0.098** for column 3, and -0.045*** for column 4. Number of observations is 14,438.
* Panel C (Baseline plus I S O): Post times Buyout coefficients are -0.046*** for column 1, -0.091** for column 3, and -0.043*** for column 4. Number of observations is 5,779.
* Panel D (Output instead of Capacity): Post times Buyout coefficients are -0.048*** for column 1 and -0.047*** for column 4. Number of observations is 6,044.
* Panel E (Output Emission Rates): Post times Buyout coefficients are -0.046*** for column 1, -0.086* for column 2, -0.109*** for column 3, -0.042*** for column 4, -0.004* for column 5, and -0.067** for column 7. Number of observations is 5,678.
All panels include controls for ln(Age), Year-cohort F E, and Plant-cohort F E. T-statistics are provided in parentheses below each coefficient. Statistical significance is marked by asterisks: * for 10 percent, ** for 5 percent, and *** for 1 percent.
In our baseline analysis, we use an 11-year event window, which implicitly assumes that private equity firms hold the acquired plants for 5 years. Some private equity firms may exit earlier. Therefore, our first robustness check is to use a shorter event window of 7 years from
$ t-3 $
 to
$ t+3 $
 . The results, reported in Panel A of Table 12, are very similar to those in Table 4.
In our baseline analysis, we match each private equity-acquired plant to one control plant. This maximizes the comparability of the treated and control plants. As another robustness check, we match each treated plant to up to four control plants, using the same matching criteria. This increases the statistical power of our tests at the expense of losing some comparability. Panel B of Table 12 shows the results. They are largely the same as those in Table 4, with the buyout effect on the heat rate being slightly larger (a decline of 4.5% instead of 4.0%).
In our baseline analysis, we match each acquired plant to a control plant based on year, state, primary fuel type, and the Mahalanobis distance calculated using log capacity, capacity factor, log plant age, and the level and slope of log heat rate. We consider three alternative matching criteria: i) We extend the baseline matching criteria to require that treatment and control plants operate under the same regulatory and market regime (ISO vs. non-ISO); ii) we replace log capacity and capacity factor by log electricity output in the calculation of the Mahalanobis distance, keeping the other matching variables unchanged; and iii) we compute the Mahalanobis distance based entirely on output emission rates: the logarithms of average CO2/E, average SO2/E, average NOx/E, and the average changes of ln(CO2/E), ln(SO2/E), and ln(NOx/E) in the years (up to three) prior to the buyout. The results based on these alternative matching criteria are presented in Panels C, D, and E of Table 12, respectively. They are all very similar to the baseline results reported in Table 4.
B. Panel DiD Regressions
Our match-based DiD analysis is well-suited for identifying the private equity buyout effect, as it mitigates potential biases due to staggered timing and treatment effect heterogeneity. However, its reliance on matching may still be a concern, despite the robustness checks described previously. Next, we complement our previous analysis by running panel DiD regressions using the full sample of EGU-level observations. Instead of relying on matching, we control for a host of fixed effects. Specifically, we estimate the model:

where
$ {y}_{i,j,k,t} $
 is the year-
$ t $
 outcome variable for EGU
$ i $
 in plant
$ j $
 of owner
$ k $
 ;
$ {Post}_{j,t} $
 is a dummy variable that equals 1 for the post-buyout years of private equity-acquired plant
$ j $
 and 0 for all other observations;
$ {\lambda}_j $
 ,
$ {\sigma}_k $
 ,
$ {\delta}_{s,t} $
 , and
$ {\theta}_{f,t} $
 are plant fixed effects, owner fixed effects, year-by-state fixed effects, and year-by-fuel type fixed effects, respectively. Note that unlike in equation (3), the dummy variable Post in equation (5) can only be nonzero for plants that are bought out. Therefore, it is identical to
$ {Buyout}_j\times {Post}_{j,t} $
 in equation (3). We double-cluster the standard errors by plant owner and year. To focus on the years around the buyout event, we drop observations more than 5 years away (before or after) from the buyout year. Compared to our baseline approach, an advantage of this approach is that it does not rely on any specific matching method. The disadvantage is that it may produce biased results due to staggered timing and treatment effect heterogeneity (e.g., Sun and Abraham (Reference Sun and Abraham2021)).
Table 13 presents the results. Panel A corresponds to the baseline model specified in equation (5). The results are qualitatively similar to those from the stacked DiD regressions reported in Table 4 but quantitatively larger. The point estimates imply that private equity buyouts are associated with declines in CO2 and NOx output emission rates by 6.5% and 15.5%, respectively. They are also associated with a decline in the heat rate by 6.6% and a decline in the NOx input emission rate by 8.8%. The slightly larger magnitudes of the buyout effect estimated from this alternative approach suggest that results from our baseline analysis are conservative.

TABLE 13 Long description
The table is divided into three panels, each with 7 columns representing natural logs of emission ratios: 1 C O sub 2 over E, 2 S O sub 2 over E, 3 N O sub x over E, 4 H over E, 5 C O sub 2 over H, 6 S O sub 2 over H, and 7 N O sub x over H.
Panel A: Baseline Specification.
For the Post variable, significant negative coefficients are found in column 1 (-0.065), column 3 (-0.155), column 4 (-0.066), and column 7 (-0.088). Age shows positive significant coefficients across all columns. Observations total 52,882 with R-squared values ranging from 0.652 to 0.934. Fixed effects include Year-state, Year-fuel type, Owner, and Plant.
Panel B: Controlling for E G U Fixed Effects.
The Post variable remains significantly negative in column 1 (-0.051), column 3 (-0.105), and column 4 (-0.054). Age shows mixed significance. Plant fixed effects are subsumed by E G U fixed effects. Observations total 52,774 with R-squared values between 0.767 and 0.962.
Panel C: Controlling for Output Scale.
This panel adds ln Electricity as a control. The Post variable is significantly negative in column 1 (-0.055), column 3 (-0.121), and column 4 (-0.057). ln Electricity shows significant negative coefficients across all columns, ranging from -0.003 to -0.229. Observations total 52,882 with R-squared values between 0.711 and 0.934.
In Panel B, we explore within-EGU variation by controlling for the EGU instead of the plant fixed effects, and the coefficient estimates show little change. Consistent with our findings in Table 10, the private equity buyout effect comes mainly from within-EGU variation. In Panel C, we add ln(Electricity) to the benchmark model as an additional control. The DiD coefficient estimates on
$ Post $
 drop in magnitude by 15%, 22%, and 14%, respectively, in the models of ln(CO2/E), ln(NOx/E), and ln(H/E), suggesting that changes in output scale explain only a small fraction of the private equity buyout effect.
VIII. Conclusion
Private equity firms’ acquisitions of brown assets are viewed by many as a hidden environmental threat and an obstacle to the green transition. We study the effect of private equity ownership on firms’ environmental performance using data from U.S. fossil fuel power plants. Exploiting the unique feature of electricity production, we decompose power plants’ gas emission intensity into a component that reflects production efficiency (the heat rate) and a nonefficiency component that reflects the effectiveness of emission control (emissions per unit of heat input). We examine the private equity buyout effects on both components. Our results show that on average, private equity buyouts are associated with a significant improvement in the efficiency component (a 4% decline in the heat rate), but they generally have no significant effect on the nonefficiency component. Corroborating this result, we find that buyouts are followed by a decline in fuel costs per MWh by 7.3% while having no significant relation with expenditures related to pollution abatement. Buyouts backed by private equity with a stated preference for ESG investments are followed not only by substantially larger efficiency improvements than buyouts backed by non-ESG firms (7.5% vs. 2.6%) but also by a significant decline of 16.6% in NOx emissions per unit of heat input.
The efficiency gains following private equity buyouts are largely concentrated in plants operating in deregulated markets and in states with strong public support for government action in lowering power plant emissions. The improvement in environmental performance is also more significant in acquired plants with large capacity, plants acquired through corporate divestiture deals, and plants held by the acquiring private equity firm for more than 4 years. For natural gas-fired plants, the increase in production efficiency occurs almost entirely via improvements to existing EGUs. However, for coal- and oil-fired plants, the efficiency gain comes mainly from changes in the EGU composition.
Our results suggest that private equity’s acquisitions of fossil fuel power plants have positive effects, both financially and environmentally. Meanwhile, they also suggest that while private equity firms are effective at implementing environmentally beneficial operational changes that are profit-boosting, they do not have strong incentives to undertake environmentally beneficial changes that are privately costly, except for those with pro-ESG preferences. Thus, our findings highlight both the strengths and limitations of private equity as a potential force for sustainability. Since firms in the power sector are monitored closely by regulators, the extent to which our results can be extended to other industries is an interesting question for future research.
Appendix. Variable Definitions
This appendix summarizes the variable definitions. The ratios that are not log-transformed are winsorized at the 1st and 99th percentiles.
- Buyout:
-
In the linear probability model, Buyout is a dummy variable that equals 1 if a plant is bought out by private equity for the first time in a given year, and 0 otherwise; in the stacked DiD regressions, it is a time-invariant dummy variable that equals 1 for plants first bought out by private equity, and 0 for others.
- M&A:
-
A time-invariant dummy variable that equals 1 for plants acquired in an M&A deal not backed by private equity.
- SBO:
-
A time-invariant dummy variable that equals 1 for plants acquired in a secondary buyout deal backed by private equity.
- Post:
-
In the stacked DiD regressions, Post is a dummy variable indicating the post-deal years for both acquired plants and control plants; in the panel DiD regressions, it is a dummy variable indicating the post-buyout years for acquired plants.
- Capacity (MW):
-
The maximum electrical power output that an EGU is capable of producing on a steady-state basis, in megawatt.
- CapFactor:
-
A measure of an EGU’s utilization relative to its full capacity, calculated as the ratio of annual electricity output to the product of capacity and annual operating hours. The plant-level capacity factor is the average EGU-level factor weighted by EGU capacity.
- Electricity (GWh):
-
Gross electricity generated in a year, in gigawatt hours (GWh).
- Age (year):
-
Plant or EGU age, measured by the number of years since a plant/EGU starts its commercial operation.
- Heat Input (BBtu):
-
Quantity of heat input, equal to fuel quantity times fuel heat content, measured in billion British thermal unit (BBtu).
- CO2 (metric ton):
-
Emitted carbon dioxide mass in metric tons.
- SO2 (metric ton):
-
Emitted sulfur dioxide mass in metric tons.
- NOx (metric ton):
-
Emitted nitrogen oxides mass in metric tons.
- H/E (MMBtu/MWh):
-
Heat input in million British thermal unit (MMBtu) per megawatt hour (MWh) electricity generated, an inverse measure of thermal efficiency.
- CO2/E (kg/MWh):
-
CO2 emissions (in kilograms) per MWh of electricity generated.
- SO2/E (kg/MWh):
-
SO2 emissions (in kilograms) per MWh of electricity generated.
- NOx/E (kg/MWh):
-
NOx emissions (in kilograms) per MWh of electricity generated.
- CO2/H (kg/MMBtu):
-
CO2 emissions (in kilograms) per MMBtu heat input.
- SO2/H (kg/MMBtu):
-
SO2 emissions (in kilograms) per MMBtu heat input.
- NOx/H (kg/MMBtu):
-
NOx emissions (in kilograms) per MMBtu heat input.
- D(Gas):
-
At the EGU level, D(Gas) is a dummy variable that equals 1 if an EGU uses gas as the primary fuel; at the plant level, it is a dummy variable that equals 1 if over 80% of a plant’s electricity output is generated by gas-fired EGUs. D(Coal) and D(Oil) are defined similarly. D(Other) equals 1 if the other three fuel type dummies are 0.
- OPT (hour):
-
The total number of hours an EGU is operating in a year.
- E/OPT (MWh/hour):
-
The average amount of electricity generated (in MWh) by an EGU per operating hour.
- H/OPT (MMBtu/hour):
-
The average heat input used (in MMBTu) by an EGU per operating hour.
- N_Unit:
-
The number of electricity generating units (EGUs) a plant has.
- Retirement:
-
A dummy that equals 1 if an EGU ceases to operate, and 0 otherwise.
- ISO:
-
A dummy variable indicating whether a plant operates in the independent system operator (ISO) regime.
- FuelCost/E ($/MWh):
-
Fuel costs per MWh of electricity generated.
- OM/E ($/MWh):
-
Operation and maintenance (O&M) expenditures related to collection and disposal of combustion by-products and related pollution abatement activities, in dollars per MWh of electricity generated.
- Capx/E ($/MWh):
-
Pollution abatement capital expenditures during the reporting year, in dollars per MWh of electricity generated.
- Price ($/MWh):
-
Price of electricity in dollars per MWh, calculated using revenues from and quantity of electricity sold for resale (i.e., wholesale sales).
- ln(X):
-
Natural logarithm of any variable X.
Supplementary Material
To view supplementary material for this article, please visit http://doi.org/10.1017/S0022109026103159.