Gender differences in political behavior are a source of ongoing interest for political pundits, campaign advisors, and students of American politics. In a closely divided nation, even small shifts in the political choices of men and women can have significant electoral consequences. In politics, the gender gap refers to male-female differences in party identification and voting behavior.1
While there are a number of ways to measure the gender gap, the most common measure subtracts the percentage of men who identify with the Democratic Party from the percentage of Democratic women. Leaning partisans are included with party identifiers for theoretical and methodological reasons (see Norrander 1999 regarding the independence gap). The voting gap is estimated using the same methodology (percentage of women who vote for the Democratic candidate minus the percentage of men who do). The gender gap in party identification contributes disproportionately to the vote gap, although it does so more in some years than in others (see Kaufmann and Petrocik 1999).

Gender Gap in Presidential Voting and Party Identification 1952 to 2004
This article is designed to explore the shrinking gender divide by examining the political behavior of men and women in the most recent presidential election. Using the American National Election Studies (ANES) data, this analysis highlights a notable contraction of the gender gap among White voters in the South.2
For purposes of this analysis, the South is limited to the 11 states of the Confederacy: Alabama, Arkansas, Florida, Georgia, Louisiana, Mississippi, North Carolina, South Carolina, Tennessee, Texas, and Virginia.
Foundations of the Gender Gap
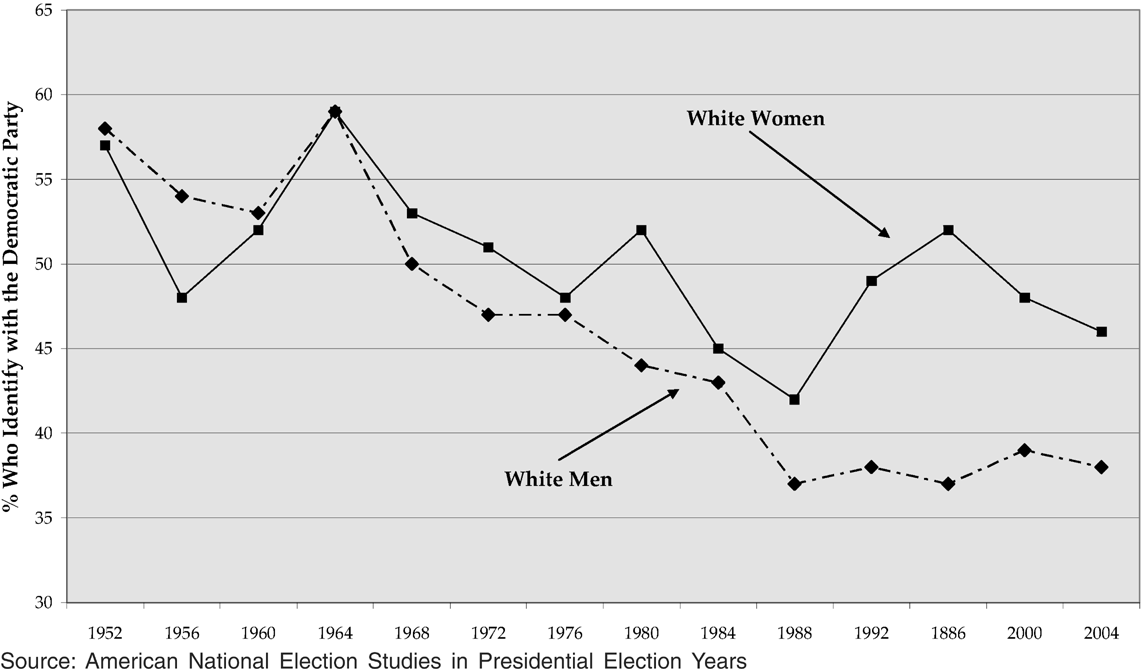
Early studies of the gender gap focused almost exclusively on women as the causal force behind growing gender divide (but see Wirls 1986). In the wake of the women's movement, scholars looked disproportionately to the economic circumstances, group consciousness, and policy views of women to explain the growing divide between women and men (Erie and Rein 1988; Frankovic 1982; Piven 1985; Smeal 1984; Shapiro and Mahajan 1986). Contemporary analyses, however, clearly point to the changing politics of men as the long-term, structural foundation of the gender gap (Box-Steffensmeier, De Boef, and Lin 2004; Chaney, Alvarez, and Nagler 1998; Kaufmann and Petrocik 1999; Norrander 1999). From 1952 to 2004, the percentage of women identifying with the Republican Party declined 5 percentage points, from 58 to 53%. During this same period, male Democratic Party identification dropped from 59 to 43%, a difference of 16 percentage points. This pattern is even more pronounced among White voters. Figure 2 displays the percentage of White women and men identifying with the Democratic Party in each presidential election year, beginning in 1952. Over the course of the time series, White women become 9 percentage points less Democratic (with their support dropping to 46% by 2004); on the other hand, White men's support for the Democrats drops fully 21 percentage points by 1988 (from 58 to 37%, at which point the trend becomes ostensibly flat.

Gender Differences in Party Identification among Whites
The pattern in Figure 2 clearly illustrates two distinct periods in the recent history of the gender gap. From the 1950s to the 1980s, men and women were both becoming more Republican; however, it was the disproportionately large movement among men into the Republican Party that “caused” the gap. In the contemporary period, beginning with the 1990s, male partisanship remains unmoved while female partisanship is considerably more variable; thus recent changes in the gender gap must be attributable to fluctuations in the political choices of women (Box-Steffensmeier, De Boef, and Lin 2004; Kaufmann 2002).
The preponderance of gender gap research points to male-female differences in policy views as a primary explanation for gender differences in political behavior. Men are more conservative than women across a number of important political domains, and these differences in attitudes have behavioral implications (Chaney, Alvarez, and Nagler 1998; Shapiro and Mahajan 1986). Beyond the significance of attitudes, research also suggests that, at times, men and women attach varying levels of priority to certain political issues; thus changes in relative issue salience can magnify or diminish the size of the gender gap (Chaney, Alvarez, and Nagler 1998; Kaufmann and Petrocik 1999). In general, then, variations in the size of the gender gap may be caused by changes in the distribution of political attitudes, year-to-year variance in issue salience, or both.
The Gender Gap in 2004
As is evident in Figure 2, the Democratic Party was particularly attractive to women during the Bill Clinton era. By 2004, however, female enthusiasm for the Democratic Partyand its presidential nominee had waned. Especially noteworthy is the fact that the 2004 gender gap in voting was at a 12-year low. One possible explanation for the declining gender divide is that male-female differences in policy views may have been smaller in 2004 than they had been in prior years; analyses of public opinion data provide no support for this hypothesis, however. Indeed, research clearly illustrates that the magnitude of gender differences in issue opinion varies little over time (Kaufmann 2002). Simply, on many traditional political issues (i.e., social welfare spending, defense spending, reproductive rights, and racial policy) men and women have not become more or less polarized over recent election cycles.
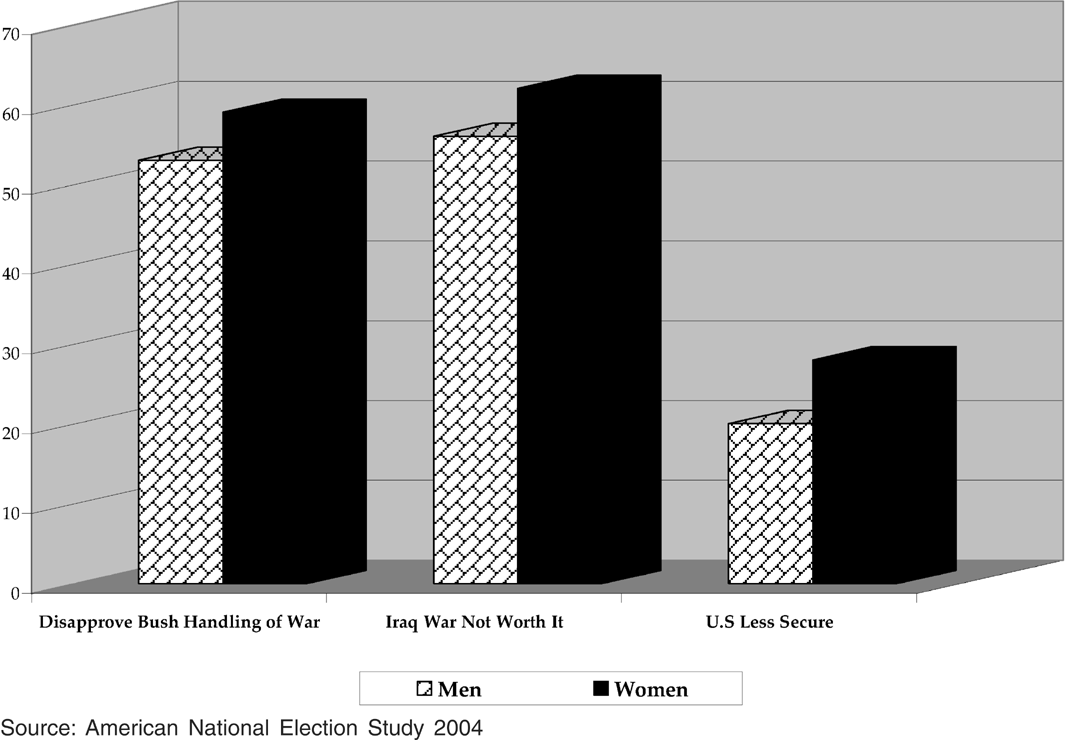
Given the increased prominence of national security after the September 11, 2001, terrorist attacks as well as the war in Iraq, voting in 2004 could reflect uncharacteristic unity between the genders on these topics of the day. The data in Figure 3, however, suggest otherwise. On questions of George Bush's handling of the Iraq war, on whether the war was “worth it,” and on whether the U.S. is now more or less secure, consistent male-female differences emerge. As has historically been the case, men are considerably more hawkish than women across all three measures.

National Security and War Opinions by Gender
Aggregate public opinion data from 2004 indicate that male-female differences in political views are largely what one might expect; men are more conservative on social welfare issues, more hawkish on war related concerns, and quite comparable to women on abortion rights, female equality, and gay marriage. In light of these data, recent changes in public opinion would not appear to explain the diminishing gender divide. If the gender gap in political views did not change in 2004, then perhaps changes in issue priorities can explain the waning divide.
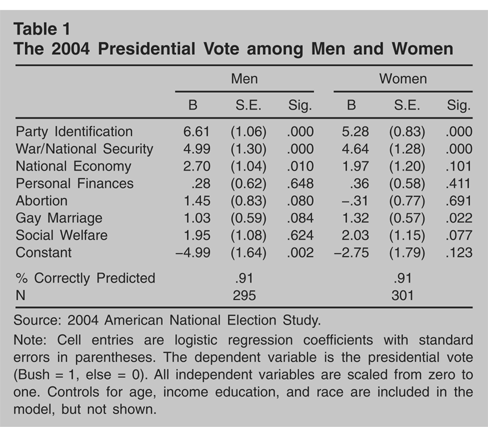
In order to explore this possibility, I modeled the 2004 vote by gender. The results of this analysis are found in Table 1. The dependent variable is dichotomous (support for Bush versus support for other candidates). The explanatory variables include party identification, income, education, age, race, as well as opinions on a range of policies atop the 2004 public agenda. The War/National Security measure combines opinions on Bush's handling of the war, whether the war was worth it, and whether the Bush administration has made the U.S. more or less secure. The National Economy variable is a sociotropic appraisal of the economy over the past four years. The Personal Finances measure is an appraisal of whether one'spersonal finances have improved or worsened over the past year. The Abortion and Gay Marriage variables are single-item indicators that gauge support or opposition to legal abortion and gay marriage, and the Social Welfare Attitudes variable is an additive measure that combines three questions pertaining to the appropriate size of government and the government's responsibility to provide healthcare and jobs. All of the independent variables are scaled from zero to one to facilitate comparisons within and between models.
The 2004 Presidential Vote among Men and Women

Table 1 confirms the conventional wisdom that opinions regarding the war and national security were particularly consequential to the vote. Even controlling for the traditionally powerful effects of partisanship, these concerns meaningfully shape voting behavior for both men and women. Furthermore, the differences between the male and female coefficients with respect to party identification and war attitudes are not significantly different from one another. Simply, there are no large discrepancies in issue salience between men and women in 2004. Therefore, it appears that traditional voting models of the aggregate electorate provide little explanation for the diminishing gender divide.
Was it the Security Moms?
One of the more popular media accounts coming out of the 2004 election suggested that the “soccer moms” of the 1990s had turned into “security moms.” Once con- sidered an important swing constituency for the Democrats, these anxious mothers were now said to be swinging to the Republicans over issues of national security. Always looking for nifty storytelling aids, the media seized on the myth of the security mom and it instantly became a viable explanation. The only problem is that it was not true.
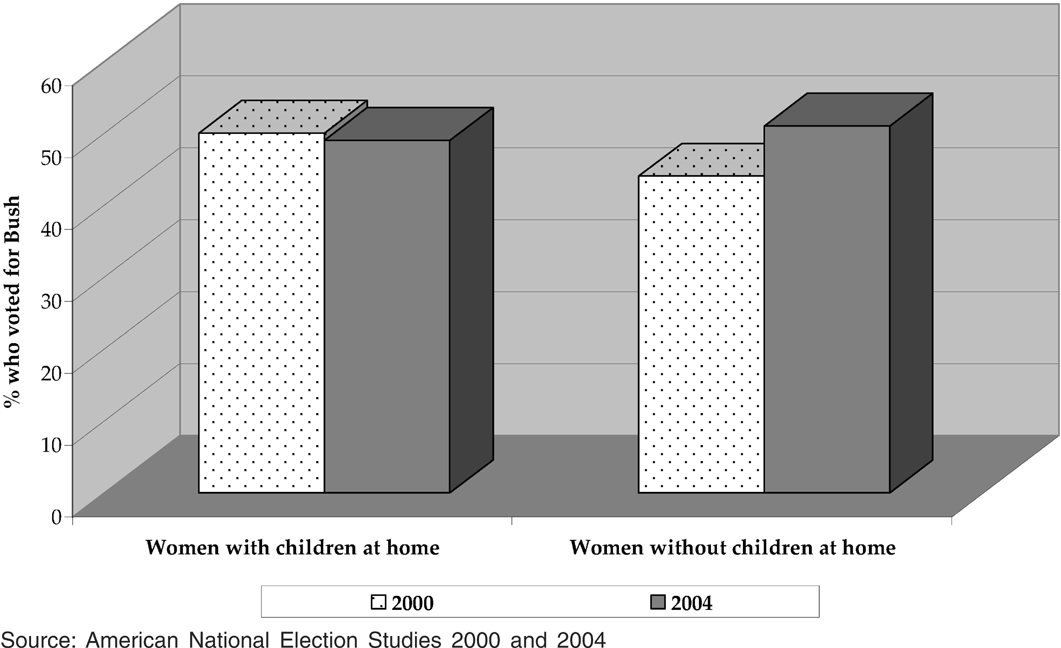
Findings from the 2004 ANES show that mothers with children at home were no more likely to vote for Bush in 2004 than they had been in 2000. As shown in Figure 4, approximately 50% of women with children at home voted for Bush in 2000 while 49% voted for him in 2004. If anything, the Republicans appear to have picked up votes among women without children at home; 44% of them supported him in 2000 versus 51% in 2004.

The Security Mom Myth
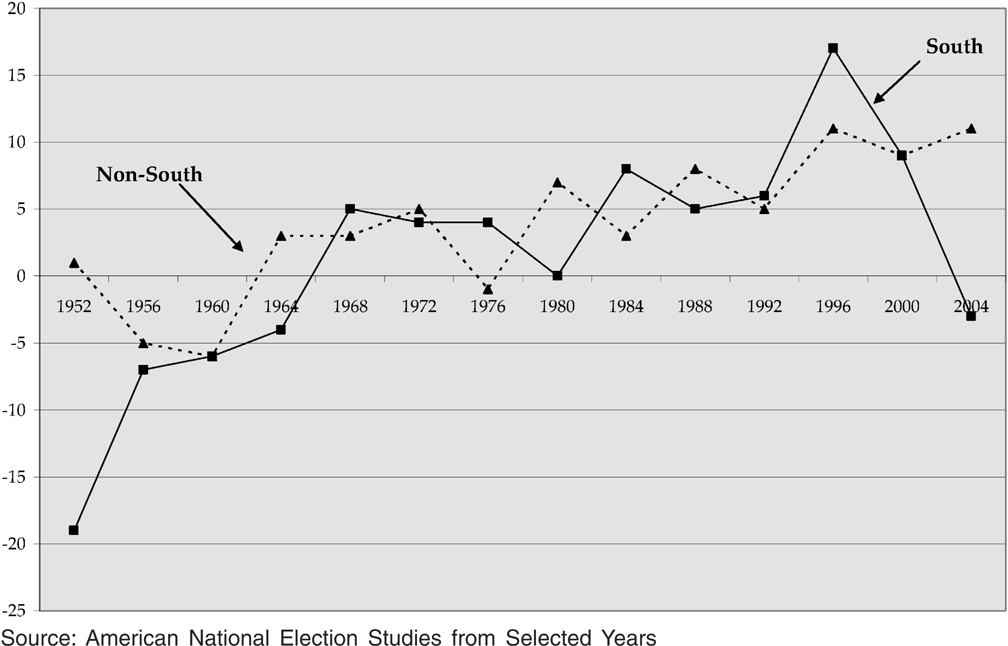
The important story from 2004 had little to do with the mythical security mom; rather, the gender gap between White men and women exhibited regional differences large enough to explain why the overall gap between men and women was so much smaller at the ballot box. Southern White women moved to the Republican Party and supported the Republican presidential candidate in much higher proportions than in the recent past. Although the gender gap between White Southern men and women was a full 11 percentage points in 2000, it fell to only 5 points in 2004. Even more striking, the presidential vote gap in the South hit its lowest point in 40 years (see Figure 5). Compared to White Southern men, Southern women chose Bill Clinton over Bob Dole by a 17-point margin in 1996 and preferred Al Gore to George W. Bush by 9 percentage points in 2000. In 2004, however, Southern women favored Bush by a 2-point margin over Southern men.3
Given the relatively small sample size of the 2004 ANES, I looked to verify this pattern using additional data. My analysis (not shown) using the state exit poll data collected by Edison Media Research and Mitofsky International shows similar patterns to the ANES; furthermore, the gender gap in the South is not constant across states. There is considerable variance across the 11 Southern states ranging from a high 8-point margin (in favor of the Democrats) in Virginia, to a low, negative 7-point margin for the Republicans, in Mississippi. The gender gap in the remaining states fluctuates in a +/− 3-point range around 0.

White Gender Gap in Presidential Voting—South vs. Non-South
The 2004 election was notable for its high level of partisan voting; however, Southern women were conspicuous outliers. Among self-identified White Democrats, 88% of Southern men, 90% of non-Southern men, 91% of non-Southern women, but only 75% of Southern women cast their votes for John Kerry. Conversely, Southern women were the most loyal Republican partisans, with 98% voting for Bush.
Of the many reasons that Southern women may disproportionately have preferred Bush in 2004, the most obvious surrounds questions of war and national security. These issues were new to the 2004 election, and were (as evidenced in Table 1) extremely important with respect to voting behavior. If Southern women were more supportive of the war than non-Southern women, this could potentially explain the high Democratic Party defection rates as well as the collapse of the vote gap in the South.
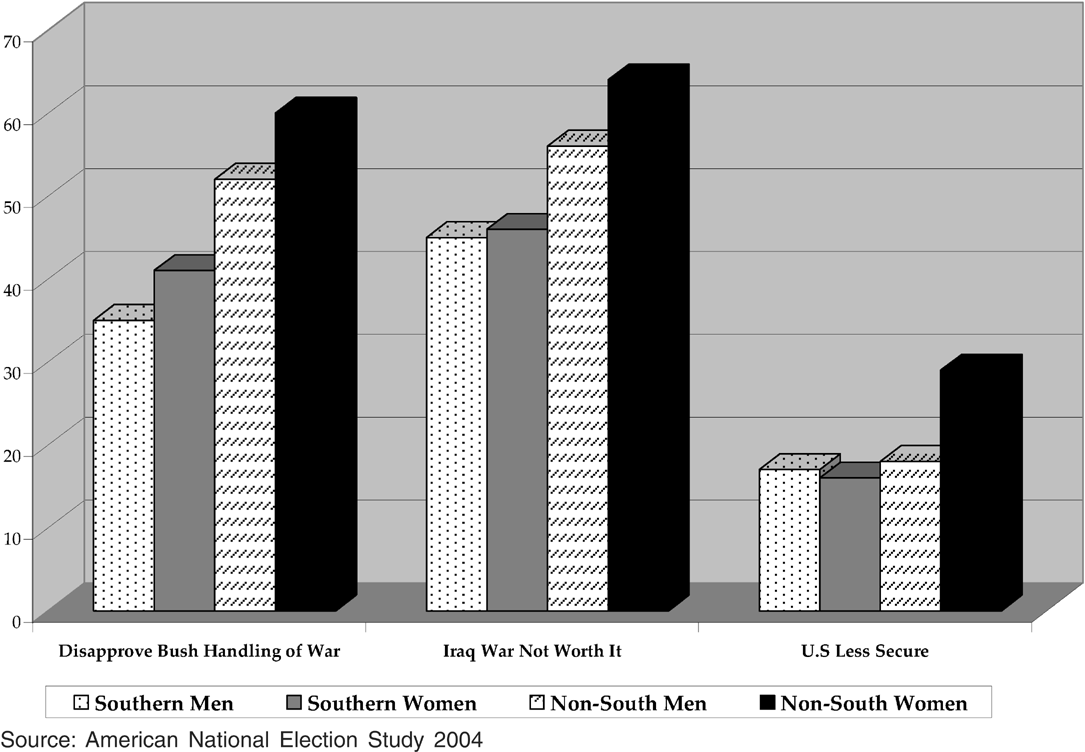
The data in Figure 6 reveal gender and regional differences in response to national security concerns and opinion about the Iraq War among White voters. While the gender gap on the question of Bush's handling of the war are roughly equal in the South and elsewhere (6 points versus 8), the Southern gender gaps on whether the war was worth it and on whether the administration had made the U.S. more or less secure were only 2 points and 1 point, respectively. Gender discrepancies outside of the South were considerably larger: 8 points on the issue of the war and 11 points on the question of national security. The regional differences between Southern and non-Southern women are greater than male-female differences. Southern women are 19 points more approving of Bush's handling of the war than are women elsewhere; they are 18 points more likely to say that the war has been worth it; and they are 13 points less critical of the administration on the national security issue. In all, White Southerners (both men and women) supported the war effort to a much greater degree than people living outside of the South. The combination of smaller gender differences in the South and the particularly high level of importance that all voters assigned to war-related issues combine to explain the shrinking gender gap in 2004.

White Opinion on War Issues—Gender and Regional Differences
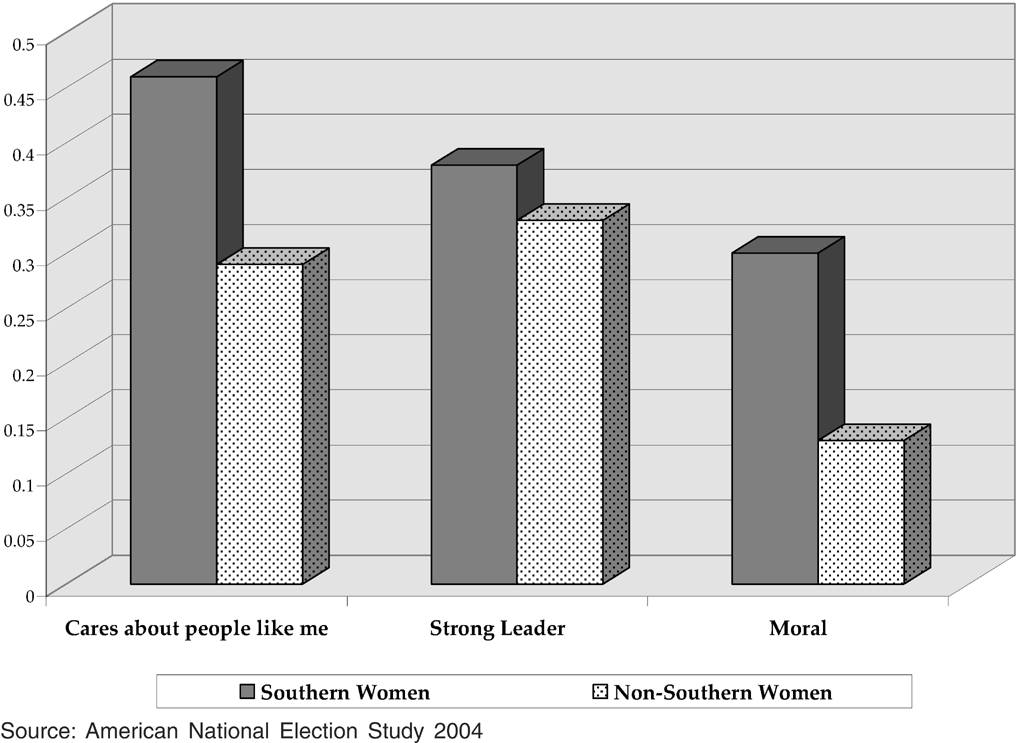
Finally, this research points to significant differences in candidate trait evaluations between women in the South and elsewhere. The ANES asks respondents to rate the major party candidates on a variety of traits such as morality, leadership skills, and whether the candidate “really cares about people like you.” The standard trait question poses a statement (such as “he is moral”) and asks the respondent how well the statement describes the candidate. Possible answers are arrayed on a four-point scale from “extremely well” to “not well at all.” In general, individual perceptions of candidate traits are often imbued with substantial partisan overtones. Republicans tend to think better of their respective leaders as do Democrats, but divergent opinions regarding Bush and Kerry extended well beyond the partisan divide.
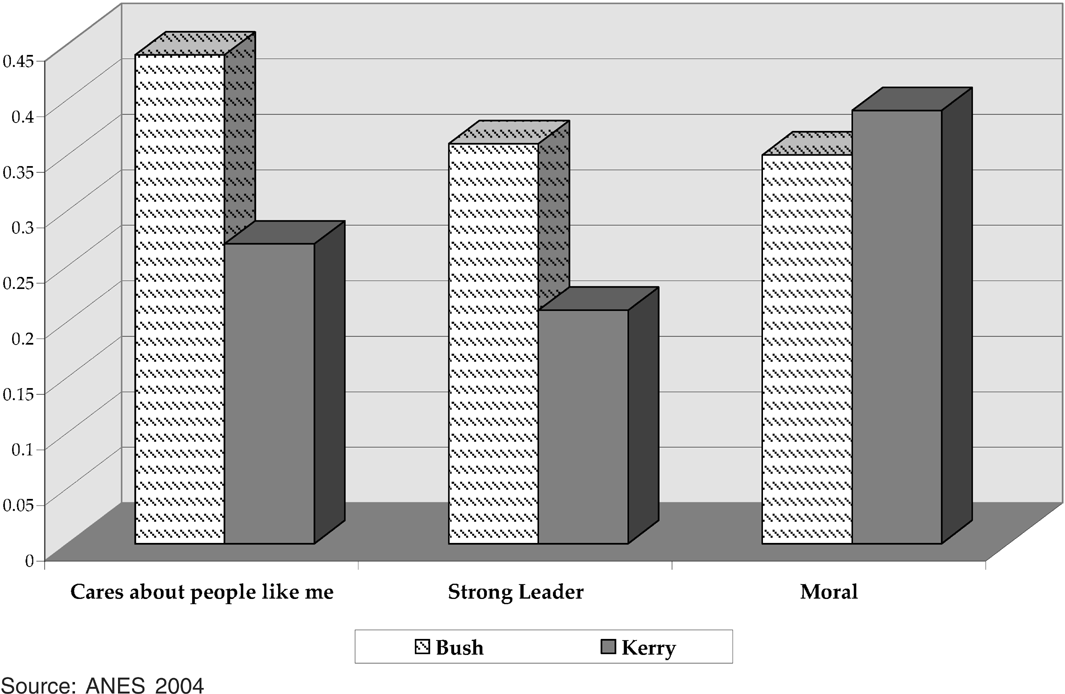
Figure 7 presents the difference in mean trait evaluations between Southern and non-Southern women for George W. Bush and John Kerry. Across the three traits mentioned, regional differences in the mean scores are substantial and statistically significant. The regional disparities between trait ratings of Bush are (on average) more substantial than differences in Southern and non-Southern opinions of Kerry. The largest discrepancy between the women in the South and non-South appears on the question of whether Bush “cares about people like you.” In this instance, it is quite clear that Southern women feel a greater connection to Bush than do women who live outside of the South.

Mean Differences in Trait Evaluations (1–4 scale) Southern Women versus Non-Southern Women
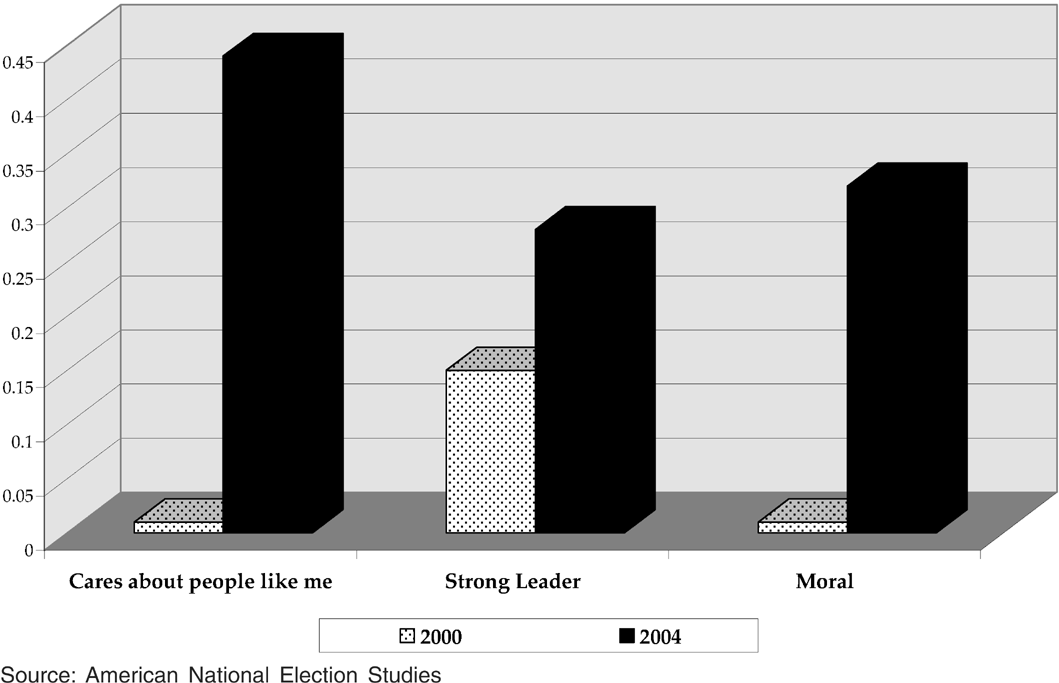
Regional discrepancies in women's ratings of Bush are also much greater in 2004 than they were four years earlier. The mean difference in ratings of Bush between Southern women and non-Southerners in 2000 and in 2004 is displayed in Figure 8. On the questions of caring and morality, regional differences were statistically insignificant in 2000. The disparity regarding perceived leadership skill was about half as large in 2000 as it was in 2004. Bush was largely unknown to the mass public when he ran for office in 2000, and female perceptions of Bush traits were not polarized by region. Over the course of the first Bush Administration, however, Southern women came to hold profoundly different views of the incumbent from those of their non-Southern counterparts.4
The regional differences in candidate evaluations were not constant across genders, however; they were particularly pronounced among women. Comparable analyses on the mean differences for men reveal smaller variations between the South and elsewhere.

Mean Differences in Bush Trait Scores (1–4 scale) between Southern and Non-Southern Women—2000 vs. 2004
Finally, it appears that traits and trait evaluations matter more to the voter choice of Southern women than to non-Southern women. Figure 9 shows the partial correlations of Bush trait evaluations with presidential vote choice, controlling for party identification. To the extent that trait evaluations are party-colored opinions, they should exert little independent influence over presidential vote choice. Figure 9, however, clearly shows that this is not the case. Rather, candidate choice among White Southern women in 2004 was much more closely tied to perceived traits than was candidate choice among non-Southern women; this is especially true with respect to perceptions of “caring.” Southern Democratic women who felt that Bush cared about people like them were more likely to defect from their partisan ties than were non-Southern women with comparable views. Political decisions are certainly not constrained to issue considerations; candidate qualities often combine with policy views to attract or repel voters. In the case of Southern women, character traits appear to have been particularly influential.

Partial Correlation with Presidential Vote Controlling for Party ID—Bush Traits
Additional analyses (not shown here) suggest that trait evaluations in general were more important to voting behavior in 2004 than they had been in 2000, particularly among Southern women. It is not necessarily surprising that candidate traits matter more when incumbents run for office. After all, retrospective evaluations of many varieties come into play in re-election campaigns. By the same token, there is no good, theoretically grounded reason why Southern women should be particularly reliant on traits. In fact, the pattern in 2004 deviates considerably from 1996 (the previous presidential election with an incumbent on the ballot); in that election, regional trait differences were not nearly as pronounced. It is beyond the scope of this article to fully explain the unique regional patterns from 2004. It seems worth noting, however, that Clinton, Gore, and Bush are all Southerners of one stripe or another, and that the lukewarm response to John Kerry, especially among Southern women, may reflect a preference for candidates with a Southern sensibility.
Conclusion
The gender gap in partisanship and voting behavior was notably modest in 2004, especially in comparison with its apex eight years earlier. The shrinking gender gap was not a universal phenomenon, however; important regional differences in candidate trait evaluations and support for the Iraq war appear to have mitigated the gender divide among White voters in the South. Historically, the Southern gender gap has equaled or exceeded male-female differences elsewhere. In hindsight we may find that the unique circumstances surrounding the 2004 election (in the aftermath of terrorist attacks and during a U.S.-led military invasion) render this election an outlier. The gender gap traditionally is understood as a function of male-female differences in public opinion and issue priorities; thus, to the extent that the salience of military concerns wanes over time in favor of more traditional domestic issues such as social welfare spending, the gender gap in the South may very well rise again. Alternatively, if the newfound Republican affinity among Southern women continues to hinge disproportionately on candidate traits, then the Democratic Party may need to nominate someone with greater appeal to Southern women in order to reinvigorate the gender gap.
Biography
Karen M. Kaufmann is associate professor of government and politics at the University of Maryland. Her research on the gender gap has appeared in the American Journal of Political Science, Public Opinion Quarterly, and Political Behavior.