INTRODUCTION
The hypothesis of an African origin for some of the cultural traditions of late Western European prehistory is not new. In the early 20th century, Edmond Vignard proposed that the Tardenoisian, a facies of the European Mesolithic involving large blade and trapeze industries, originated in the Sebilian in the Aswan region in Upper Egypt (Vignard Reference Vignard1923). However, this scenario ran up against the absence of any archeological records showing links between the two geographical areas and was quickly abandoned. Subsequent research into the Mesolithic carried out between the two wars focused instead on defining the regional identities of the different cultural groups based on excavations conducted at major stratified sites such as La Cocina in Spain (Luis Pericot excavations 1941–1945) and le Cuzoul de Gramat in southwest France (Lacam et al. Reference Lacam, Niederlender and Vallois1944). In the 1950s, John Grahame Douglas Clark demonstrated the relatively contemporaneous appearance of large blade and trapeze lithic industries in late prehistory throughout Western Europe (Clark Reference Clark1958). Though highly relevant, his work had little impact on prehistoric research, especially in France. Indeed, researchers in the 1970s and 1980s sought mainly to demonstrate the regional persistence of the different technological traditions and their place in the continuum of Paleolithic practices (Fortea Pérez Reference Fortea Pérez1975; Rozoy Reference Rozoy1978).
Since the 1990s, research into the Mesolithic period in southwest Europe has undergone a revival with new fieldwork and several doctoral theses being carried out. Re-examining these industries has brought renewed attention to Clark’s findings, perhaps due to the greater internationalization of research. These new studies have revealed the existence of an abrupt, major change in the chipped stone industries during the 7th millennium cal BC. This shift was so significant that in recent years the Western European Mesolithic has been divided into two successive chrono-cultural groups (Marchand Reference Marchand, Fagnart, Thévenin, Ducrocq, Souffi and Coudret2008). In the early Holocene, the First Mesolithic includes groups whose lithic industries are characterized by the production of short, irregular bladelets fashioned into microlithic or hypermicrolithic triangular projectile points. The Sauveterrian of southern France and northern Italy is one of the best-known illustrations of this. In the Second Mesolithic, the lithic industries are based on the production of large blades obtained by indirect percussion and/or pressure, which were then shaped into trapezes that were hafted in a radically different way from previous periods. This profound upheaval in the industries of the seventh millennium cal BC can be observed throughout the western Mediterranean, leading to the recognition of diverse cultural entities, such as the Upper Capsian in North Africa, the Castelnovian in Italy, Croatia and southern France, and the Late Mesolithic of the Spanish Levante.
About 10 years ago, under a first group programFootnote 1, we sought to identify the very earliest occurrences of industries related to this Late Mesolithic on the northern shores of the western Mediterranean, including many new radiocarbon (14C) dates (Perrin et al. Reference Perrin, Marchand, Allard, Binder, Collina, García Puchol and Valdeyron2009). We were able to establish that the oldest examples of large blades and trapezes were located in southern Italy and Sicily, dating to around 6800–6600 cal BC. Rapidly following this, dating to between 6600 and 6400 cal BC, these industries have been observed on all the northern shores (Italy, France, and Spain), in such a short space of time that we have described this process as a “Mediterranean flash” (Perrin et al. Reference Perrin, Marchand, Allard, Binder, Collina, García Puchol and Valdeyron2009).
It is particularly noteworthy that the conceptual schemes underlying the chaînes opératoires and the technological choices involved are very similar throughout the area concerned. The knappers preferentially sought small quantities of good-quality siliceous material, usually pebbles, on which they knapped blades on the broad side of the cores by pressure with virtually no preparation. This lack of preparation of the pebbles led to the production of blade blanks with a relatively irregular profile and silhouette. These blanks were then segmented using the microburin technique to produce trapezes which were, in these early cases, relatively short and symmetrical.
The strong dichotomy between this scheme and previous ones, the extreme rapidity with which it spread, its similarity throughout the Western Mediterranean and the absence of any correlation with climate and environmental changes (Marchand and Perrin Reference Marchand and Perrin2017) suggest that this rapid spread could reflect population movements. Moreover, the slowing down in its diffusion between 6500 and 6400 cal BC may suggest a period of assimilation and recomposition of these new methods by indigenous populations. This hypothesis would explain the greater variability in the pieces that one encounters after 6400 cal BC, the expansion of these types of production suggesting a diffusion of concepts rather than individuals. This scenario obviously raises the question of an exogenous region of origin for these upheavals and possible population movements. The Near East and Crimea, where pressure knapping is also observed, are unlikely points of origin for the industries of the northwestern Mediterranean, due to significant chronological differences, geographical distances, and the absence of any archeological records showing links (Binder et al. Reference Binder, Collina, Guilbert, Perrin, García Puchol and Desrosiers2012).
At the current state of research, the most likely hypothesis according to the principle of parsimony is that these innovations originated in North Africa. The Upper Capsian which developed there is well known for the quality of its pressure knapping (Tixier Reference Tixier1976), represented in its advanced stages by extremely regular, large blades, as well as very unique mitred cores, which evolved at the end of the sequence into even more regular pieces referred to as “bullet shaped” cores. However, some other sites demonstrate the use of small cores made on pebbles or small blocks and a much less regular form of pressure knapping, which could correspond to the beginning of the sequence and which are reminiscent of the lithic industries of southwest Europe (see, for example, Rahmani Reference Rahmani2003: Fig. 187, p. 218).
In 2016 and 2017, we conducted a collective research program entitled “From the Mesolithic to the Neolithic in the western Mediterranean: the African Impact”. In this context, we re-evaluated several North African lithic assemblages from older excavations with the aim of better characterizing the industries of the early Holocene from a techno-typological perspective, in particular the first examples of pressure knapping, and establishing their chronological position. These new chrono-cultural data have made it possible to develop a reliable basis for testing the hypothesis of a North African origin for the innovations of the Late Mesolithic.
The Northern African Contexts
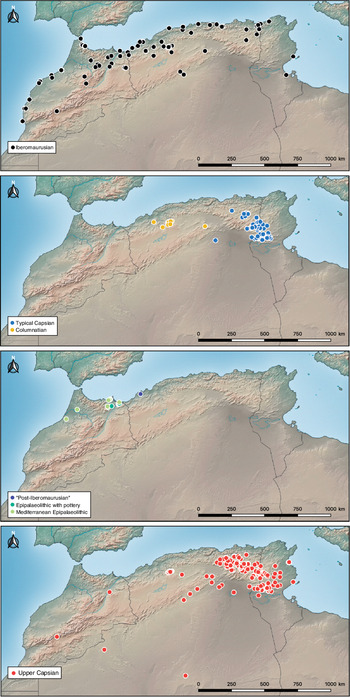
The early Holocene in North Africa is documented by a large number of sites pertaining to several different cultural groups (Figure 1). These groups have been defined to varying degrees and in many cases involve archeological “traditions” rather than prehistoric realities. It would therefore be well worth redefining many of them in greater detail.
Distribution maps of late Pleistocene and early Holocene archaeological sites in North Africa by major cultural entities. The attributions of the sites are those of the authors of the original publications.

This is particularly the case for the Iberomaurusian, a concept developed in the early 20th century by Paul Pallary following the connections made between his own discoveries in Algeria and those of Louis Siret in Andalusia (Pallary Reference Pallary1909). The relationship with the Iberian Peninsula was subsequently rejected but the name stuck. This industry is defined in particular by the production of bladelets by percussion knapping and the presence of a very large number of microlithic backed bladelets produced using the microburin segmentation technique. In geographical terms, it designates sites from Morocco to Tunisia and even Libya. These sites are particularly numerous in the coastal areas but are observed to the south as far as the Saharan Atlas. The chronological range covered by this North African “culture” extends roughly from the 20th to the 7th millennium cal BC. By its very amplitude, it is clear that this name covers very diverse and culturally different prehistoric realities. This observation is not new, and one only needs to read the first few pages of Lionel Balout (Reference Balout1955) to be convinced of it. Unfortunately, this observation has not yet led the notion to be abandoned nor to be replaced by other more coherent entities. There is still more work to be done here, despite some recent proposals which have for the time being remained fruitless (Barton et al. Reference Barton, Bouzouggar, Collcutt, Gale, Higham, Humphrey, Parfitt, Rhodes, Stringer and Malek2005; Barich et al. Reference Barich, Garcea and Giraudi2006). A recent doctoral thesis has provided an overview of the knowledge of this area and has contributed new data on the lithic industries (Sari Reference Sari2012).
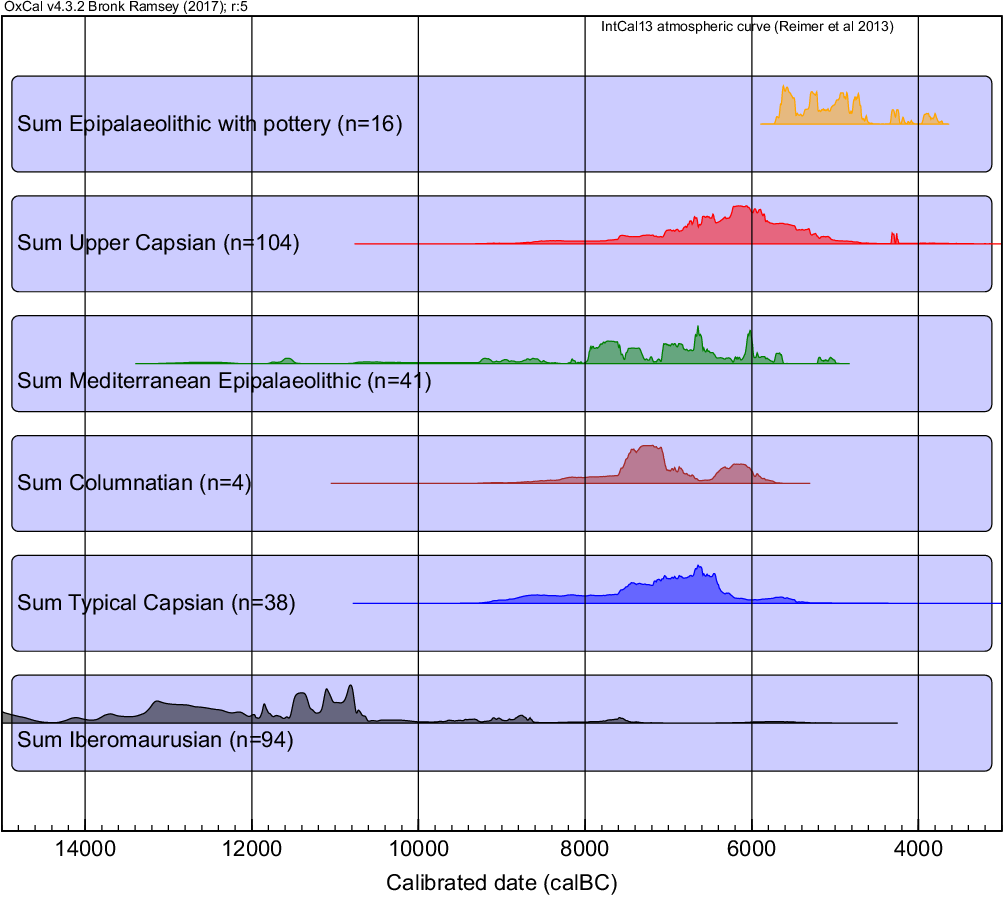
The chronological data have been enriched by about 50 new radiocarbon dates made on short-life samples from the Taforalt sequence, forty of which directly concern the Iberomaurusian (Barton et al. Reference Barton, Bouzouggar, Hogue, Lee, Collcutt and Ditchfield2013). At Taforalt at least, the Iberomaurusian sequence occurred between 23,000 and 10,000 cal BC. A critical reassessment of the available dates for the Iberomaurusian, based on the nature of the dated material, the accuracy and the reliability of the measurements as well as their relation to the dated context, show that there are in fact very few reliable dates after 10,000 cal BC, thus putting an end to the hypotheses of the parallel development of the Capsian and the Iberomaurusian and a continuation into the Neolithic (hypotheses summarized by Camps [Reference Camps1974: 52–56], and which the author himself later rejected [Camps Reference Camps2000]). Only the thermoluminescence measurement on a burned tool found near the skeleton in Hattab II cave in Morocco (Barton et al. Reference Barton, Bouzouggar, Humphrey, Berridge, Collcutt, Gale, Parfitt, Parker, Rhodes and Schwenninger2008) has given a more recent, but also extremely imprecise and unconvincing result, of more recent occupations also present in this sequence (K-0311: 8900 ± 1100 BP, i.e. 9050–4740 cal BC at 95%).
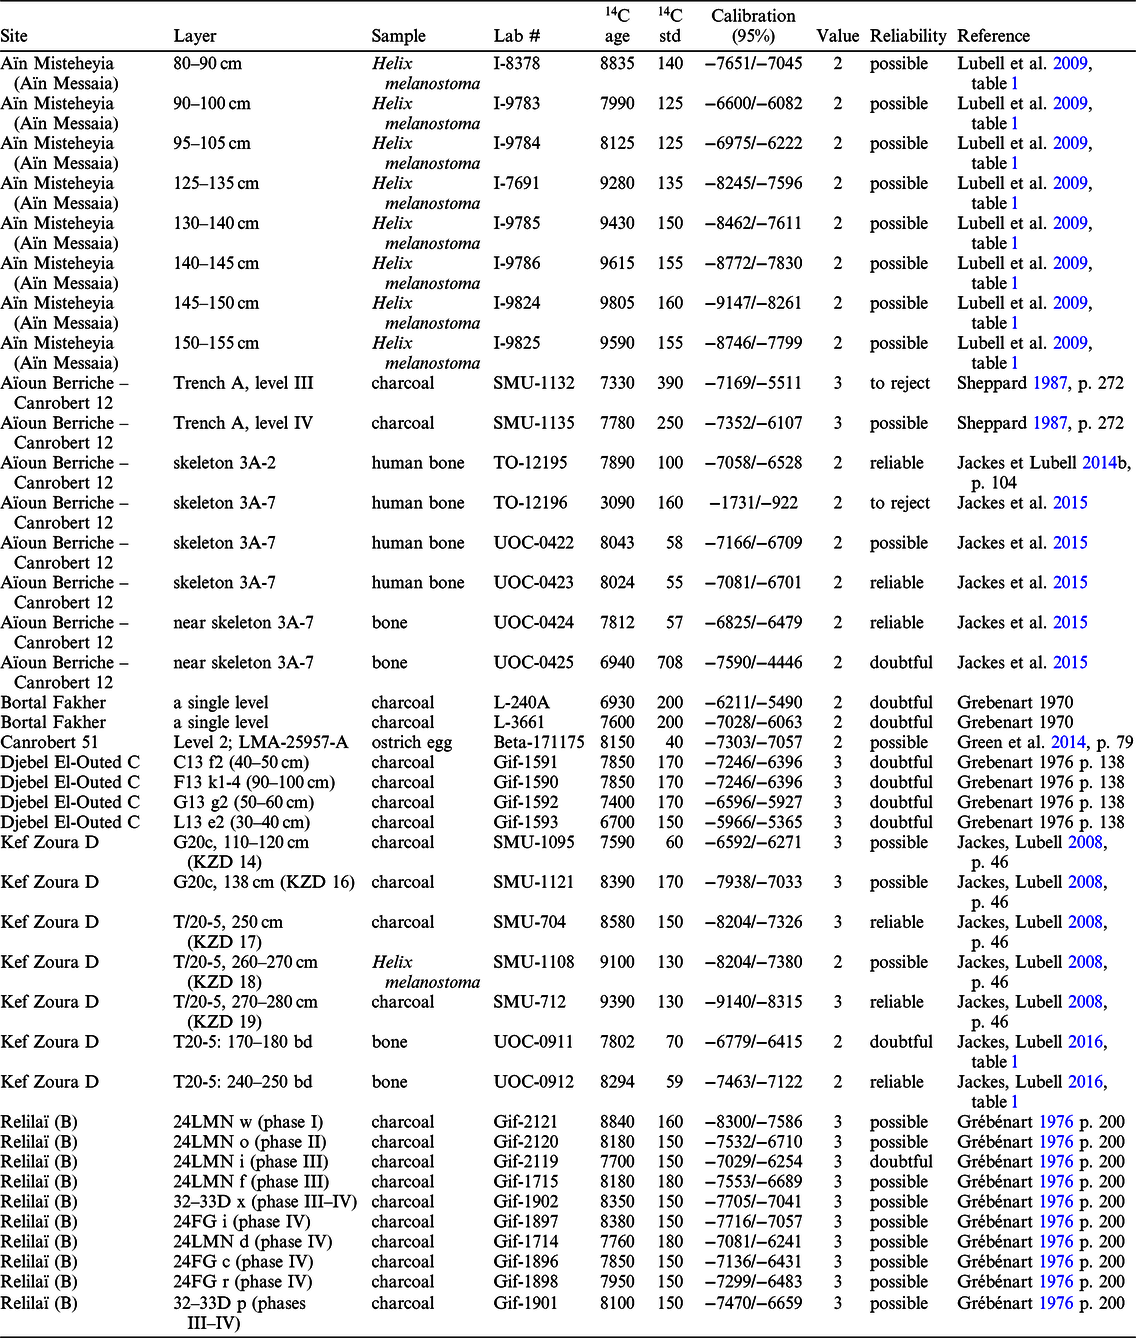
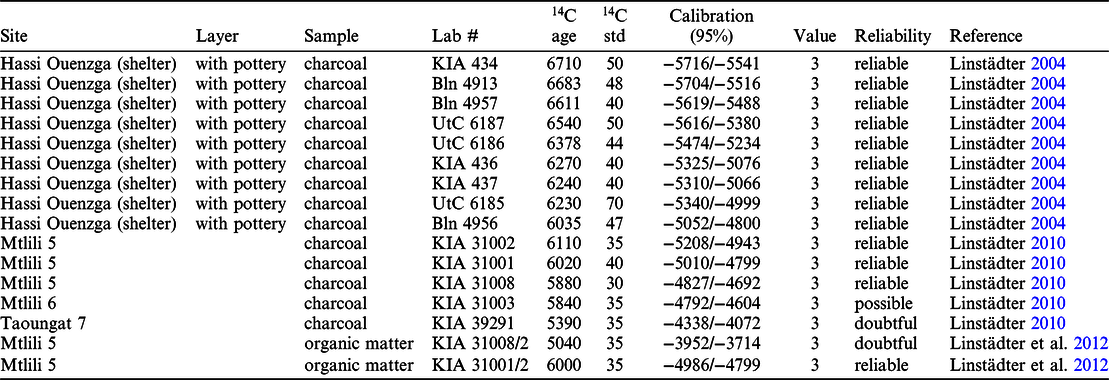
The early Holocene in eastern Algeria and Tunisia is mainly known for its Typical Capsian industry. In southern Tunisia, there is also a rather poorly known facies of “backed-bladelet” industry which is only represented at a few sites (Gragueb Reference Gragueb1983; Rahmani Reference Rahmani2004a). The Typical Capsian occurs a minimum of 94 sites, mainly concentrated in a slightly mountainous region near the towns of Tebessa and Gafsa. This industry does not seem to exist either further west or on the coast. Its absence, notably along the coast, was for a long time thought to be related to the persistence of Iberomaurusian populations in these regions, a hypothesis that no longer stands today given the chronometric data, as we saw previously. The lithic industry of the Typical Capsian is mainly characterized by narrow-backed bladelets, associated with large tools made on flakes and large, thick blades: burins, end-scrapers, and thick backed blades made with crossed retouch (Rahmani Reference Rahmani2003). Only seven Typical Capsian sites have been dated (Table 1), and of the 38 dates, many are old, some have been performed on land snail shells and one on Ostrich egg shell without any estimation of the reservoir offset. Ostrich egg shell is generally considered reliable in African prehistory (Freundlich et al. Reference Freundlich, Kuper, Breunig and Bertram1989; Vogel et al. Reference Vogel, Visser and Fuls2001; Janz et al. Reference Janz, Elston and Burr2009), but numerous inconsistencies in dating have been noted by several authors (Rahmani Reference Rahmani2004a; Wuttmann et al. Reference Wuttmann, Briois, Midant-Reynes and Dachy2012). It appears that the ingestion of soil carbonates by ostrich may cause disturbances. In order to ensure the reliability of dating on this type of material, it is necessary to obtain a double measurement—one on the shell carbonate and the other on the organic carbon. In the absence of these procedures, measurements cannot be considered entirely reliable and must therefore be dismissed (Rahmani Reference Rahmani2004a). Several Typical Capsian dates were performed on Helix melanostoma land snail shells, especially at Aïn Misteheyia. Hill et al. (Reference Hill, Reimer, Hunt, Prendergast and Barker2017) provide an accurate estimate of the offset for H. melanostoma shell in North Africa (476 ± 48 14C yr) which, coupled with reliable new data on stable isotope composition for this species (Padgett et al. Reference Padgett, Yanes, Lubell and Faber2019), allows us to obtain more reliable values for land snail shell dates (Hill et al. Reference Hill, Reimer, Hunt, Prendergast and Barker2017, Reference Hill, Lubell and Laughlin2019). It is therefore possible to include such dates in the general chronological frame, so that 30 of the 38 currently available dates can be considered as reliable or possible, from four different sites: Aïn Misteheyia, Kef Zoura D, Relilaï (B), and Aïoun Berriche/Canrobert site 12. On this basis, the Typical Capsian is dated between about 8800 and 6400 cal BC, although most of the dates are between 7600 and 6400 cal BC (Figure 2). The older phase (between 8800 and 7600 cal BC) is best documented at Aïn Misteheyia and Kef Zoura D, but also probably at Relilaï. All three sites are situated in close proximity in the Télidjène Basin (Jackes and Lubell Reference Jackes, Lubell and Lubell2016: Fig. 1).
Radiocarbon dating published for levels assigned to Typical Capsian. Measurements are calibrated with the IntCal13 curve (Reimer et al. Reference Reimer, Bard, Bayliss, Beck, Blackwell, Bronk Ramsey, Buck, Cheng, Edwards and Friedrich2013) using the OxCal v.4.3 software (Bronk Ramsey Reference Bronk Ramsey1995). The “value” column refers to the work of Chapman and Müller (Reference Chapman and Müller1990) on the reliability of dated samples: 1 – direct dating of an artifact; 2 – Dating of a short-life ecofact, in context; 3 – Dating of a long lived ecofact, in context; 4 – Dating scattered ecofacts in a level. Their reliability is estimated according to this value and the consistency of these measurements with the other dates of the same deposit (if they exist) and cultural contexts. It is not confirmed that the three first Aïn Misteheyia samples (I-8378, I-9783, I-9784) date Typical Capsian levels (Sheppard Reference Sheppard and Lubell2016: 47–50). The dates made on Helix melanostoma have be calibrated using the reservoir effect value of 476 ± 48 14C yr (Hill et al. Reference Hill, Reimer, Hunt, Prendergast and Barker2017, Reference Hill, Lubell and Laughlin2019).

Probability sums (OxCal software v.4.3.2) of all radiocarbon dates available for the recent Prehistory of North Africa (all measurements are available on https://bda.huma-num.fr/).

Further to the west, but still in Algeria, excavations by Pierre Cadenat in the 1940s and 1950s at Columnata (Sidi Hosni) and Cubitus (Tiaret) led to the recognition of another cultural entity attributed to the early Holocene—the Columnatian (Figure 1). Observed only at these two sites, this facies with its microlithic industry constitutes a somewhat obscure point in North African prehistory and remains very poorly dated between the 9th and 7th millennium cal BC (Figure 2). These results are based on four old measurements made on charcoal samples and Unio shell from Columnata (Table 2). Gabriel Camps (Reference Camps1974: 203–214) incorporated these industries into an “Elassolithic” group comprising very small tools. The Keremian and the Kristellian are included in this group which has very poorly known typological, geographical and chronological characteristics.
Radiocarbon dates published for the levels assigned to the Columnatien. See Table 1 for more information on the “Value” and “Reliability” columns.

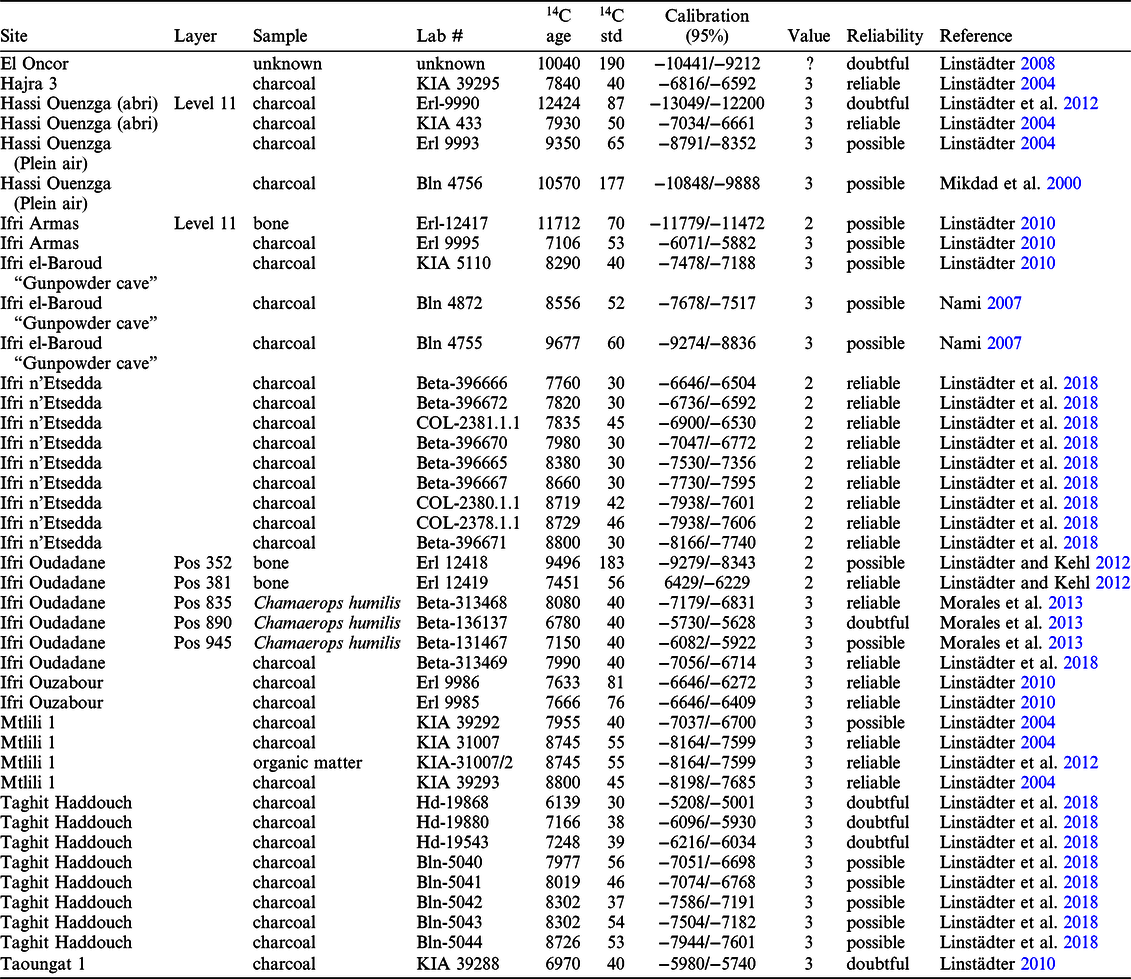
The density of the sites decreases even further to the west, and only a few are known in Morocco (Figure 1). They have been grouped under the name “Mediterranean Epipaleolithic” (Linstädter Reference Linstädter2008) and mainly developed after the Younger Dryas. About 50 dates place these sites between approximately 9000 and 6000 cal BC (Figure 2 and Table 3). The lithic industries, which are poorly known, appear to follow a relatively coherent evolution from the Iberomaurusian and can be situated in a more or less similar cultural development to that of the Columnatian. There are no signs of pressure knapping nor, moreover, the knapping of large blades or the production of trapezes. According to recent studies (Linstädter Reference Linstädter2008; Linstädter Reference Linstädter2015), this Mediterranean Epipaleolithic would be enriched at a later date in Morocco (between about 5600 and 4000 cal BC, Figure 2 and Table 4) with ceramics.
Radiocarbon dating published for the levels attributed to the Mediterranean Epipaleolithic of Morocco. See Table 1 for more information on the “Value” and “Reliability” columns.

Radiocarbon dating published for the levels attributed to the Epipaleolithic with pottery of Morocco. See Table 1 for more information on the “Value” and “Reliability” columns.

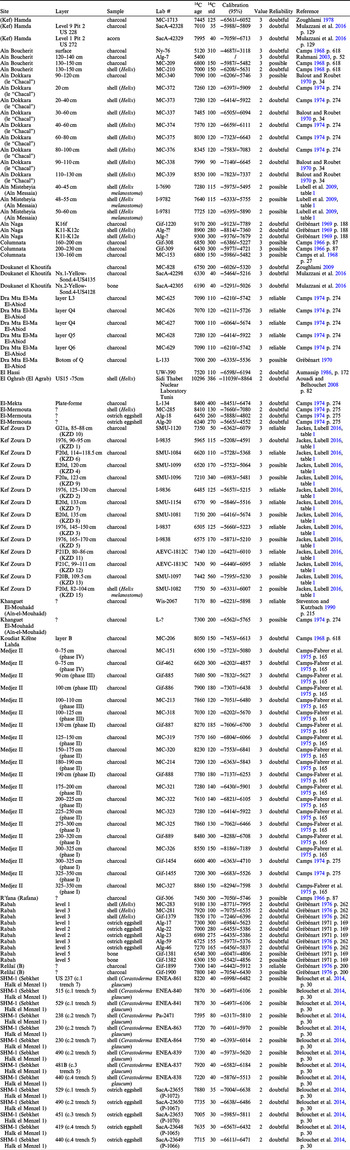
The Upper Capsian covers the same area as the Typical Capsian while extending more widely across eastern Algeria and Tunisia, but remains rare along the coast (Figure 1). The center of this group is found in the area straddling Algeria and Tunisia, in the region of Gafsa – Tebessa. This cultural group has an easily recognizable lithic industry, mainly based on blades and bladelets, the latter often produced by pressure knapping (Sheppard Reference Sheppard1987; Rahmani Reference Rahmani2003; Rahmani and Lubell Reference Rahmani, Lubell and Desrosiers2012). The arrowheads are trapezes, whith relatively symmetrical or elongated shapes evolve over time, obtained from large blades with the microburin segmentation technique (Sheppard Reference Sheppard1987; Rahmani Reference Rahmani2003; Rahmani and Lubell Reference Rahmani, Lubell and Desrosiers2012). These pieces are clearly reminiscent of the European Second Mesolithic, which we shall return to below. The Upper Capsian was one of the most studied groups in North Africa, especially its lithic industry, in the 1960s. The work of Jacques Tixier (Reference Tixier1963) and G. Camps (Reference Camps1955), for example, began to establish the basis of its characteristics. The chronological framework of the Upper Capsian involves a little over one hundred radiocarbon measurements (Table 5), but again, of often questionable quality. Nearly seventy of them should be dismissed due to lack of reliability. The forty or so remaining reliable or possible dates suggest that the Upper Capsian dates to between about 7000 and 5000 cal BC (Figure 2).
Published radiocarbon dates for levels assigned to Upper Capsian. See Table 1 for more information on the “Value” and “Reliability” columns. The dates made on Helix melanostoma have be calibrated using the reservoir effect value of 476 ± 48 14C yr (Hill et al. Reference Hill, Reimer, Hunt, Prendergast and Barker2017, Reference Hill, Lubell and Laughlin2019).

The chrono-typological organization of these different groups has generated much debate, from relatively linear models of succession to more complex scenarios such as the “branching evolution” proposed by G. Camps (Reference Camps1974). Noura Rahmani (Reference Rahmani2003) provides a more complete history of all these hypotheses. The absolute dates available have thus far been of little use in these debates and have sometimes even caused more confusion than clarification. On the basis of the existing dates, the chronology of all these groups and facies is highly confused and impossible to clearly define (Figure 2). Some of them are thus placed in extremely wide chronological ranges, sometimes covering three or even four millennia, or even more, which clearly makes no sense from an anthropological perspective. This chronological frame is based on 300 radiocarbon dates for the total of these periods in North Africa, as we have seen above, but many of them must be discussed or dismissed. These dates can be classified into three distinct categories (doubtful, possible and reliable) based on the estimate of the reliability between the measurement obtained and the event dated (Manen et al. Reference Manen, Perrin, Guilaine, Bouby, Bréhard, Briois, Durand, Marinval and Vigne2019: 5). Some results are given as unreliable by the laboratories themselves: they are then discarded, considered doubtful. The same applies to dates carried out on batches of charcoals, ostrich egg shells or any other type of unreliable sample. Some results are considered only possible. These include in particular measurements carried out in the past, with large standard deviations and therefore not very precise, or those for which information on the sampling contexts of dated samples is not sufficiently detailed. Only accurate and good quality measurements, carried out on short-lived samples and whose link with the dated event can be controlled, are considered reliable. A critical examination of this corpus shows that nearly 60% of these dates must be rejected, because they cannot be considered reliable.
In 2016 and 2017, the MeNeMOIA group research program “From the Mesolithic to the Neolithic in the Western Mediterranean: The African Impact” allowed us to rework all these questions and to revise the chronological framework in detail. This program was an opportunity to enrich a georeferenced database that currently lists about 600 sites in North Africa and includes over 300 dates. This open access databaseFootnote 2 is backed by a bibliographic database covering all of North AfricaFootnote 3, knowing that in terms of Western Europe the list had already been complied over the last 10 years under previous programs. Several research projects were carried out, particularly in the United States of America, allowing for the analysis of eleven lithic assemblages from sites that were for the most part completely unpublished, as well as other analyses, including about 50 radiocarbon dates. It is these new dates that we shall be presenting in this article.
MATERIALS AND METHODS
Materials
Several different fieldwork projects in the Maghreb region have been carried out in recent years or are under way and will, in time, undoubtedly contribute new fundamental data to our knowledge of the late prehistory of North Africa. Over the limited time (two years) of the MeNeMOIA program, it was clearly not possible to consider carrying out new excavations or to wait for the results of the current ongoing programs. However, drawing up an historiographical overview of the archeological research in these countries has allowed us to gain awareness of the existence of a large quantity of material and data produced during relatively old excavations, which had for the most part, been largely unpublished. Many assemblages have thus remained in Tunisian, Algerian, Moroccan and French museums but also, perhaps a little more surprisingly, in the United States of America.
Indeed, between 1925 and 1930, the Logan Museum of Anthropology at Beloit College (Wisconsin, USA) conducted archaeological work in Algeria and France in search of the origin of modern humans and to investigate possible prehistoric connections between Africa and Europe (Pond et al. Reference Pond, Romer and Cole1928, Reference Pond, Chapuis, Romer and Baker1938; Green et al. Reference Green, Mutri and Thompson2014). Most of the fieldwork was supervised by Alonzo Pond, the museum’s assistant curator. Pond, his wife Dorothy Pond, Beloit students, and local workers conducted surveys and excavations in several parts of northeastern Algeria and the Sahara. A large portion of the collected material was brought back to the Logan Museum. Pond began analyzing the collection using then-current typology, but his work was curtailed by the economic crisis of the Great Depression. With a few exceptions (e.g., Sheppard Reference Sheppard1987; Jackes and Lubell Reference Jackes, Lubell and Pond2014a; Green et al. Reference Green, Mutri and Thompson2014) the collections have since remained largely unstudied but are accessible at the Logan MuseumFootnote 4. In 1930, a team from the University of Minnesota (USA) worked alongside the Beloit crew for several months (Jackes and Lubell Reference Jackes, Lubell and Pond2014a, Reference Jackes and Lubell2014b); the Minnesota collections are also available for study.
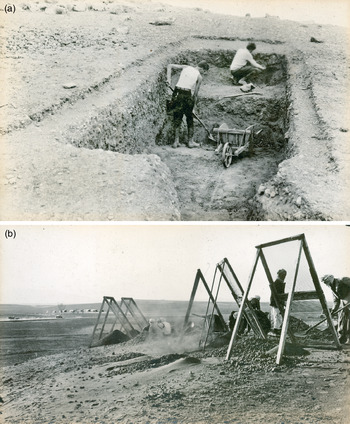
Most of the sites Pond excavated were snail shell middens or rammadiyat, some measuring over 100 m in diameter and 3 m in thickness. The excavation technique generally consisted of opening a trench from the margin with shovel and pickaxe, moving toward the center. Arbitrary levels were sometimes created, varying in thickness from 50 cm to 1 m. Most of the matrix was dry-sieved through a ¼ inch mesh (Figure 3). The recovered collections were sorted in the field camp. Most of the material Pond elected to retain consisted of tools. Field records are sparse, although photographs and participants’ diaries include archaeological observations. Despite the relatively scant documentation, examination of these assemblages in 2015 convinced us of their further potential and we therefore undertook a detailed study of several of them. We also determined that the use of arbitrary-level subdivisions within the trenches and the retention of faunal remains and bone tools as well as abundant lithic remains permitted research on the evolution and chronology of the lithic industries.
Original photographs of Pond excavations in 1930. (a) Beloit College students Daniel Riedel and Robert Krieger working by levels in the trench, Djebel Tarf (Canrobert site 25). Wisconsin Historical Society ©, Image ID 142954. (b) Dry-sieving of matrix through ¼-inch inclined mesh, Aïoun Berriche (Canrobert site 12); camp in distance. Wisconsin Historical Society ©, Image ID 142955.

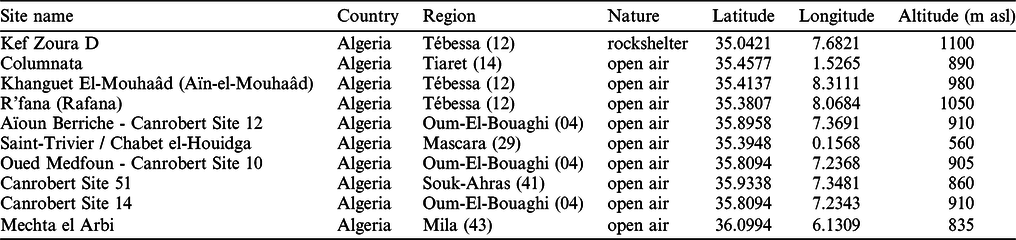
Over the course of several visits, we carried out initial examinations of the lithic assemblagesFootnote 5 curated at the Logan Museum. Most collections come from the region formerly known as Canrobert under French colonization, today known as Oum el Bouaghi, near the seasonal lake of Garaet Tarf and its tributaries. In this initial study, we sought to identify sites with either seemingly a single occupation (this was the case for Canrobert site 14 for example) or more complex sites in which the different levels appeared to show internal coherence, a relatively high number of lithic pieces and enough organic remains for us to be able to potentially carry out several radiocarbon measurements per level. We thus concentrated our work on the assemblages from six sites: Oued Medfoun/Canrobert site 10, Aïoun Berriche/Canrobert site 12, Canrobert site 14, Djebel Tarf/Canrobert site 25, Canrobert site 26, and Canrobert site 51 (Table 6). It should also be noted, even if this is not the purpose of this article, that these lithic collections are in a good to very good state of conservation, allowing for functional analyses to be carried out.
Geographical location of the sites studied in this article (the coordinates are expressed in WGS84 UTM 31).

Beyond these old excavations, we were also able to include data in this program from new excavations which have been in progress since 2016 at Columnata (dir. Yasmina Chaïd-Saoudi). The possibility of reducing the chronological confusion in which this site was situated with its complex stratigraphy seemed highly opportune to us.
The site of Kef Zoura D, excavated by a team directed by David Lubell between 1976 and 1978 (Jackes and Lubell Reference Jackes and Lubell2008; Lubell Reference Lubell2016), has also been the subject of several analyses. In this particular case, it was a matter of carrying out dating capable of bringing new elements to several questions on the chronological succession between the Typical Capsian and the Upper Capsian.
Methods
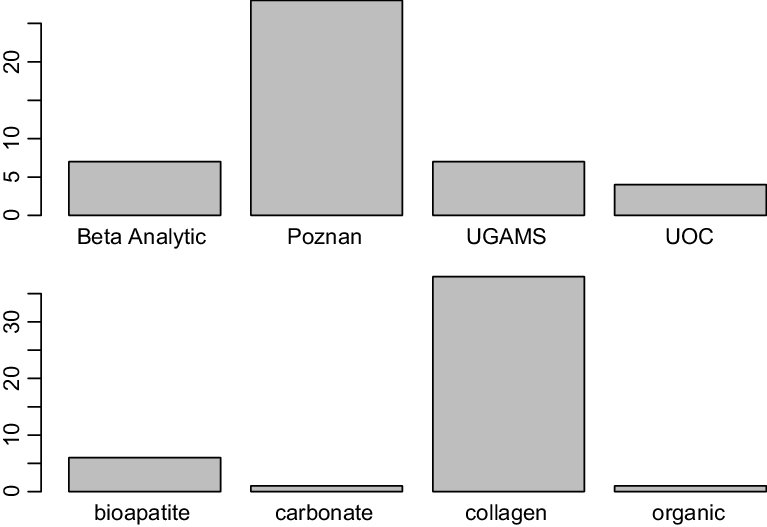
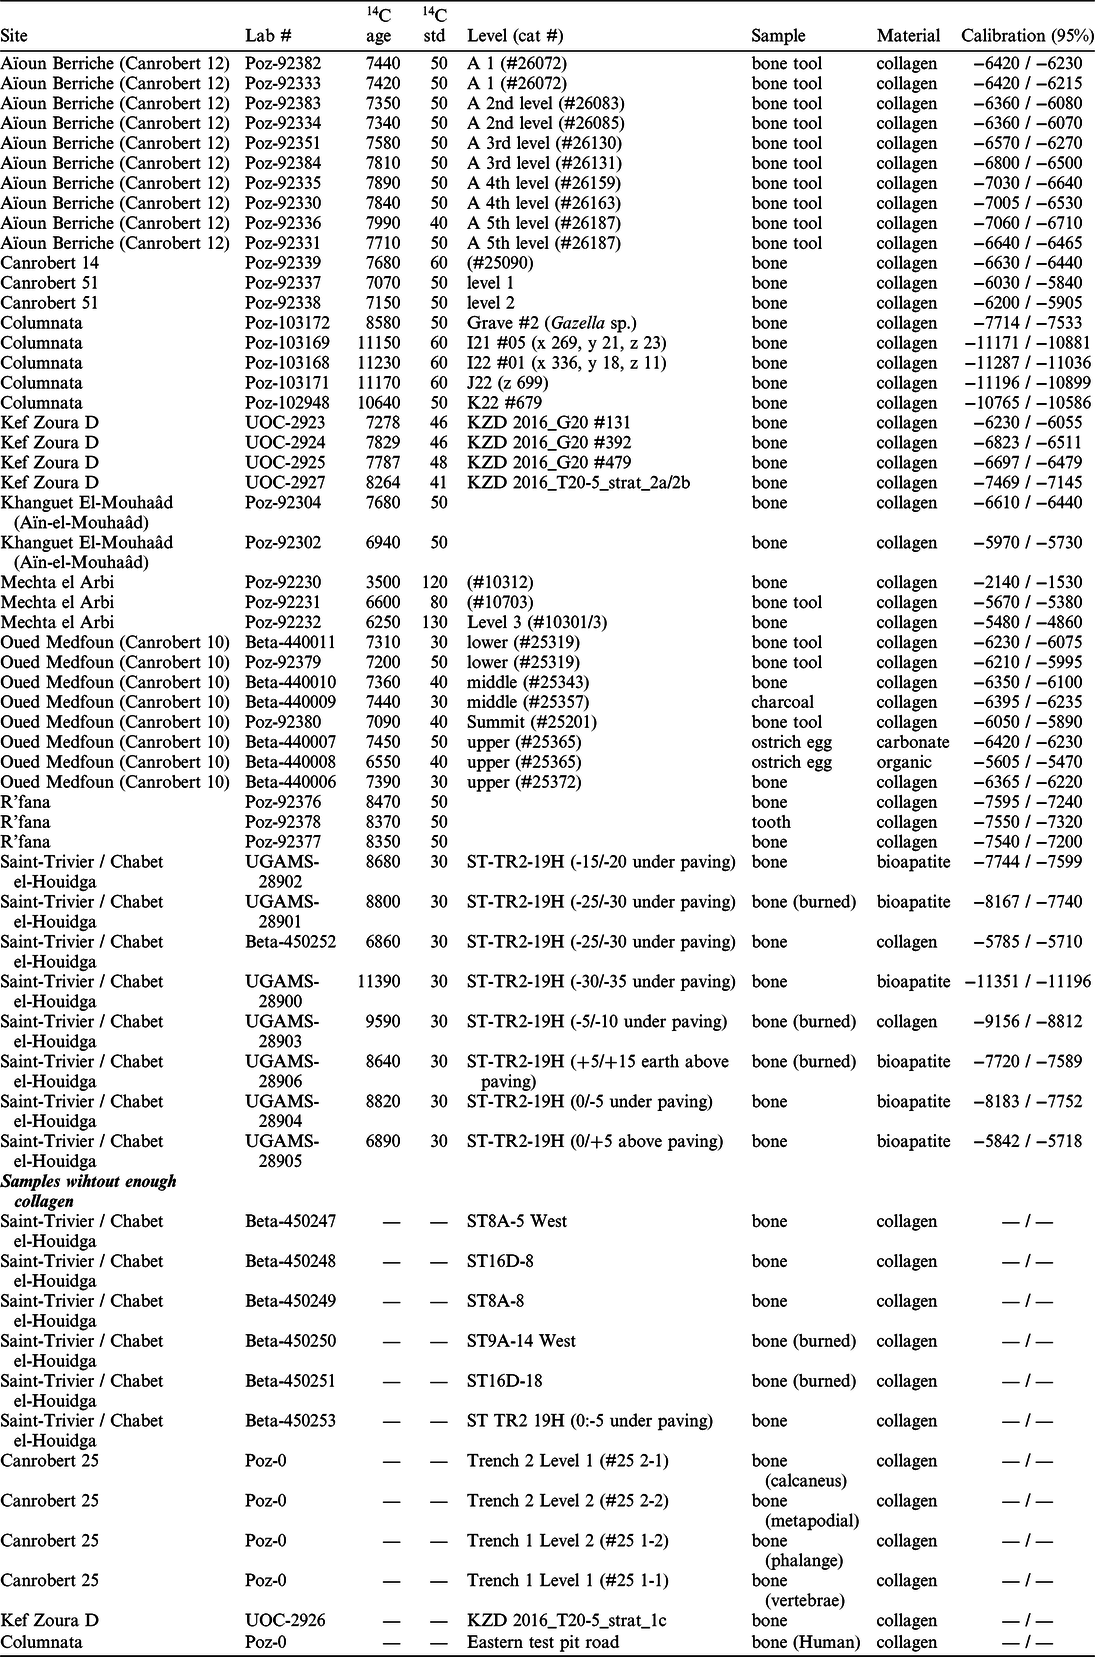
The MeNeMOIA project submitted sixty dating samples to four different laboratories (Poznań, Beta Analytic, Lalonde and UGAMS – Figure 4 top, Table 7). With the exception of a charcoal and an ostrich eggshell fragment, all dated samples are bone fragments or bone tools (Figure 4 below). In fourteen of these samples the collagen content was too low for AMS measurements. This poor preservation of collagen appears to be related more to the type of deposit rather than to the age of the materials. Bone preservation seems worse in open-air sites than in rock shelters. Saint-Trivier/Chabet el-Houidga illustrates this tendency with only one of the seven samples initially submitted to Beta Analytic suitable for dating (Dachy et al. Reference Dachy, Guéret, Campmas, Simonnet, Bon and Perrin2018). The great importance of this site for the characterization of the prehistory of western Algeria led us to submit seven new samples to the laboratory at the University of Georgia (USA), six for dating on bone bio-apatite. These measures, as we shall see, have given satisfactory results consistent with those made on collagen. Finally, we also dated an ostrich eggshell from Oued Medfoun (Canrobert 10) as well as measurements on charcoal. As we noted previously, a significant number of measurements have been performed on North African prehistoric ostrich eggshells. The diet of the ostrich leads this bird to regularly swallow carbonates present in the soil, so their eggs could have been artificially enriched in carbon, which would distort the measurements. As a test, it seemed appropriate to date an eggshell within a sequence where several radiocarbon measurements on bone and charcoal were also performed. We also carried out two analyses on this same eggshell fragment, one “classically” on the organic matter of the shell, the other on the carbonate, in order to test the coherence of these two measurements.
Barplots of the MeNeMOIA program dates (total = 46) according to the laboratories (top) and material types (bottom). The fourteen samples too poor in collagen to provide a measurement are not taken into account.

List of all dates made during the MeNeMOIA program.

All the results obtained were incorporated into Bayesian models established for each of the sites considered. Based on the artificial excavation levels and/or the stratigraphy recognized by the excavators, these models were made using Chronomodel (Lanos et al. Reference Lanos, Philippe, Lanos and Dufresne2015) and the IntCal13 curve (Reimer et al. Reference Reimer, Bard, Bayliss, Beck, Blackwell, Bronk Ramsey, Buck, Cheng, Edwards and Friedrich2013).
RESULTS
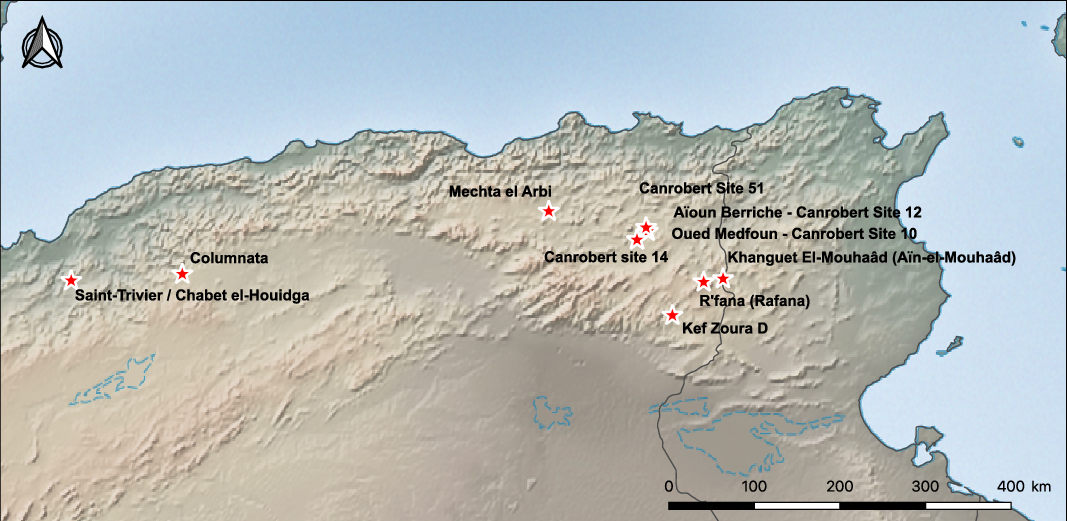
The 46 radiocarbon dates carried out as part of the MeNeMOIA program concerned 10 different sites, all located in Algeria (Figure 5). Measurements were also made on an eleventh deposit, Canrobert site 25, but the four bone fragments sent to the laboratory were too poor in collagen to produce a measurement. The typological, technological and traceological analyses will be the subject of additional publications; here, we present only the results of radiocarbon measurements carried out site by site.
Map of sites dated as part of the MeNeMOIA program.

Oued Medfoun (Canrobert Site 10)
Canrobert site 10 is one of the largest shell-mounds excavated by Pond during his Algerian expeditions of 1929 and 1930. Located in the immediate vicinity of Oued Medfoun, this rammadiya measures 100 m in diameter with a thickness of about 3 m. Pond opened two trenches. The first was located on the south side of the mound and was excavated on a north–south axis following three artificial levels: lower, middle and upper. The trench measured an average of 3 m wide but was sometimes extended to the west. The second area of excavation was located at the top of the mound (Summit Trench). The presence of several burials considered as intrusive prevented Pond from excavating by levels in that area. Data from the summit trench must therefore be considered with greater caution.
The Logan Museum houses nearly 2000 lithic artifacts from Oued Medfoun. The dominant raw material in all the sites of the Oum el Bouaghi region is a brown to light brown translucent and fine-grained flint of very good quality. Pressure knapping from small flint pebbles without special preparation is attested throughout the sequence. The proportions of the various tools and microliths (backed bladelets, trapezes, Aïoun Berriche points, oblique truncated pieces with ogival retouched base, etc.) vary only slightly between the levels.
We performed eight AMS measurements across all of the levels (Table 7). The lower level was dated by two measurements on the distal ends of two small bone awls. The middle level was also dated by two measures, one on bone, the other on charcoal. The upper level has been dated by three measures. The first was done on a bone fragment, as were most of the measures carried out as part of our program. Given the relatively large number of fragments of ostrich eggshell collected in this level we took the opportunity to check the consistency of the results obtained on this material with those made on bone. Two measurements were made on an ostrich eggshell fragment, one from the organic material of the shell (Beta-440008), the other from its carbonates (Beta-440007). The results obtained are not consistent (T-test = 195.7 for χ2 = 3.84 with df = 1 at α = 0.05), distant from each other by more than a millennium, suggesting a possible enrichment in fossil carbon. In addition, the measurement of organic matter (Beta-440008) also breaks with the other measures, all of which are in the 7th millennium cal BC. The global incoherence of ostrich eggshell dating in this case constitutes in our view an additional argument to reject all measurements made on ostrich eggshell as a precaution, especially in cases where dual measurement of organic material versus carbonate has not been performed, which is the case for all other measurements on this material in North Africa. Finally, the summit trench was also radiocarbon dated on a distal fragment of a bone tool.
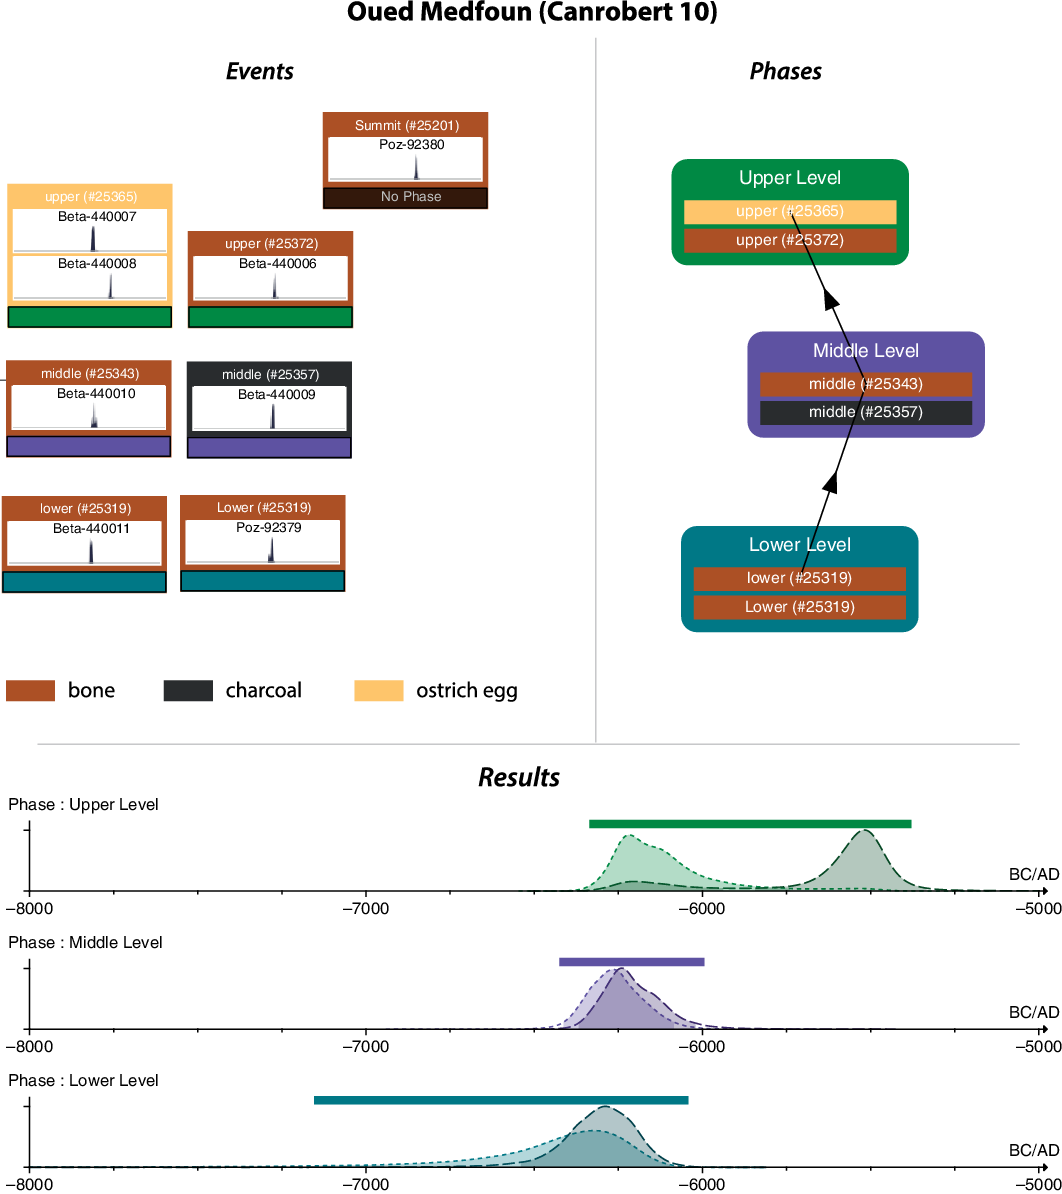
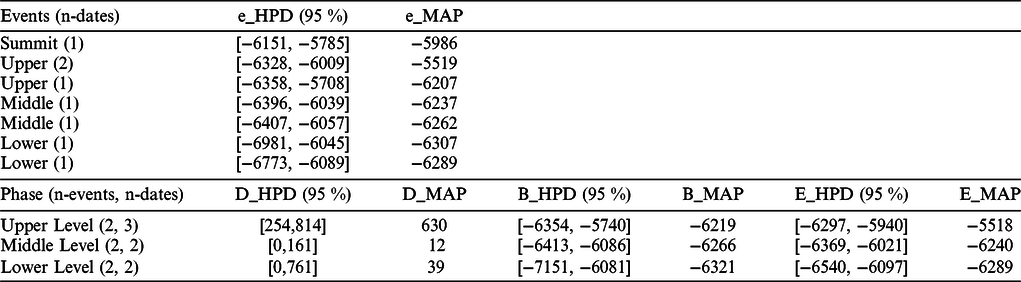
These data were integrated into a Bayesian model that respects the “stratigraphic” constraints, namely: lower level < middle level < upper level for the south–north trench, whereas the measurement from the summit trench cannot be directly constrained (Figure 6). Given the relatively poor stratigraphic context and rough excavation techniques, we chose not to put constraints between the events themselves but only between phases. The results obtained (Figure 6 and Table 8) show that all occupations of the site occurred during the second half of the 7th millennium cal BC.
Bayesian model of the Oued Medfoun (Canrobert 10) site (events on the left part of the diagram, phases on the right; ChronoModel 2.0.11). At the bottom, posterior density distribution of the model. The areas below the curves represent the 95% highest posterior densities. Arrows indicate the stratigraphic constraints applied to the successive phases.

At the top: modeled events of the Oued Medfoun (Canrobert 10) site. The number of associated dates is for each event indicated in brackets; e_HPD (95%), i.e. event’s highest posterior density interval at 95% confidence; e_MAP, event’s posterior mode. At the bottom: modeled phases of the Oued Medfoun (Canrobert 10) site. The number of associated events and dates for each event is indicated in brackets: D_HPD (95%), highest posterior density interval at 95% confidence of phase duration; D_MAP, posterior mode of phase duration; B_HPD (95%), highest posterior density interval at 95% confidence of phase beginning; B_MAP, posterior mode of phase beginning; E_HPD (95%), highest posterior density interval at 95% confidence of phase’s end; E_MAP, posterior mode of phase’s end.

More precisely, we can date:
-
the Upper level between 6220 and 5520 cal BC (posterior maxima [or MAP] of the beginning and the end of the phase at 95%),
-
the Middle level between 6270 and 6240 cal BC,
-
the Lower level between 6320 and 6290 cal BC.
We can therefore place all the prehistoric occupations of Oued Medfoun (Canrobert 10) in a relatively short time, between about 6300 and 6000 cal BC (95% MAP of the Summit Trench).
Aïoun Berriche (Canrobert Site 12)
Aïoun Berriche (or Canrobert site 12) is one of the shell-mounds excavated by Pond during the Logan Museum’s 1929–1930 missions. This site, one of the largest in the region, was the subject of three trenches excavated under the direction of Pond (trenches 1 to 3), and a fourth (Trench 4) excavated simultaneously by a University of Minnesota team led by Albert E. Jenks. This site yielded several burials which have been the subject of analyses (Jackes and Lubell Reference Jackes, Lubell and Pond2014a; Jackes et al. Reference Jackes, Lubell and Crann2015; Haverkort and Lubell Reference Haverkort and Lubell1999). The trenches varied in size, from 3 m long for the smallest (Trench 3) to 20 m for the largest (Trench 1 or “Training trench”, where students learned their excavation techniques). Trench width varied from 3 to 4.6 m, depending on the presence or absence of burials. Two students, John P. Gillin and Lauriston Sharp, conducted the excavation in Trench 2 (also referred to as “12A”) with the aim of detecting a cultural sequence. They made five passes of 50 to 60 cm thickness each, in the ~3 m of deposit. All sediments were sieved, albeit relatively crudely—shovel loads thrown on inclined screens with a mesh size of ¼ inch (about 6 mm).
Approximately 12,000 lithic artifacts are curated at the Logan Museum, making this deposit one of the largest series available. Retouched tools are abundant. Two main groups of lithic industry can be identified without great difficulty, with only minor intrusions. In the lower deposits, Levels 3, 4 and 5, backed bladelets and backed points are numerous while the upper deposits, Levels 1 and 2, see the sudden appearance of regular blades and bladelets obtained by pressure knapping and trapezes. These are characteristic elements of the Upper Capsian. The presence of Aïoun Berriche points and pieces with an oblique truncation and an ogival retouched base are a regional characteristic: they can be found in other deposits of this region, such as at Oued Medfoun and Canrobert site 51.
The assemblage from the lower part of the deposit (Levels 3, 4, 5) has very strong affinities with the Typical Capsian, especially in the microlithic component. However, the absence of large tools such as burins, end-scrapers on flakes or large backed blades that are very characteristic of this group lead to uncertainty. These larger artifacts may have been present but excluded during the sorting done in the field, or they may have been left in Algiers when the collections were split. If, in fact, these larger elements were not present, we must consider the existence of a regional facies of the Typical Capsian.
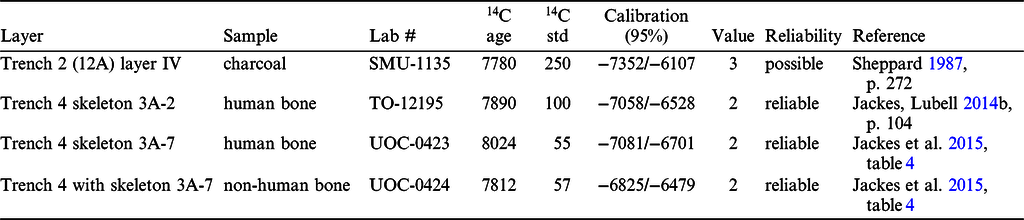
There are four reliable or possible radiocarbon dates for this site done outside the MeNeMOIA project (Table 9). One was made by Peter Sheppard as part of his doctoral research (Haas Reference Haas1987; Sheppard Reference Sheppard1987) on charcoal from Level 4 (SMU-1135). Another date, from Level 3 (SMU-1132), was contaminated with shellac and therefore cannot be considered reliable (Haas Reference Haas1987; Sheppard Reference Sheppard1987). SMU-1135 is more consistent with the chronocultural context, but its 250-year standard deviation makes it very imprecise, between 7350 and 6100 cal BC. Three other dates, considered to be reliable, have used human and non-human bone from burials excavated in 1930 by the Minnesota team (Jackes and Lubell Reference Jackes, Lubell and Pond2014a; Jackes et al. Reference Jackes, Lubell and Crann2015: Table 4).
Pre-existing reliable radiocarbon dates of the MeNeMOIA program for the Aïoun Berriche deposit (Canrobert 12). UOC-0423 has been prepared with ultra-filtration. Four other measures exist (SMU-1132, TO-12196, UOC-0422 and UOC-0425) but which must be rejected: cf. Jackes et al. Reference Jackes, Lubell and Crann2015 for more details.

We performed two radiocarbon dates on bone for each of the Trench 2 levels (Table 7). They are globally consistent with each other except for Poz-92331 which seems much too recent for Level 5. The discrepancy in the dates for Level 5 should be considered in the context of the disturbance of deposits caused by post-mortem manipulation of skeletons: this manipulation was apparently repeated several times for each adult Capsian burial (Jackes and Lubell Reference Jackes, Lubell and Pond2014a). Further proof of the disturbance comes from the paired dating of two bones, one from Skeleton 3A-7 and a faunal fragment excavated with it (UOC-0423 and UOC-0424). The two dates are significantly different (T-test = 7.16 for χ2 = 3.84 with df = 1 at α = 0.05), demonstrating that at least one of the manipulation events occurred about 200 years after the primary burial of the individual (Jackes et al. Reference Jackes, Lubell and Crann2015). The first conclusion is that all the prehistoric occupations of Aïoun Berriche seem to be distributed during the 7th millennium cal BC.
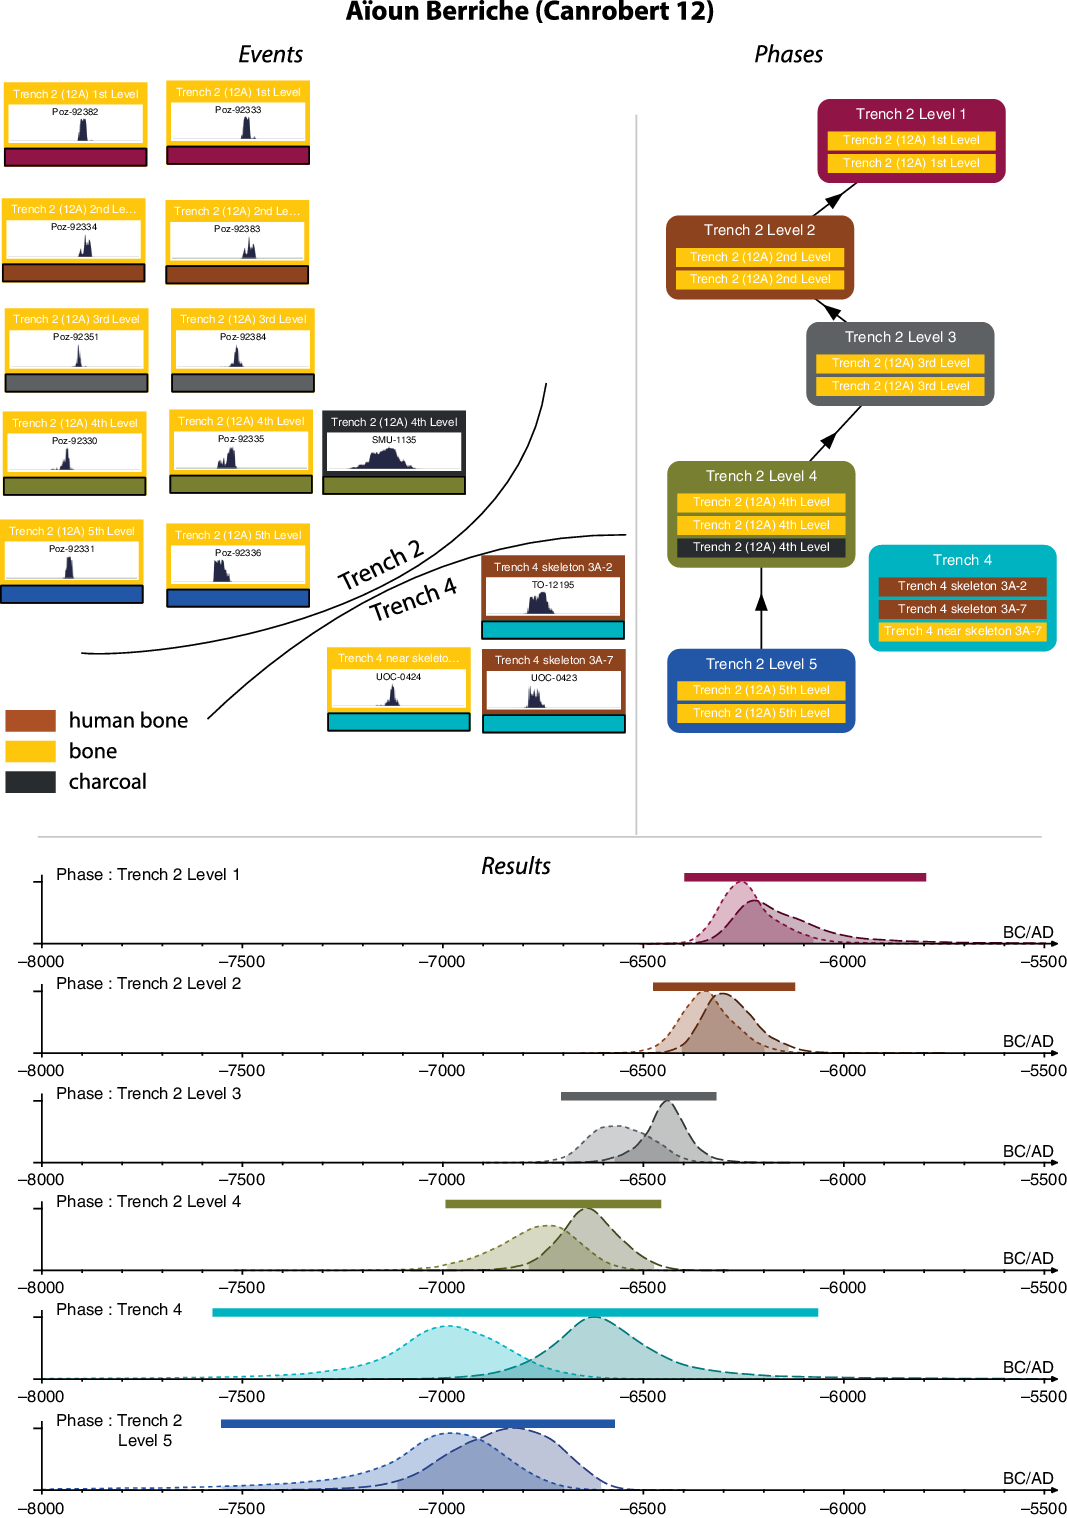
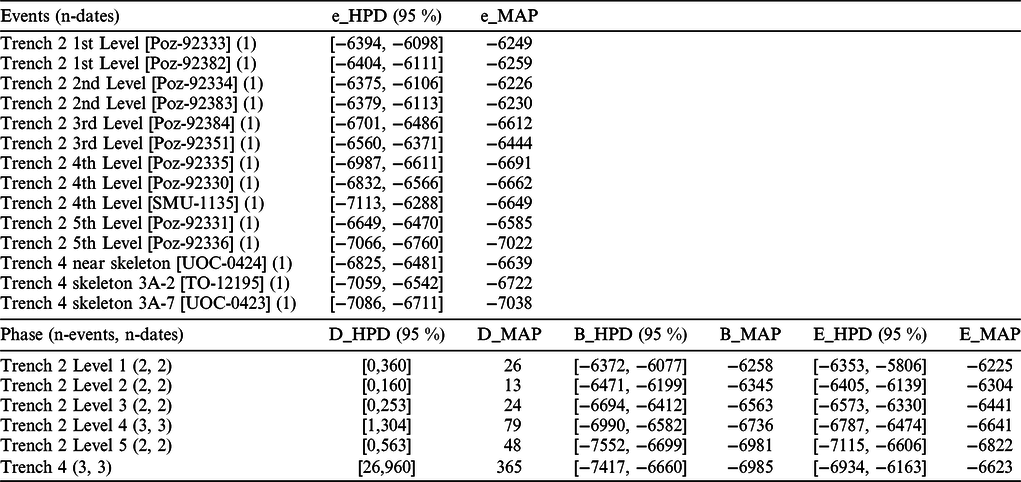
As the dated samples come from different levels of Trench 2, and even though they are relatively thick, it is possible to establish simple stratigraphic constraints between them (Level 5 < Level 4 < Level 3 < Level 2 < Level 1) to build a Bayesian model to refine the chronological estimates (Figure 7 and Table 10). As Trench 2 (12A) and Trench 4 are not directly correlated with each other, it is not possible to establish reliable stratigraphic links between the dates obtained on materials from one or the other.
Bayesian model of the Aïoun Berriche (Canrobert 12) site (events on the left part of the diagram, phases on the right; ChronoModel 2.0.11). At the bottom, posterior density distribution of the model. The areas below the curves represent the 95% highest posterior densities. Arrows indicate the stratigraphic constraints applied to the successive phases.

At the top: modeled events of the Aïoun Berriche (Canrobert 12) site. The number of associated dates is for each event indicated in brackets; e_HPD (95%), i.e. event’s highest posterior density interval at 95% confidence; e_MAP, event’s posterior mode. At the bottom: modeled phases of the Aïoun Berriche (Canrobert 12) site. The number of associated events and dates for each event is indicated in brackets: D_HPD (95%), highest posterior density interval at 95% confidence of phase duration; D_MAP, posterior mode of phase duration; B_HPD (95%), highest posterior density interval at 95% confidence of phase beginning; B_MAP, posterior mode of phase beginning; E_HPD (95%), highest posterior density interval at 95% confidence of phase’s end; E_MAP, posterior mode of phase’s end.

The results obtained from Levels 5 to 3 date the Typical Capsian sequence between approximately 6980 and 6440 cal BC (95% MAP: Table 10), while the Upper Capsian (levels 2 and 1) succeeds it directly, between 6345 and 6225 cal BC (95% MAP: Table 10). Pressure knapping and trapezes appear in Level 2, in synchrony with the well dated transition levels at Kef Zoura D (Jackes and Lubell Reference Jackes, Lubell and Lubell2016) and Aïn Misteheyia (Lubell et al. Reference Lubell, Feathers and Schwenninger2009; Hill et al. Reference Hill, Lubell and Laughlin2019) and more widely with the diffusion episode of these features called “Mediterranean flash” (Perrin et al. Reference Perrin, Marchand, Allard, Binder, Collina, García Puchol and Valdeyron2009).
Canrobert Site 14
In 1929, Pond excavated four trenches of 45 cm to about 1 m deep at Canrobert site 14, but without any internal subdivisions. Collections at the Logan Museum indicate that several different occupations succeeded one another. This is particularly clear when comparing the surface collections where pressure-knapped cores are present with the trench level containing small ogival micro-laminar cores. These are associated with larger pieces such as scrapers or burins, but the large retouched blades, which are normally found in abundance in Typical Capsian deposits, remain absent. As it stands, it remains unclear whether this assemblage represents a Typical Capsian which might have been subjected to some sorting or regional facies of this industry or if it is rather a regional or chronological facies of an older (and still unknown in this part of Algeria) Iberomaurusian-like industry. There may be evidence for this in the Wadi Mezeraa (Télidjène Basin), where two hearths exposed in section yielded charcoal dates of 11,588 ± 99 BP (SMU-655) and 11,870 ± 286 BP (SMU-738; Lubell et al. Reference Lubell, Feathers and Schwenninger2009: 187, fn 9).
Pond points out the strong similarities of the material from Canrobert site 14 to the industries of Mechta el Arbi (Pond et al. Reference Pond, Chapuis, Romer and Baker1938: 121) which he had excavated in collaboration with Arthur Debruge (see below).
In this quite unreliable context, a single date was done on bone, giving a result that could refer to the old phases of the Upper Capsian or the final phases of the Typical Capsian (Poz-92339: 7680 ± 60 BP that is 6630–6440 cal BC). In the present state of knowledge on this deposit, it is not possible to come to any definitive conclusion, and this measure must therefore, for prudence, be put in reserve for the moment.
Canrobert Site 51
Canrobert site 51 was excavated in 1930 during Pond’s second campaign in the Oum el Bouaghi area by three students: Robert Voight, Charles Nash and Edgar Roberts. It is a large rammadiya: 95 m in diameter and about 2.10 m deep. The test pit was situated on the southeast flank of the mound and was 11.7 m long for a total excavated volumeFootnote 6 of 45 m3. Although collected in different artificial levels, the material does not show striking difference from top to bottom of the deposit, according to Pond himself. In 1962, Luigi Ramendo was able to re-examine 7500 pieces from this assemblage (including 6000 flakes and unretouched blanks) kept at that time in the National Bardo Museum in Algiers (Ramendo Reference Ramendo1962).
The Logan Museum also retains some tools from this deposit, identified to two main levels. Pressure knapping is well represented, the blades serving as blanks for trapezes whose truncations are frequently concave, especially in the upper level (“Level 1”). Aïoun Berriche points and many sharp backed bladelets are the microliths, which are also represented by triangles.
Two dates on bone were performed, one for each level. The upper level (“Level 1”) is dated between 6030 and 5840 cal BC (Poz-92337: 7070 ± 50 BP) while the lower level is dated between 6200 and 5905 cal BC (Poz-92338: 7150 ± 50 BP). These results are consistent with their stratigraphic order and place the occupations of Canrobert site 51 in the Upper Capsian.
Mechta el Arbi
The site of Mechta el Arbi was discovered in 1907 in the Mila region of Algeria by the owner of the land, Gustave Mercier, and excavated by A. Debruge in 1912 and 1913. Very little data is available about these first campaigns, conducted hastily by a researcher who also boasted of “tumbling” the shell-middens (Debruge Reference Debruge1922). Significant new excavations were conducted from October 1926 to February 1927 by the Logan Museum team, led by Pond in collaboration with Debruge and using Pond’s excavation methods (Pond et al. Reference Pond, Romer and Cole1928). The diggings were worked in levels but information about the exact provenience of the material has been lost for a large portion of the collection. In 1952, a trench was opened again to show the attendees of the second Pan African Congress how a rammadiya was formed. These last “excavations” were done without real scientific control and the results were never published, despite the discovery of some exceptional pieces, such as a “dagger” carved from a human fibula (Camps Reference Camps1974: fig. 36). Paradoxically, this deposit that gave its name to “the man of Mechta el Arbi” remains completely unknown from the point of view of its cultural remains that were attributed to the “Capsian” without further precision (Camps Reference Camps1974: 132).
Pieces collected during Pond’s excavations are housed at the Logan Museum and some of these bear a level indication. The industry is quite distinct from the others discussed above because of the use of an opaque black flint (see discussion of the use of black flint by Capsian groups in Rahmani Reference Rahmani2004b: 90). The debitage also mainly reflects the production of flakes and irregular blades and the pressure-knapping technique is absent. The presence of a significant number of backed bladelets (more than 200 at the Logan Museum), some large retouched flakes and backed knives and end-scrapers on wide blades suggest some affinities of this industry with the Typical Capsian. Some authors, however, attribute at least a part of this site to the Upper Capsian (Balout Reference Balout1955).
Three bone collagen measurements were made from remains housed at the Logan Museum (Table 7). One of them gave a very recent date, too young to be attributed to the Typical or Upper Capsian (Poz-92230: 3500 ± 120 BP i.e. 2140–1530 cal BC)Footnote 7. The other two measurements fall in the second half of the sixth millennium cal BC:
-
Poz-92231: 6600 ± 80 BP i.e. 5670–5380 cal BC,
-
Poz-92232: 6250 ± 130 BP i.e. 5480–4860 cal BC, was made on bone labeled “level 3”. This last measurement must be considered with caution as the collagen content was very low.
While these last two measures may be consistent with an Upper Capsian attribution, they are too recent compared to the accepted dating for the Typical Capsian. The dates seem thus to be discordant with the lithic material in the Logan Museum and reinforce the hypothesis of an attribution of the upper layers to the Upper Capsian, which remains to be verified by a more thorough study of the material.
Khanguet El-Mouhaâd (Aïn-el-Mouhaâd)
This site is one of the most important of recent prehistory in Algeria, if only because of its size. Located in the Tebessa region, a short distance from the Tunisian border, it is very easily identifiable even today in satellite views: its surface is estimated at 3000 m2 for a volume of archeological deposits between 6 and 7000 m³. The total thickness of the deposits is about 5 m, mainly attributed to the Upper Capsian (Morel Reference Morel1972; Roubet and Hachi Reference Roubet and Hachi2005). This site was discovered and reported by Maurice Latapie in 1909, then excavated by Debruge beginning in 1910, with two test pits to the east and west of the site and rushed excavations in 1921. A new campaign in 1928 engaged Debruge with a team from the Logan Museum including Pond as well as Logan Museum Curator George Collie and Beloit graduate Paul Nesbitt. Three trenches were excavated, arranged in the shape of a cross of Lorraine 68 m long with an average width of about 5 m. Between November 1938 and July 1939, Morel placed a small test pit in the central part of the site, on a surface of about 4 × 1.5 m and a depth of about 1 m in arbitrary passes of 10 to 20 cm thickness (Rahmani Reference Rahmani2003). Finally, Balout also worked at the site in 1949. During most of these campaigns or perhaps all, burials were discovered, in particular in the central part of the shell-mound in Pond’s trenches.
Opinions differ as to the nature of the industries discovered. According to Debruge (Reference Debruge1910), the lower levels are related to the Aterian, but this was later refuted by Jean Morel (Reference Morel1953), who recognized four distinct “layers” of the sequence (layers 1 and 2 from 0 to 40 cm deep, layers 3 and 4 from 40 to 80 cm) which he identified as Upper Capsian.
The Logan Museum houses numerous lithic and bone remains from Khanguet El-Mouhaâd. The lithic industry is particularly well represented, made on a brown to blond flint, sometimes slightly translucent and of very good quality. The assemblage comprises many very regular blades obtained by pressure-knapping. These blade blanks were shaped into very sharp triangles, evoking the recent phases of the Upper Capsian. Some cores, although also pressure-knapped, testify to less regular debitage. They were used to produce smaller irregular blades and could potentially relate to the older phases of the Upper Capsian.
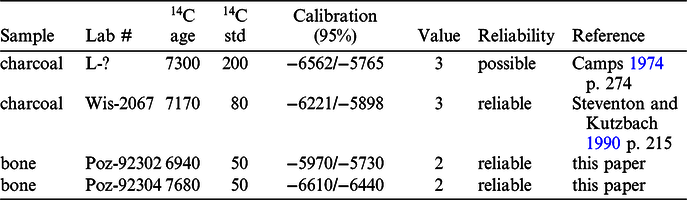
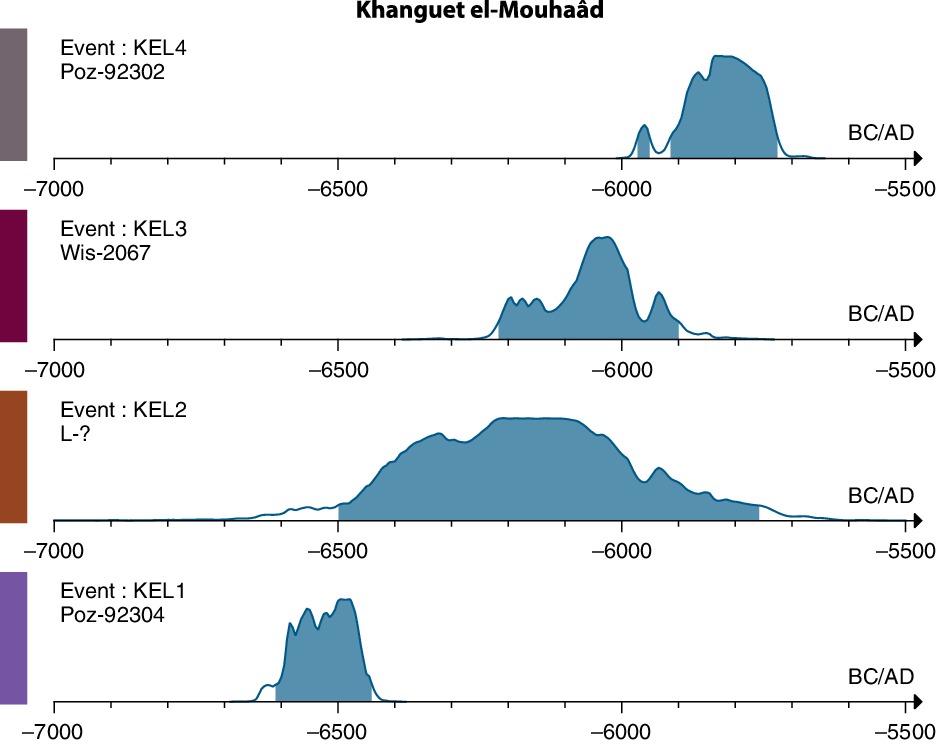
Unfortunately, the Logan Museum collections lack any mention of the levels from which they come, Pond and his colleagues having probably excavated their trenches in a single pass. However, it seemed appropriate to date two of the bones collected during these excavations (Table 11). The dates obtained are significantly different (T-test = 109.52 for χ2 = 3.84 with df = 1 at α = 0.05, Figure 8): the first (Poz-92304: 7680 ± 50 BP) gives a date between 6610 and 6440 cal BC, the second (Poz-92302: 6940 ± 50 BP) between 5970 and 5730 cal BC. It is obviously tempting to put these two dates in direct relation to the trends identified within the industries, namely the oldest (Poz-92304) in connection with the productions in irregular pressure and the second (Poz-92302) with the productions of large blades. However, in the absence of any reference to one level or another for the dated samples, this assumption, although possible, cannot be objectively demonstrated. Two other dates had previously been made on charcoal from this site. The first, the complete laboratory code of which remains unknown, is very imprecise: L – ? 7300 ± 200 BP i.e. 6560–5765 cal BC (Rahmani Reference Rahmani2003). The second is more useful: Wis-2067 7170 ± 80 BP i.e. 6220–5900 cal BC (Rahmani Reference Rahmani2003). On the basis of these few measures without direct links between them, it is possible that two main phases of occupation took place on this site. The first would be dated only by Poz-92304, around the middle of the seventh millennium. The second would be towards the extreme end of the seventh and the beginning of the sixth millennium cal BC, based on Poz-92304 and Wis-2067. Analyses on this site must, however, continue before further interpretation is possible.
Old and recent dates of the site of Khanguet el-Mouhaâd.

Simple calibration of the dates of the Khanguet el-Mouhaâd site (Chronomodel 2.0.11, IntCal13 curve).

R’fana
The site of R’fana or Rafana, also located in the region of Tebessa, was discovered in 1909 by Latapie, then partly excavated by Debruge in 1910. New excavations in the early sixties were led by Camps (Reference Camps1964): four test pits totaling a volume of 1.6 m³ revealed the presence of several stone circles of 1.5 to 2 m in diameter. According to Camps, the lithic industry is exceptionally poor in microliths for a site attributed to the Upper Capsian but revealed instead the remarkable presence of “180 tiny triangular scrapers”, 2 to 3 cm long.
Archeological material (lithic, bone, ostrich egg shells) acquired from Latapie is housed at the Logan Museum. Most of the material is unfortunately devoid of any excavation context, with rare exceptions. It includes massive tools (backed blades, end-scrapers, burins) characteristic of the Typical Capsian mixed with notched bladelets, “saws” and microliths made on elegant supports debited by pressure technique, typical of the Upper Capsian. These microliths are mainly represented by backed bladelets, segments and elongated scalene triangles, while trapezes are almost absent.
A date on charcoal was made from Camps’ excavations (Reference Camps1968), but it has a very high standard deviation (Gif-306: 7450 ± 300 BP) and the time range covered is thus too wide to be useful: 7050–5750 cal BC.
We undertook three new radiocarbon measurements (Table 7): two on bones from the series preserved at the Logan Museum (Poz-92376: 8470 ± 50 BP i.e. 7595-7240 cal BC and Poz-92377: 8350 ± 50 BP i.e. 7540–7200 cal BC) and one on a tooth (Poz-92378: 8370 ± 50 BP i.e. 7550-7320 cal BC). These results are statistically identical (T-test = 3.3 for χ2 = 6 with df = 1 at α = 0.05), so they can be attributed to an occupation in the second half of the eighth millennium, between 7540 and 7360 cal BC (average date: 8397 ± 29 BP), which is consistent with the material assigned to the Typical Capsian. The characteristic component of the Upper Capsian is obviously not dated by the samples chosen.
Kef Zoura D
Kef Zoura D is one of the major archeological sites for the Holocene prehistory of the Maghreb because it is one of the very rare ones to have been excavated with modern techniques and published in a detailed monograph (Lubell Reference Lubell2016). The deposit has deep well-preserved deposits with a stratigraphic sequence from Typical Capsian to Upper Capsian. Excavation spits under both the shelter and the test pits outside the drip line were grouped into five main units. Units I to III are assigned to the Upper Capsian, unit IV perhaps to a transition, and unit V to the Typical Capsian. A set of 21 radiocarbon dates had already been made, making it possible to locate the occupations of units V and IV between 8600 and 6500 cal BC and those of units III to I between 6500 and 4500 cal BC approximately. We refer the reader to this recent monograph for the presentation and discussion of all these dates.
In 2015, a re-examination of the lithic industries suggested that Unit IV might actually be related in its lower part to the Typical Capsian and in its upper part to the Upper Capsian. It seemed particularly crucial to date the end of occupations yielding industries with Typical Capsian criteria. This was the object of the UOC-2927 date (Table 7). We have also carried out a new study of a part of the lithic industry of the shelter. Because of its richness, we have chosen in this first approach to conduct a study combining typological, technological and functional approaches on the square meter G/20. Three new dates (UOC-2023, UOC-2924 and UOC-2925: Table 7) were run to support these new studies and confirm the chronology of the occupations of the Upper Capsian at Kef Zoura D from the middle of the seventh millennium before our era.
Columnata
Columnata, situated in the region of Tiaret, is one of the rare prehistoric Holocene sites known in the western part of Algeria. Discovered in 1936 (Cadenat Reference Cadenat1948), it was excavated from 1937 to 1939, then between 1954 and 1961 by Pierre Cadenat. Further excavations took place, first under the direction of Claude Brahimi in 1969 and 1971 (Brahimi Reference Brahimi1972).
Most of these excavations were carried out in two main areas at the foot of a spur overlooking the Tiguiguest Valley. Cadenat (Reference Cadenat1966) identified four main levels over a thickness of about 2 m, which would relate from top to bottom, to the “Neolithic of Capsian tradition”, to the Upper Capsian, to a particular and very microlithic facies referred to as “Columnatian” (Cadenat Reference Cadenat1970) and to the Iberomaurusian. However, there is no clear separation between these levels, such as sterile layers, or even color or sediment differences. The passage from one to the other is ill-defined and the characteristic elements of this or that phase are mixed in intermediate facies. The site is particularly known for its many prehistoric burials containing more than a hundred skeletons (Chamla Reference Chamla1970) and many faunal remains (Chaïd Saoudi Reference Chaïd-Saoudi1987).
Beginning in 2016, Yasmina Chaïd-Saoudi has started a new research program at the site. Her first investigations seem to show that the prehistoric levels excavated at the bottom of the spur (Columnata A) were fed with colluvium from the summit of the hill, where another occupation was probably located (Columnata B). Although they cannot be considered as in place or as occupation layers, these levels respect the stratigraphic order but without clear distinctions between them.
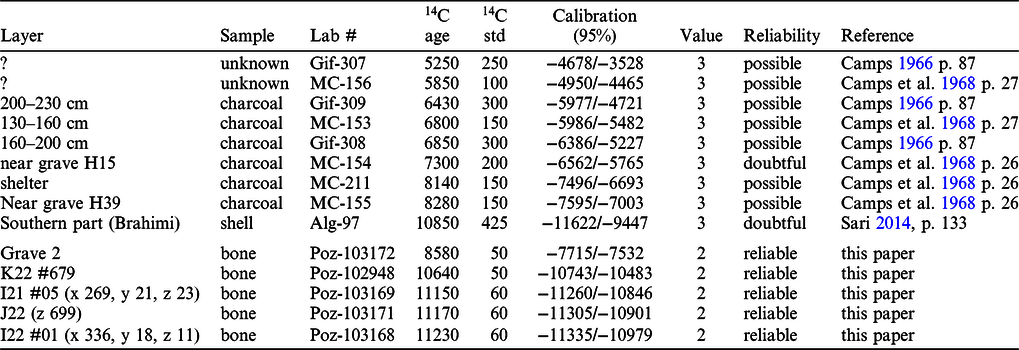
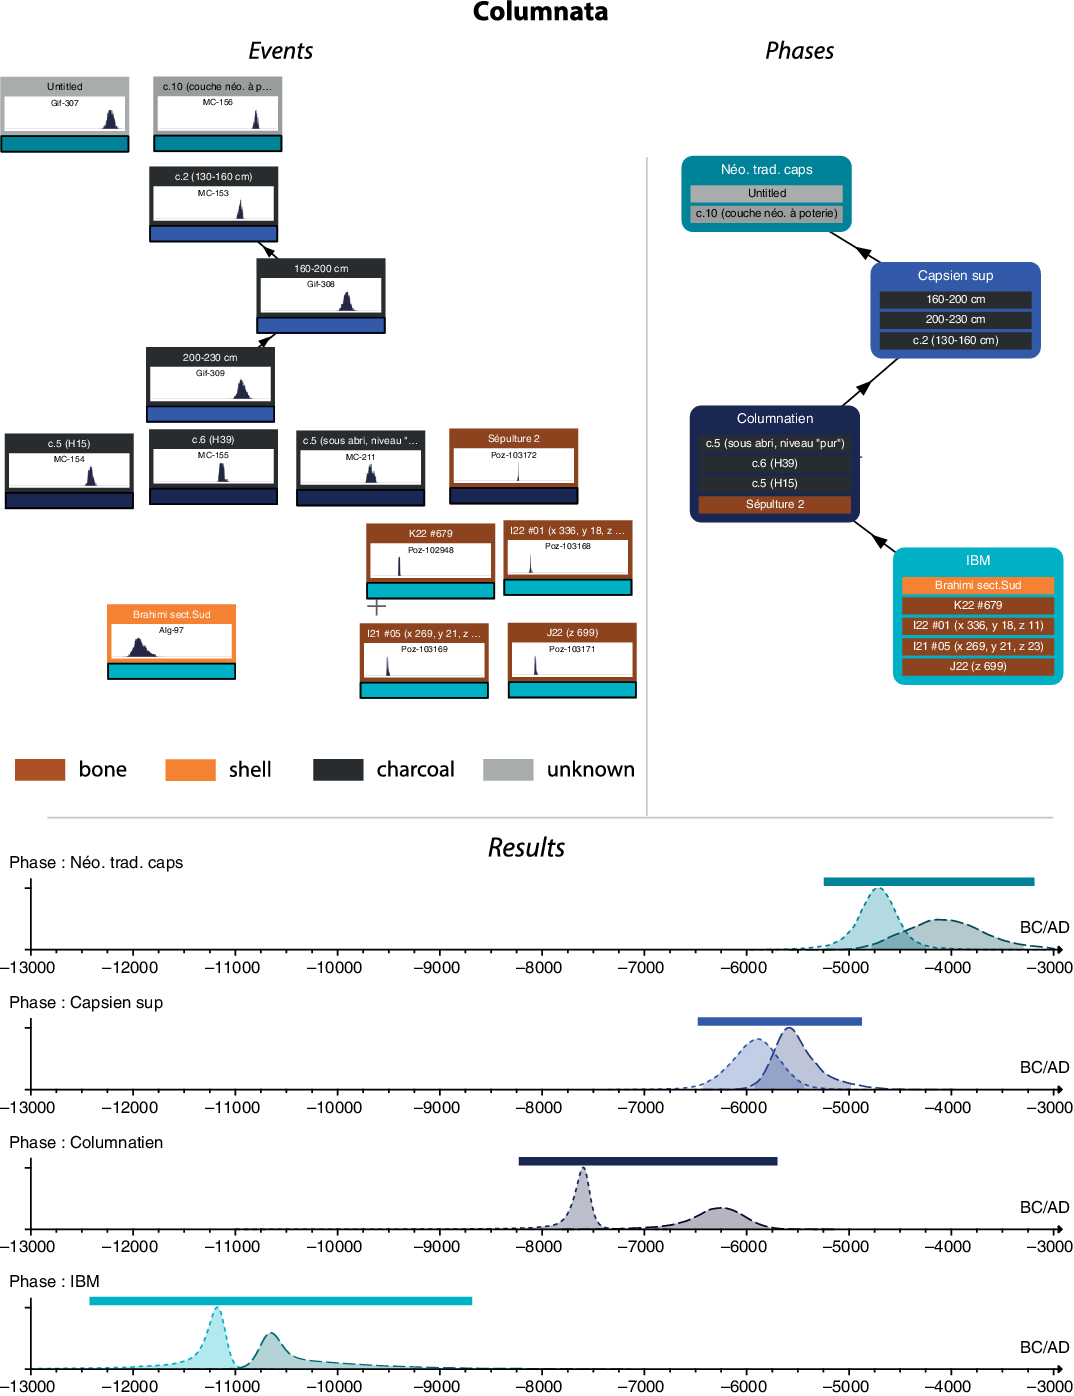
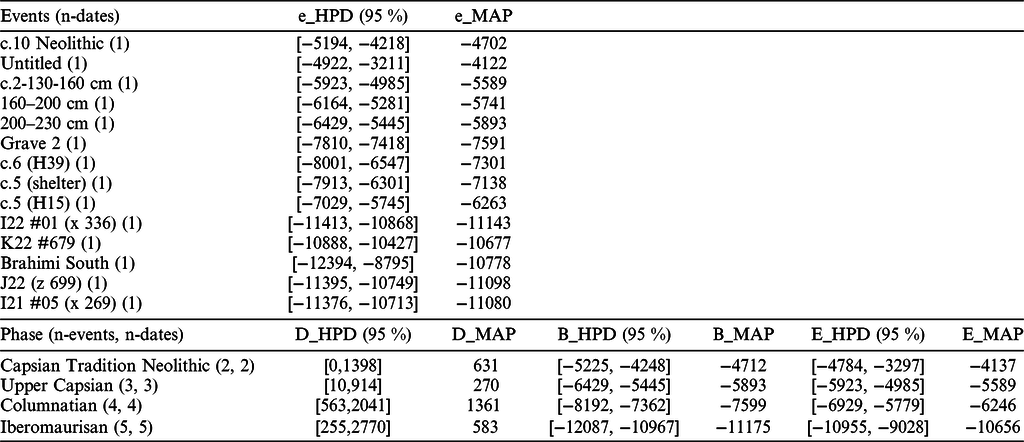
The older excavations were dated by 10 radiocarbon measurements, but all have very high standard deviations (Table 12). While these measures provided early dating for the four main phases of occupation, they are still too broad to be truly relevant today. The Iberomaurusian was thus strangely dated between 8560 and 7500 cal BC, which is far too young for this industry based on dates from other sites such as Taforalt and Tamar Hat (cf. above “The Northern African Contexts”). The Columnatian was dated approximately between about 7500 and 6500 cal BC, the Upper Capsian between 6000 and 5000 cal BC and the “Neolithic of Capsian tradition” between 4800 and 3900 cal BC. The discovery of new faunal fragments during recent excavations allowed the processing of five new radiocarbon measurements for the basal levels (Table 7). The implementation of a Bayesian model, which for now is still very simple due to the absence of precise stratigraphic links, shows that these dates have good coherence even if the chronological intervals modeled remain very wide (Figure 9 and Table 13). All these results obviously require confirmation and, above all, a refinement of the stratigraphic relations existing between the various excavated sectors. For now, it seems that the Iberomaurusian of Columnata dates between 11,180 and 10,650 cal BC and the Columnatian probablyFootnote 8 between 7600 and 6300 cal BC. This latter result is particularly interesting because it could place the Columnatian contemporary with the Typical Capsian of eastern Algeria and Tunisia, and also contemporary with the Columnatian of Saint-Trivier/Chabet el-Houidga.
Old and recent dates of the site of Columnata.

Bayesian model of the Columnata site (events on the left part of the diagram, phases on the right; ChronoModel 2.0.11). At the bottom, posterior density distribution of the model. The areas below the curves represent the 95% highest posterior densities. Arrows indicate the stratigraphic constraints applied to the successive phases.

At the top: modeled events of the Columnata site. The number of associated dates is for each event indicated in brackets; e_HPD (95%), i.e. event’s highest posterior density interval at 95% confidence; e_MAP, event’s posterior mode. At the bottom: modeled phases of the Columnata site. The number of associated events and dates for each event is indicated in brackets: D_HPD (95%), highest posterior density interval at 95% confidence of phase duration; D_MAP, posterior mode of phase duration; B_HPD (95%), highest posterior density interval at 95% confidence of phase beginning; B_MAP, posterior mode of phase beginning; E_HPD (95%), highest posterior density interval at 95% confidence of phase’s end; E_MAP, posterior mode of phase’s end.

Saint-Trivier/Chabet el-Houidga
Saint-Trivier/Chabet el-Houidga was excavated by Georges Simonnet between 1957 and 1960, on the outskirts of the city of Mascara, in western Algeria, a few tens of kilometers from Columnata. The excavation was carried out with great care and rigorous methods for that time, using a metric grid, fine sieving and thin stripping. The archeological material was brought to France at the end of the Algerian War of Independence and long forgotten in a cellar. Robert Simmonet, the son of the excavator, rediscovered this collection a few years ago. The archeological material and the stratigraphy of this site have been the subject of a recent detailed study (Dachy et al. Reference Dachy, Guéret, Campmas, Simonnet, Bon and Perrin2018). To quickly summarize the results of this work, and in particular those concerning the chronology, the analysis of available documents and lithic industries allowed us to propose a sequence of six main layers. Seven radiocarbon measurements were made on bones from these different levels, with no results due to lack of conservation of collagen, except for one sample. Seven other measurements were then performed on bone bioapatite with much more success. A simple Bayesian model was then built which allowed us to date levels 5 to 3—that we propose to assign to the Columnatian— between 8380 and 7490 cal BC.
DISCUSSION
Of the 50 or so new radiocarbon dates obtained during this research program on the recent prehistory of North Africa, all are, of course, not of equal value, since most of them used samples excavated many years ago by methods that are no longer considered appropriate. However, the analysis of several measurements for each site, distributed in the different levels when they can be identified, makes it possible to set up relatively detailed approaches and to construct some simple Bayesian models that allow us to refine the chronology. The combination of technological, typological and traceological studies of lithic industries, which will be published elsewhere, and this dating program allows us to clarify our knowledge of the human groups living in Algeria during the early Holocene.
Among these main results for the chronological aspects of the MeNeMOIA program, we can first confirm the absence of evidence for Iberomaurusian assemblages younger than the 10th millennium cal BC, as shown by the new measurements made at Columnata. The Typical Capsian becomes better dated, with sixteen reliable or possible dates (but coming from only six sites), which place it in the ninth, eighth and first half of the seventh millennium cal BC. This dispersion of the Typical Capsian over three millennia suggests that progress is still to be made to refine its chronology. The Columnatian, until now very badly dated, can be placed between 7600 and 6300 cal BC. Finally, the Upper Capsian also has a better defined chronological range between 6500–6400 and 5400 cal BC. The chronological table that we can thus construct is significantly improved (Figure 10) compared to previous knowledge (Figure 2).
Probability sums (OxCal software v.4.3.2) of all reliable radiocarbon dates for the recent prehistory of North Africa and Castelnovian (all measurements are available on https://bda.huma-num.fr/). The dates made on Helix melanostoma from the Typical Capsian levels from Aïn Misteheyia have be included using the reservoir effect value of 476 ± 48 14C yr (Hill et al. Reference Hill, Reimer, Hunt, Prendergast and Barker2017, Reference Hill, Lubell and Laughlin2019).

This general picture highlights the almost complete absence of reliable data between 10,500 and 9000 cal BC (Figure 10), which could only be related to a lack of research or a taphonomic biasFootnote 9. In the current state of knowledge, it is, however, necessary to note the existence of this gap of nearly two millennia between the final Iberomaurusian and the first occupations of the Typical Capsian, Columnatian or Mediterranean Epipaleolithic. This long hiatus cannot be explained by an overtly rigorous selection of dates considered to be reliable, since if we include the possible dates or even all measurements without sorting, it nonetheless persists (Figure 2). The eighth and seventh millennia see the coexistence, from east to west, of the Typical Capsian, the Columnatian and the Mediterranean Epipaleolithic of Morocco. The Typical Capsian, or in any case a close facies, is now attested on the high Sebkhas plateau north of the Aurès Mountains around Oum el Bouaghi. The Upper Capsian succeeded these groups in chronological continuity with the Typical Capsian. The first Neolithic sites have not been dated within the framework of this program, but it is a logical continuation that should be put in place in a future program.
CONCLUSION
The MeNeMOIA program started with the objective of exploring the African hypothesis for the origin of the technological upheavals leading to the appearance of the Second Mesolithic, covering what J.G.D. Clark called the “blades and trapezes” phenomenon. The results obtained cover a wider perspective on different points. This is particularly the case for many chronological aspects, as we have shown above. On the other hand, the question of the North African origin remains for now unresolved: the dates that we obtained during this program make it possible to place the Upper Capsian between 6500–6400 and 5400 cal BC, that is a chronological range strictly identical (for its beginnings) to that of the Second Mesolithic of South-Western Europe, and notably the Castelnovian (Figure 10; Perrin et al. Reference Perrin, Marchand, Allard, Binder, Collina, García Puchol and Valdeyron2009). We can now demonstrate the co-evolution of lithic industries in North Africa and southern Europe, which reinforces our scenario of a strong link between the two shores of the Mediterranean during these times. However, the precedence of Africa over Europe is not yet demonstrated. This does not mean, however, that this hypothesis is false: the new dates for the Upper Capsian that we have obtained come mainly from deposits located in a micro-region of Algeria, the Wilaya of Oum el Bouaghi. It is, of course, not impossible that older phases of the Upper Capsian exist elsewhere in Algeria or Tunisia. Even with all these new dates, the data quality is still unequal, and our promising results are to be corroborated by ongoing research. It is especially necessary to trace the deposits of these phases of the Upper Capsian where the manufacture of lithic artifacts used “irregular” pressure knapping on small pebbles, and to systematically date by several measures all these levels. Perhaps the hypothesis of a non-African origin also deserves to be revisited. Beyond the new data acquired, this MeNeMOIA program is only the first stage of a larger research program that will continue in the coming years.
ACKNOWLEDGMENTS
This work was supported by the IDEX (Excellence initiative) within the framework of the program “Emergence” of the Federal University of Toulouse (France). It has been undertaken within the MeNeMOIA project (“From the Mesolithic to the Neolithic in the Western Mediterranean Basin: the African impact”, https://menemoia.hypotheses.org) led by Thomas Perrin (CNRS) in 2016 and 2017. Thanks to Nicolette Meister for access to and assistance with Logan Museum collections and to Mary Jackes for her extensive comments and corrections, which have greatly improved this paper.