Introduction
Aonla (Emblica officinalis Gaertner) is one of the most important indigenous fruit trees which belongs to the family Euphorbiaceae (Singh et al., Reference Singh, Pandey, Gangadhara, Yadav, Rane, Krishna and Ravat2024). The aonla fruit has high nutraceutical and medicinal value, thus known as ‘amrit phal’. It is renowned for its ability to aid digestion, astringent, cooling anodyne, diabetes, scurvy, skin diseases and assist in greyness of hair (Chandra et al., Reference Chandra, Rawat, Singh, Khanduri and Riyal2020). Major growing states of aonla in India are Uttar Pradesh, Karnataka, Bihar, Haryana, Gujarat, Rajasthan, Madhya Pradesh (M.P.) and West Bengal. Uttar Pradesh is the leading producer, with approximately 36.70 thousand hectares under cultivation, yielding about 402.63 thousand tonnes (Kumar et al., Reference Kumar, Singh, Rahul, Singh and Singh2023). Fruit is a good source of ascorbic acid, phenolic compounds, along with a moderate supply of carotene, thiamine, carbohydrates and essential minerals such as calcium, iron, phosphorus and magnesium (Almatroodi et al., Reference Almatroodi, Alsahli, Almatroudi, Dev, Rafat, Verma and Rahmani2020). These compounds contribute to its antioxidant, antimicrobial, anti-inflammatory, antipyretic, hepatoprotective, antitumor and antidiarrheal properties (Singh et al., Reference Singh, Kumar and Sharma2021). Earlier studies showed that in India, aonla germplasm has a wide spatial and temporal diversity (Singh et al., Reference Singh, Singh, Saroj, Mishra, Singh and Singh2019, Reference Singh, Pandey, Gangadhara, Yadav, Rane, Krishna and Ravat2024). Throughout the country, particularly in the central parts of Uttar Pradesh, there is a wide range of genotypes with recorded quality traits.
Aonla trees are known for their exceptional resilience, thriving even under challenging conditions such as drought, nutrient-poor soils and varying pH levels. These hardy trees can withstand acidic to saline soil with pH levels ranging from 6.5 to 9.5, tolerate an exchangeable sodium percentage of up to 35, and endure electrical conductivity (EC) levels as high as 6–9 dS/m (Maurya et al., Reference Maurya, Pratap, Sonkar, Tiwari, Yadav, Pratap and Kumar2024; Singh et al., Reference Singh, Pandey, Gangadhara, Yadav, Rane, Krishna and Ravat2024). Environmental factors like temperature, rainfall, soil composition and light availability play a pivotal role in shaping the physiological traits of aonla across its diverse germplasm. The gene pool of aonla exhibits remarkable variation in both qualitative and quantitative traits, influenced by the distinct climates and soil types where it grows. However, there remains a gap in scientific research regarding the unique traits of aonla germplasm, particularly its adaptability to alkaline soils. Understanding the morphological and biochemical traits of fruit is crucial for distinguishing the distinctive qualities of various germplasm types (Singh et al., Reference Singh, Kumar and Sharma2022).
This work is unique in that it focuses on E. officinalis genotypes and their tolerance to saline-alkaline soils, a difficult agricultural niche that has received little attention in previous research. Unlike previous studies, which have primarily focused on general agronomic performance or biochemical traits of aonla under standard or favourable conditions, this study addresses the critical need to identify genotypes suitable for alkaline soil conditions. This study bridges the gap between genetic potential and environmental limits by combining fruit production, biochemical quality (particularly ascorbic acid and phenol content) and soil adaptation, providing actionable insights for sustainable agriculture. The goal was to find high-yielding aonla accessions with outstanding fruit quality features (higher content of ascorbic acid and phenol) suitable for alkaline conditions and to evaluate their biochemical attributes, aiding in the breeding of resilient varieties adaptable to diverse climates.
Materials and methods
Experimental farm and genotype selected
The aonla genotypes were planted at the farm of ICAR-CISH Lucknow, Uttar Pradesh during 2005. The site is located at 26°45′ N latitude and 80°30′ E longitude, at an elevation of 123 m above sea level. Field experiments were carried out in open-experimental fields for 2 consecutive years (2021–2022 and 2022–2023), utilizing a randomized block design with three replications, with the goal of identifying and characterizing aonla accessions for alkalinity tolerance, high yield and better fruit quality based on 2 years of data. Each genotype was represented by three plants and total number of plants was maintained at 33. Data on the morphological, quality and yield parameters were recorded in both the years of study and statistical analysis was done on the basis of 2 year mean data.
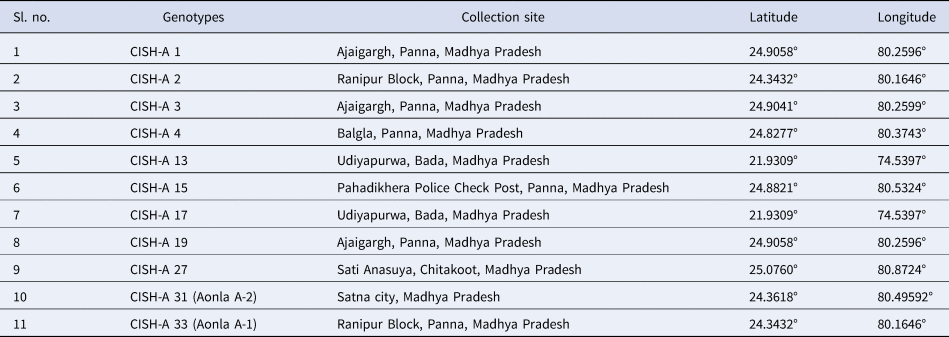
Eleven accessions i.e. CISH-A 1, CISH-A 2, CISH-A 3, CISH-A 4, CISH-A 13, CISH-A 15, CISH-A 17, CISH-A 19, CISH-A 27, CISH-A 31 (CISH-Aonla-2) and CISH-A 33 (CISH-Aonla-1) were taken for characterization and evaluation. These accessions were collected from different districts of the M.P., India. The genotypes and their respective area of origins are presented in Table 1. Grafted aonla trees of the above accessions were planted at a spacing of 8 m × 8 m and plants are maintains under cultural practices. Furthermore, observations on morphological, yield and biochemical attributes of aonla were recorded during winter season in the month of November (2nd fortnight). Standardized cultural practices were employed for all aonla trees throughout the experiment.
List of aonla genotypes and their corresponding source

The soil samples were collected from a depth of 25–35 cm in the experimental field before pit preparation. The soil's chemical properties were then measured according to AOAC guidelines (Reference AOAC2006). The experimental field soil had a pH of 7.73 ± 0.12, an EC of 0.16 ± 0.02 dS/m, organic carbon content of 0.72 ± 0.03%, available nitrogen (N) 271.60 ± 3.92 kg/ha, available phosphorus (P) 4.69 ± 1.10 kg/ha and available potassium (K) 189.55 ± 2.95 kg/ha, respectively. Besides, the soil was dominated by kankars (hand soil masses) of calcium carbonate and bicarbonate (Deshmukh, Reference Deshmukh2012).
Distinctness uniformity stability descriptors were used to record their consistent expression and stability throughout the duration of the study. Detailed descriptors for 19 attributes of aonla cultivar genotypes were examined, encompassing various aspects, i.e. growth habit, foliage, leaf size, leaf shape, leaf apex, leaf surface, trunk colour, branchlet colour, inflorescence colour, fruit surface, fruit shape and colour, fruit stalk, stem end, fruit-bearing tendency, stone size and shape, seed colour and harvest maturity (online Supplementary Table S1).
Chemicals and reagents
Sodium nitrite, sodium hydroxide and gallic acid were procured from Merck (India). Meta-phosphoric acid, 2,6-dichlorophenol, indophenol, Fehling's solutions ‘A’ and ‘B’, glucose, methylene blue indicator, potassium persulphate, Folin–Ciocalteu (FC) reagent, aluminium chloride, sodium bicarbonate, sodium chloride, boric acid, rutin trihydrate and sodium carbonate were purchased from Himedia (India). Water from a water purification instrument (Merck Millipore Academic, USA) was used for various analyses. All other chemicals are of analytical grade and were purchased from Rankem, Loba Chemie and Qualigens Fisher Scientific.
Yield and biochemical attributes of aonla
The collection of 12 fruits (three fruits from each direction, viz. east, west, north and south) from each replicated tree of genotypes was randomly harvested for assessing the average fruit weight. The fruit yield was recorded by harvesting the total fruits per tree and weighed. Additionally, 12 fresh fruit samples from each replicated tree of the genotypes were stored at 4°C for subsequent biochemical analysis. Each quantitative test was run three times.
Determination of total soluble solids and titratable acidity
Total soluble solids (TSS) content of aonla fruit pulp was measured by using a hand refractometer with a range of 0–32°B (Brix) (Bulo et al., Reference Bulo, Nimbolkar, Singh, Sahu, Wangchu, Das and Pandey2024).
Titratable acidity was determined by using Chandra et al.'s (Reference Chandra, Rawat, Singh, Khanduri and Riyal2020) method with 0.1 N NaOH solution using phenolphthalein as an indicator. The percentage titratable acidity was computed and reported as per cent citric acid equivalent using the following formula:

Determination of ascorbic acid
To quantify vitamin ‘C’ (ascorbic acid), 5 g of sample fruit pulp was extracted into a 50 ml volumetric flask and diluted with 3% HPO3 (metaphosphoric acid) solution (Yadav et al., Reference Yadav, Koley, Tripathi and Singh2019). A 5 ml sample was then titrated against a dye solution containing 2,6-dichlorophenol and indophenol. Pink colour appeared for at least 15 s, indicating the termination point (Poojan et al., Reference Poojan, Dwivedi, Pandey, Singh, Siddiqui, Pandey and Rajan2024). The ascorbic acid content was expressed in mg/100 g pulp of sample after calculation using the following formula:

Estimation of total sugars, reducing sugar and non-reducing sugar
The total sugar was determined using the phenol sulphuric acid method, with some modifications (Prajapati et al., Reference Prajapati, Nema and Rathore2011). Five grams of fruit pulp were extracted into a 100 ml volumetric flask and diluted with distilled water to keep the volume constant. A 0.8 ml of sample was taken, then added 0.2 ml of distilled water, 0.5 ml of phenol solution (10%) and 5 ml of concentrated sulphuric acid. The sample tube was placed in a water bath (30–35°C) for 20 min. Following that, the sample was measured using a spectrophotometer at 485 nm. The results were expressed as a percentage of glucose equivalents by using the following formula:

To determine the reducing sugars, 5 g of fruit pulp was extracted into a 100 ml volumetric flask and the volume was kept at 100 ml with distilled water. Five milligrams aliquot were placed in a conical flask, and 5 ml of Fehling's solutions ‘A’ and ‘B’ (Prajapati et al., Reference Prajapati, Nema and Rathore2011; Poojan et al., Reference Poojan, Dwivedi, Pandey, Singh, Siddiqui, Pandey and Rajan2024) were added and titrated against a 1.0% glucose (dextrose) solution in boiling water using methylene blue as an indicator. The appearance of light brick colour was designated as the endpoint. A blank sample was also titrated against 1% glucose (dextrose). The computation was performed using the following formula, and the results were expressed as a percentage of reducing sugars:


Estimation of total phenol content
The total phenol content was estimated by using FC's reagent technique with some modification (Saini et al., Reference Saini, Sharma, Kumar, Kumar and Singh2018; Poojan et al., Reference Poojan, Dwivedi, Pandey, Singh, Siddiqui, Pandey and Rajan2024). One gram fresh sample was used for estimation, and it was crushed in 10 ml of ethanol (80%) and 1 ml of HCl. Following that, the sample was centrifuged for 20 min at 10,000 rpm at 4°C and the supernatant was collected. Subsequently, 0.5 ml of 2 N Folin reagents was added to 2.9 ml of distilled water and 0.1 ml of sample (supernatant). A total of 2 ml of Na2CO3 solution were added to the sample solution after 3 min. After a while, the solution was allowed to turn blue-black in colour and was measured in a spectrophotometer at 760 nm wavelength. The results were expressed in mg of gallic acid equivalent (GAE)/g pulp.
Estimation of ferric reducing antioxidant power
The ferric reducing antioxidant power (FRAP) assay was performed following the method outlined by Shukla et al. (Reference Shukla, Kumar, Bhardwaj, Pandita, Patel, Thakur and Saxena2024) and Poojan et al. (Reference Poojan, Dwivedi, Pandey, Singh, Siddiqui, Pandey and Rajan2024), with slight modifications. The FRAP solution was prepared by mixing 300 mM acetate buffer (pH 3.6), 20 mM TPTZ solution (in 40 mM HCl) and 20 mM FeCl3 (in water) in a 10:1:1 ratio. This solution was then reacted with the samples or standard (10.000 mg/ml) at a 1:30 ratio and incubated in the dark for 30 min at 37°C. The resulting blue complex (ferrous tripyridyltriazine) was measured at 593 nm wave length using a spectrophotometer, and the results were expressed as mg/g of ferrous sulphate.
Statistical analysis
All analytical tests were conducted three times, and the findings were calculated as mean ± SD. Data from both of the studies of successive years were combined. One-way analysis of variance and post-hoc analysis using Duncan's multiple range tests (P ≤ 0.05) were used in SPSS 16.0 (SPSS Corporation, Chicago, IL) to assess the significance of the data, particularly the results of various morphological and biochemical parameters of aonla sample collected from experimental fields. The association between related components was ascertained using correlation analysis at the significance level (P ≤ 0.05). Principal component analysis (PCA) and dendrogram were used to determine the overall morpho-biochemical variability among the genotypes by using SRPLOT software.
Results
Morphological attributes of aonla genotypes
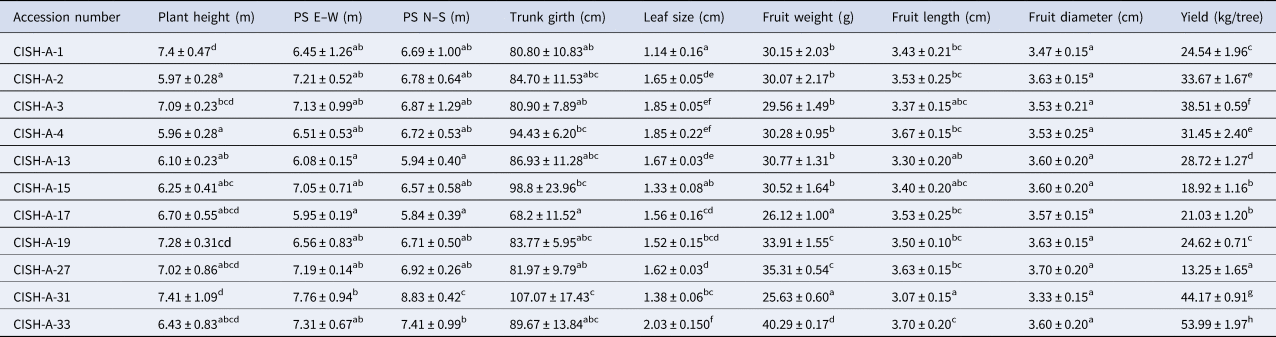
The observations on morphological features are presented in Table 2. The data revealed significant differences across all variables (P ≤ 0.05). The plant height, plant spread (E–W and N–S), trunk girth and leaf size among the studied genotypes ranged from 5.96 ± 0.28 to 7.41 ± 1.09 m, 6.08 ± 0.15 to 7.76 ± 0.94 m, 5.94 ± 0.40 to 8.83 ± 0.42 m, 68.2 ± 11.52 to 107.07 ± 17.43 cm and 1.14 ± 0.16 to 2.03 ± 0.15 cm, respectively. The maximum values for plant height (7.41 ± 1.09 m), plant spread (E–W: 7.76 ± 0.94 m, N–S: 8.83 ± 0.42 m) and trunk girth (107.07 ± 17.43 cm) were observed in the CISH-A-31 genotype, while the largest leaf size (2.03 ± 0.15 cm) was found in CISH-A-33.
Fruit morphology traits of 11 aonla accession in sub-tropical region of India

PS E–W: plant spread east-west direction; PS N–S: plant spread north-south direction.
Values presented as means ± SD. Values in columns with different lowercase letters (small alphabets) indicate significantly different; P < 0.05, Duncan's multiple range test between genotypes.
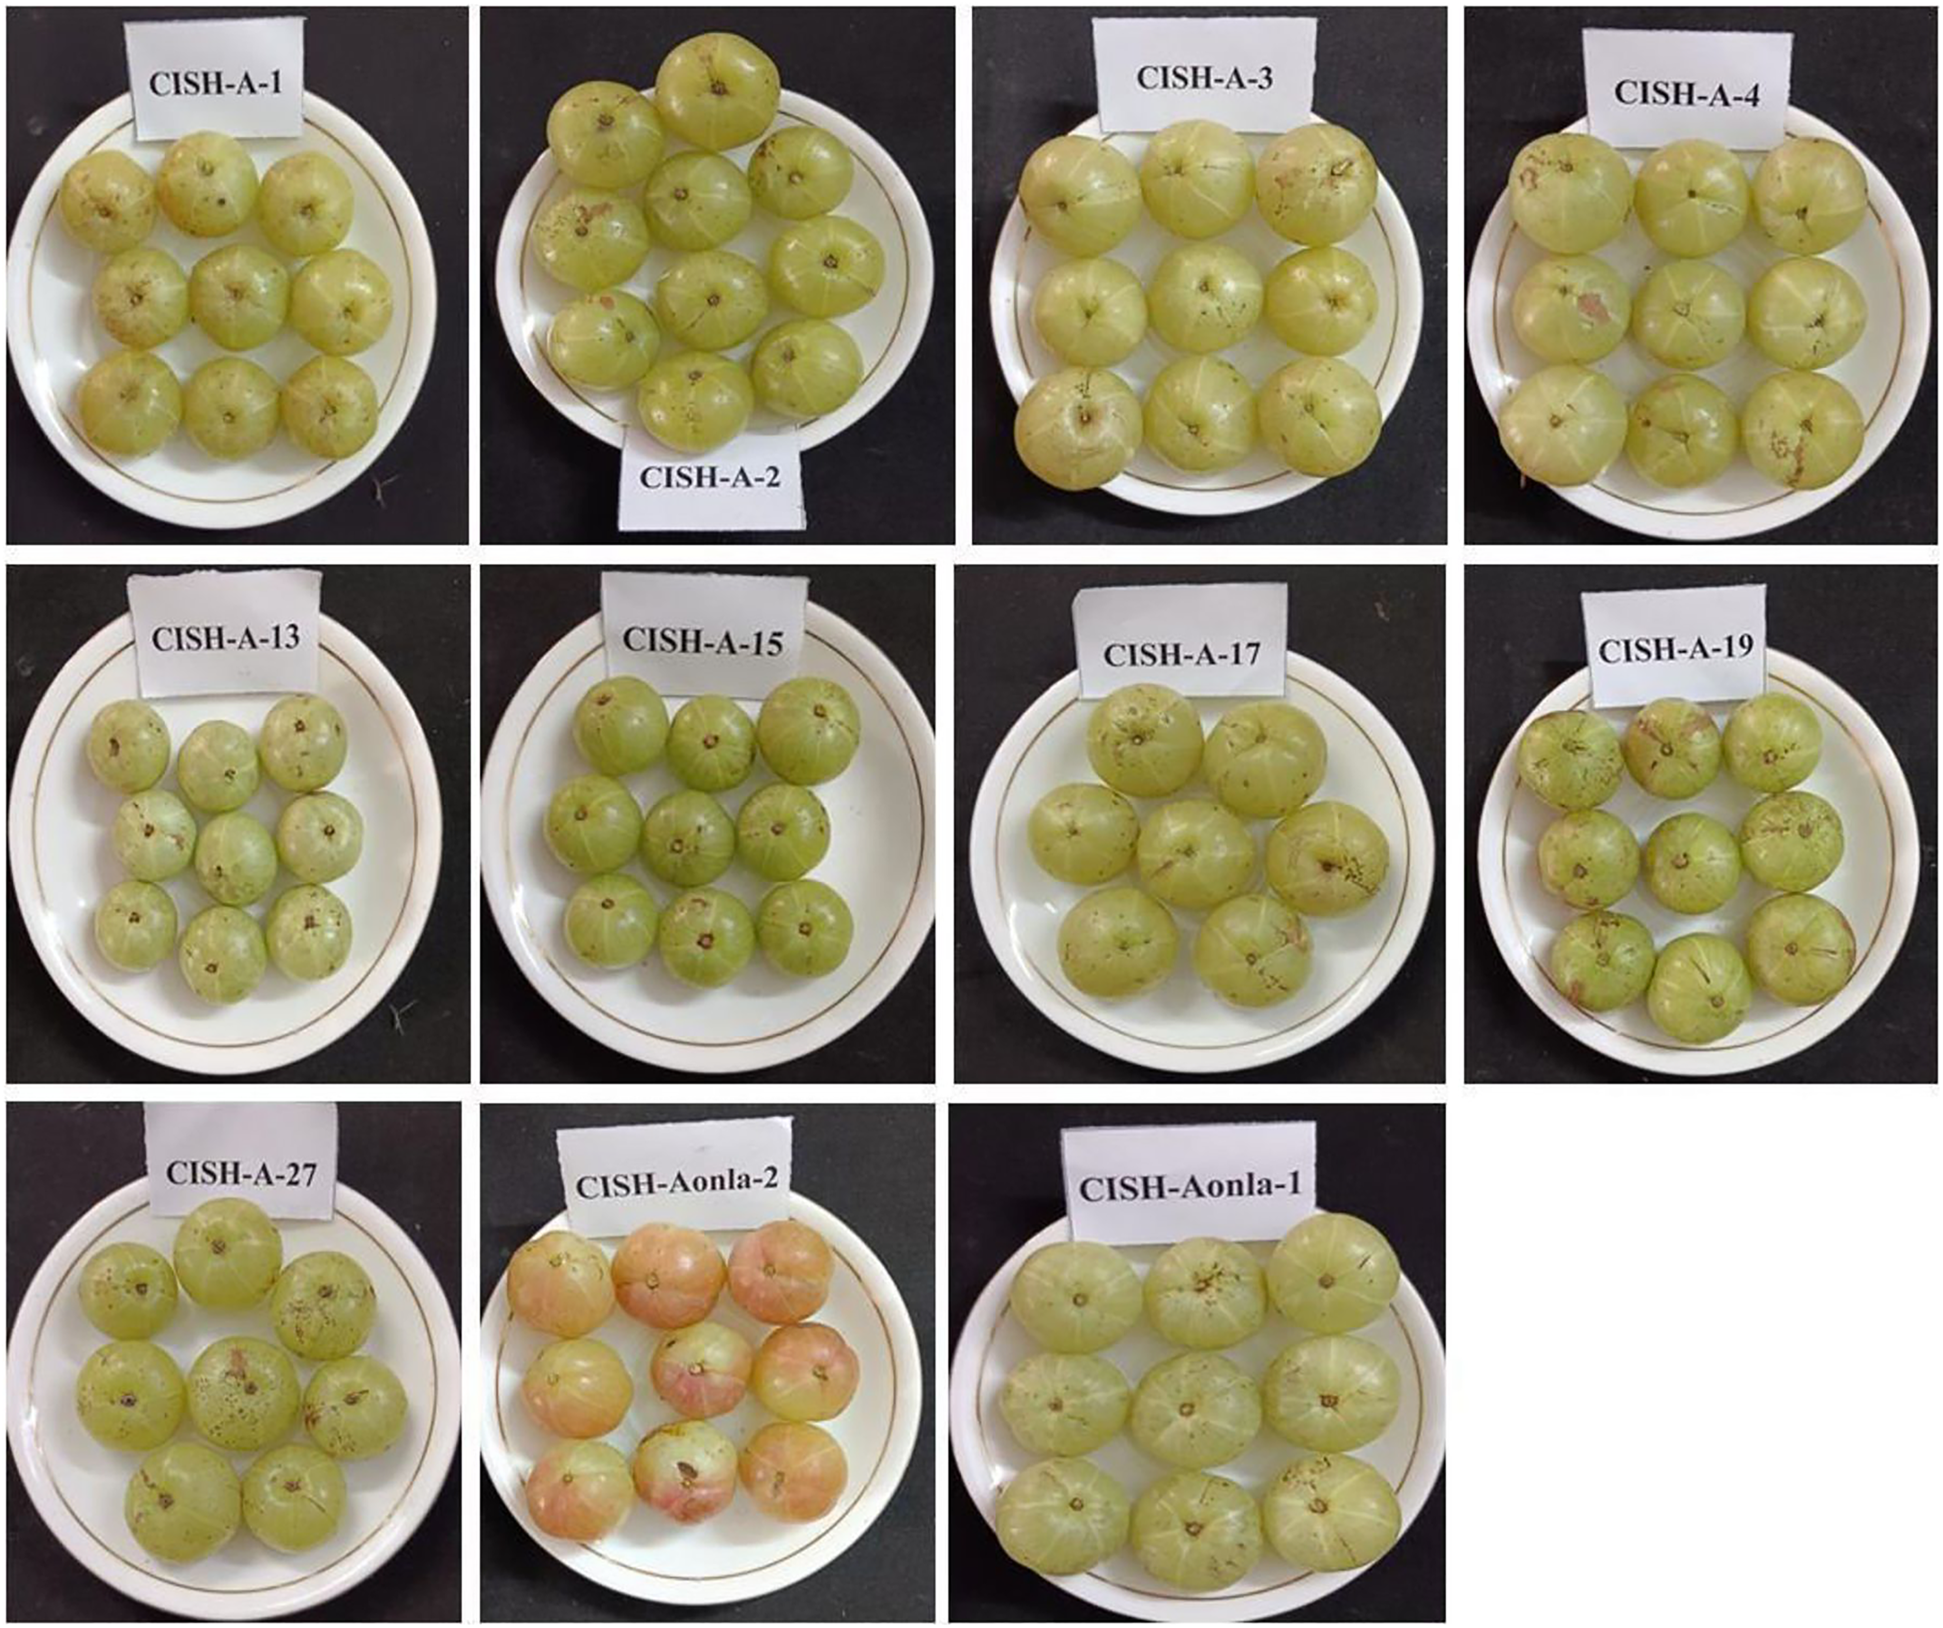
The evaluated genotypes showed significant variation (P ≤ 0.05) across different fruit attributes, including fruit weight, fruit length and yield, except for fruit diameter (Table 2, Fig. 1). Fruit weight ranged from 25.63 ± 0.60 to 40.29 ± 0.17 g, and fruit length ranged from 3.07 ± 0.15 to 3.70 ± 0.20 cm. The highest fruit weight (40.29 ± 0.17 g) and fruit length (3.70 ± 0.20 cm) were observed in CISH-A-33, while the lowest values (25.63 ± 0.60 g and 3.07 ± 0.15 cm) were found in CISH-A-31. The yield of aonla genotypes ranged from 13.25 ± 1.65 to 53.99 ± 1.97 kg/tree (Table 2). The highest yield (53.99 ± 1.97 kg/tree) was recorded in CISH-A-33, followed by CISH-A-31 (44.17 ± 0.91 kg/tree), while the lowest yield (13.25 ± 1.65 kg/tree) was observed in CISH-A-27.
Fruit morphological traits for 11 genotypes.

Biochemical attributes of aonla genotypes
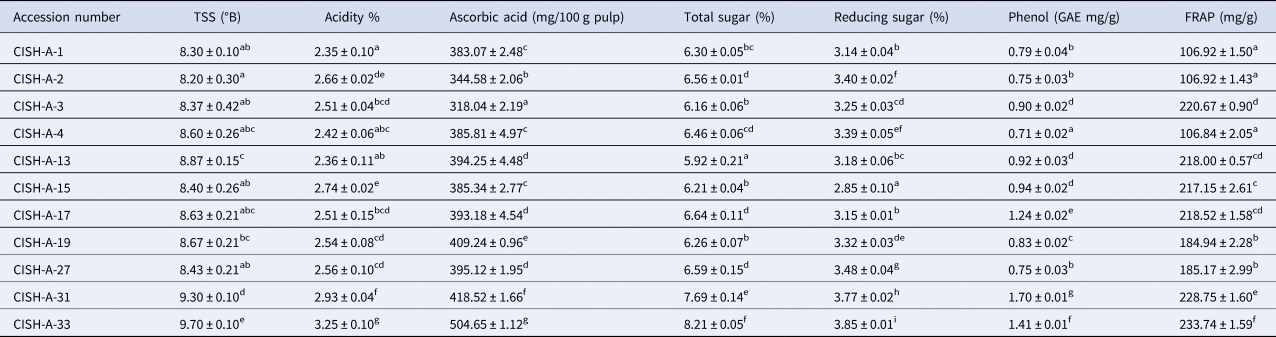
In the present study, TSS value of aonla genotypes varied from 8.20 ± 0.30 to 9.70 ± 0.10°B. Notably, CISH-A-33 exhibited the highest TSS content (9.70 ± 0.10°B) followed by CISH-A-31 (9.30 ± 0.10°B) while lowest content in CISH-A-2 (Table 3). The acidity was recorded highest in CISH-A-33 (3.25 ± 0.10%) followed by CISH-A-31 (2.93 ± 0.04%) and lowest in CISH-A-1 (2.35 ± 0.10%). The CISH-A-33 exhibited the highest ascorbic acid content (504.65 ± 1.12 mg/100 g) followed by CISH-A-31 (418.52 ± 1.66 mg/100 g) while lowest content in CISH-A-3 (318.04 ± 2.19).
Biochemical traits of 11 aonla accession in sub-tropical region of India

TSS: total soluble solids; FRAP: ferric reducing antioxidant power.
Values presented as means ± SD. Values in columns with different lowercase letters (small alphabets) indicate significantly different; P < 0.05, Duncan's multiple range test between genotypes.
The total and reducing sugar levels among various aonla genotypes ranged from 5.92 ± 0.21 to 8.21 ± 0.05% and 2.85 ± 0.10 to 3.85 ± 0.01%, respectively (Table 3). The genotype CISH-A-33 exhibited the highest total sugar (8.21 ± 0.05%) and reducing sugar (3.85 ± 0.01%), followed by CISH-A-31 (7.69 ± 0.14 and 3.77 ± 0.02%).
The studied genotypes showed significant variation (P < 0.5) in phenol content, ranging from 0.71 ± 0.02 to 1.70 ± 0.01 g/100 g GAE (Table 3). The highest phenol content was found in CISH-A-31 (1.70 ± 0.01 g/100 g GAE), followed by CISH-A-33 (1.41 ± 0.01 g/100 g GAE), with the lowest in CISH-A-4 (0.71 ± 0.02 g/100 g GAE). FRAP values among aonla genotypes ranged from 106.84 ± 2.05 to 233.74 ± 1.59 mg/g (Table 3). The genotype CISH-A-33 showed the highest FRAP content (233.74 ± 1.59 mg/g), followed by CISH-A-31 (228.75 ± 1.60 mg/g), with the lowest content in CISH-A-4 (106.84 ± 2.05 mg/g).
Correlation between morphological and biochemical traits
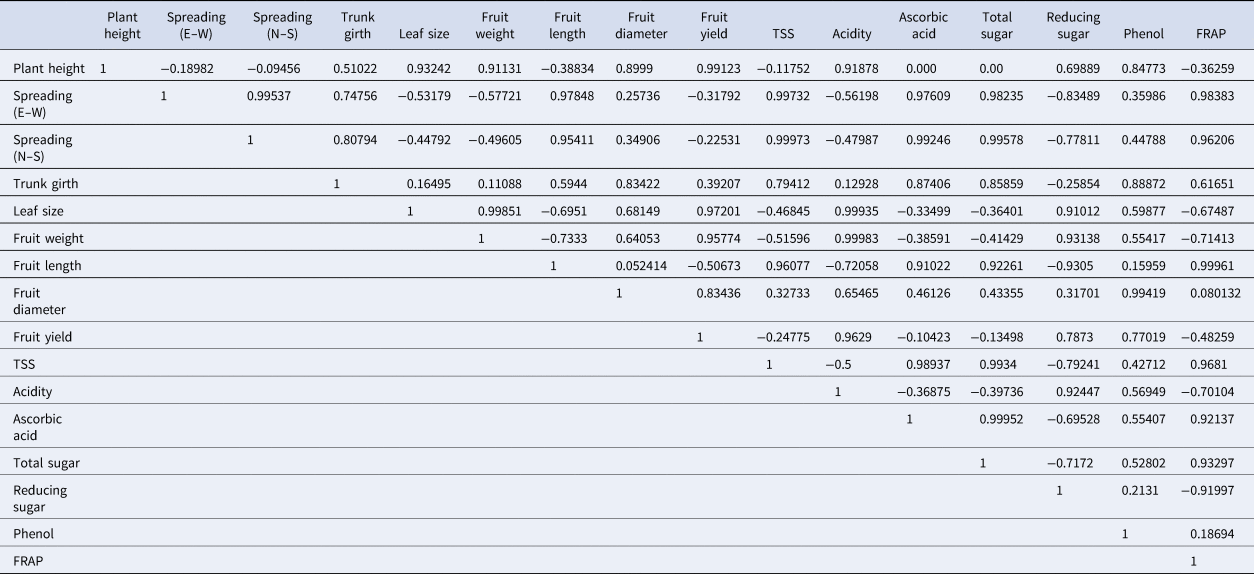
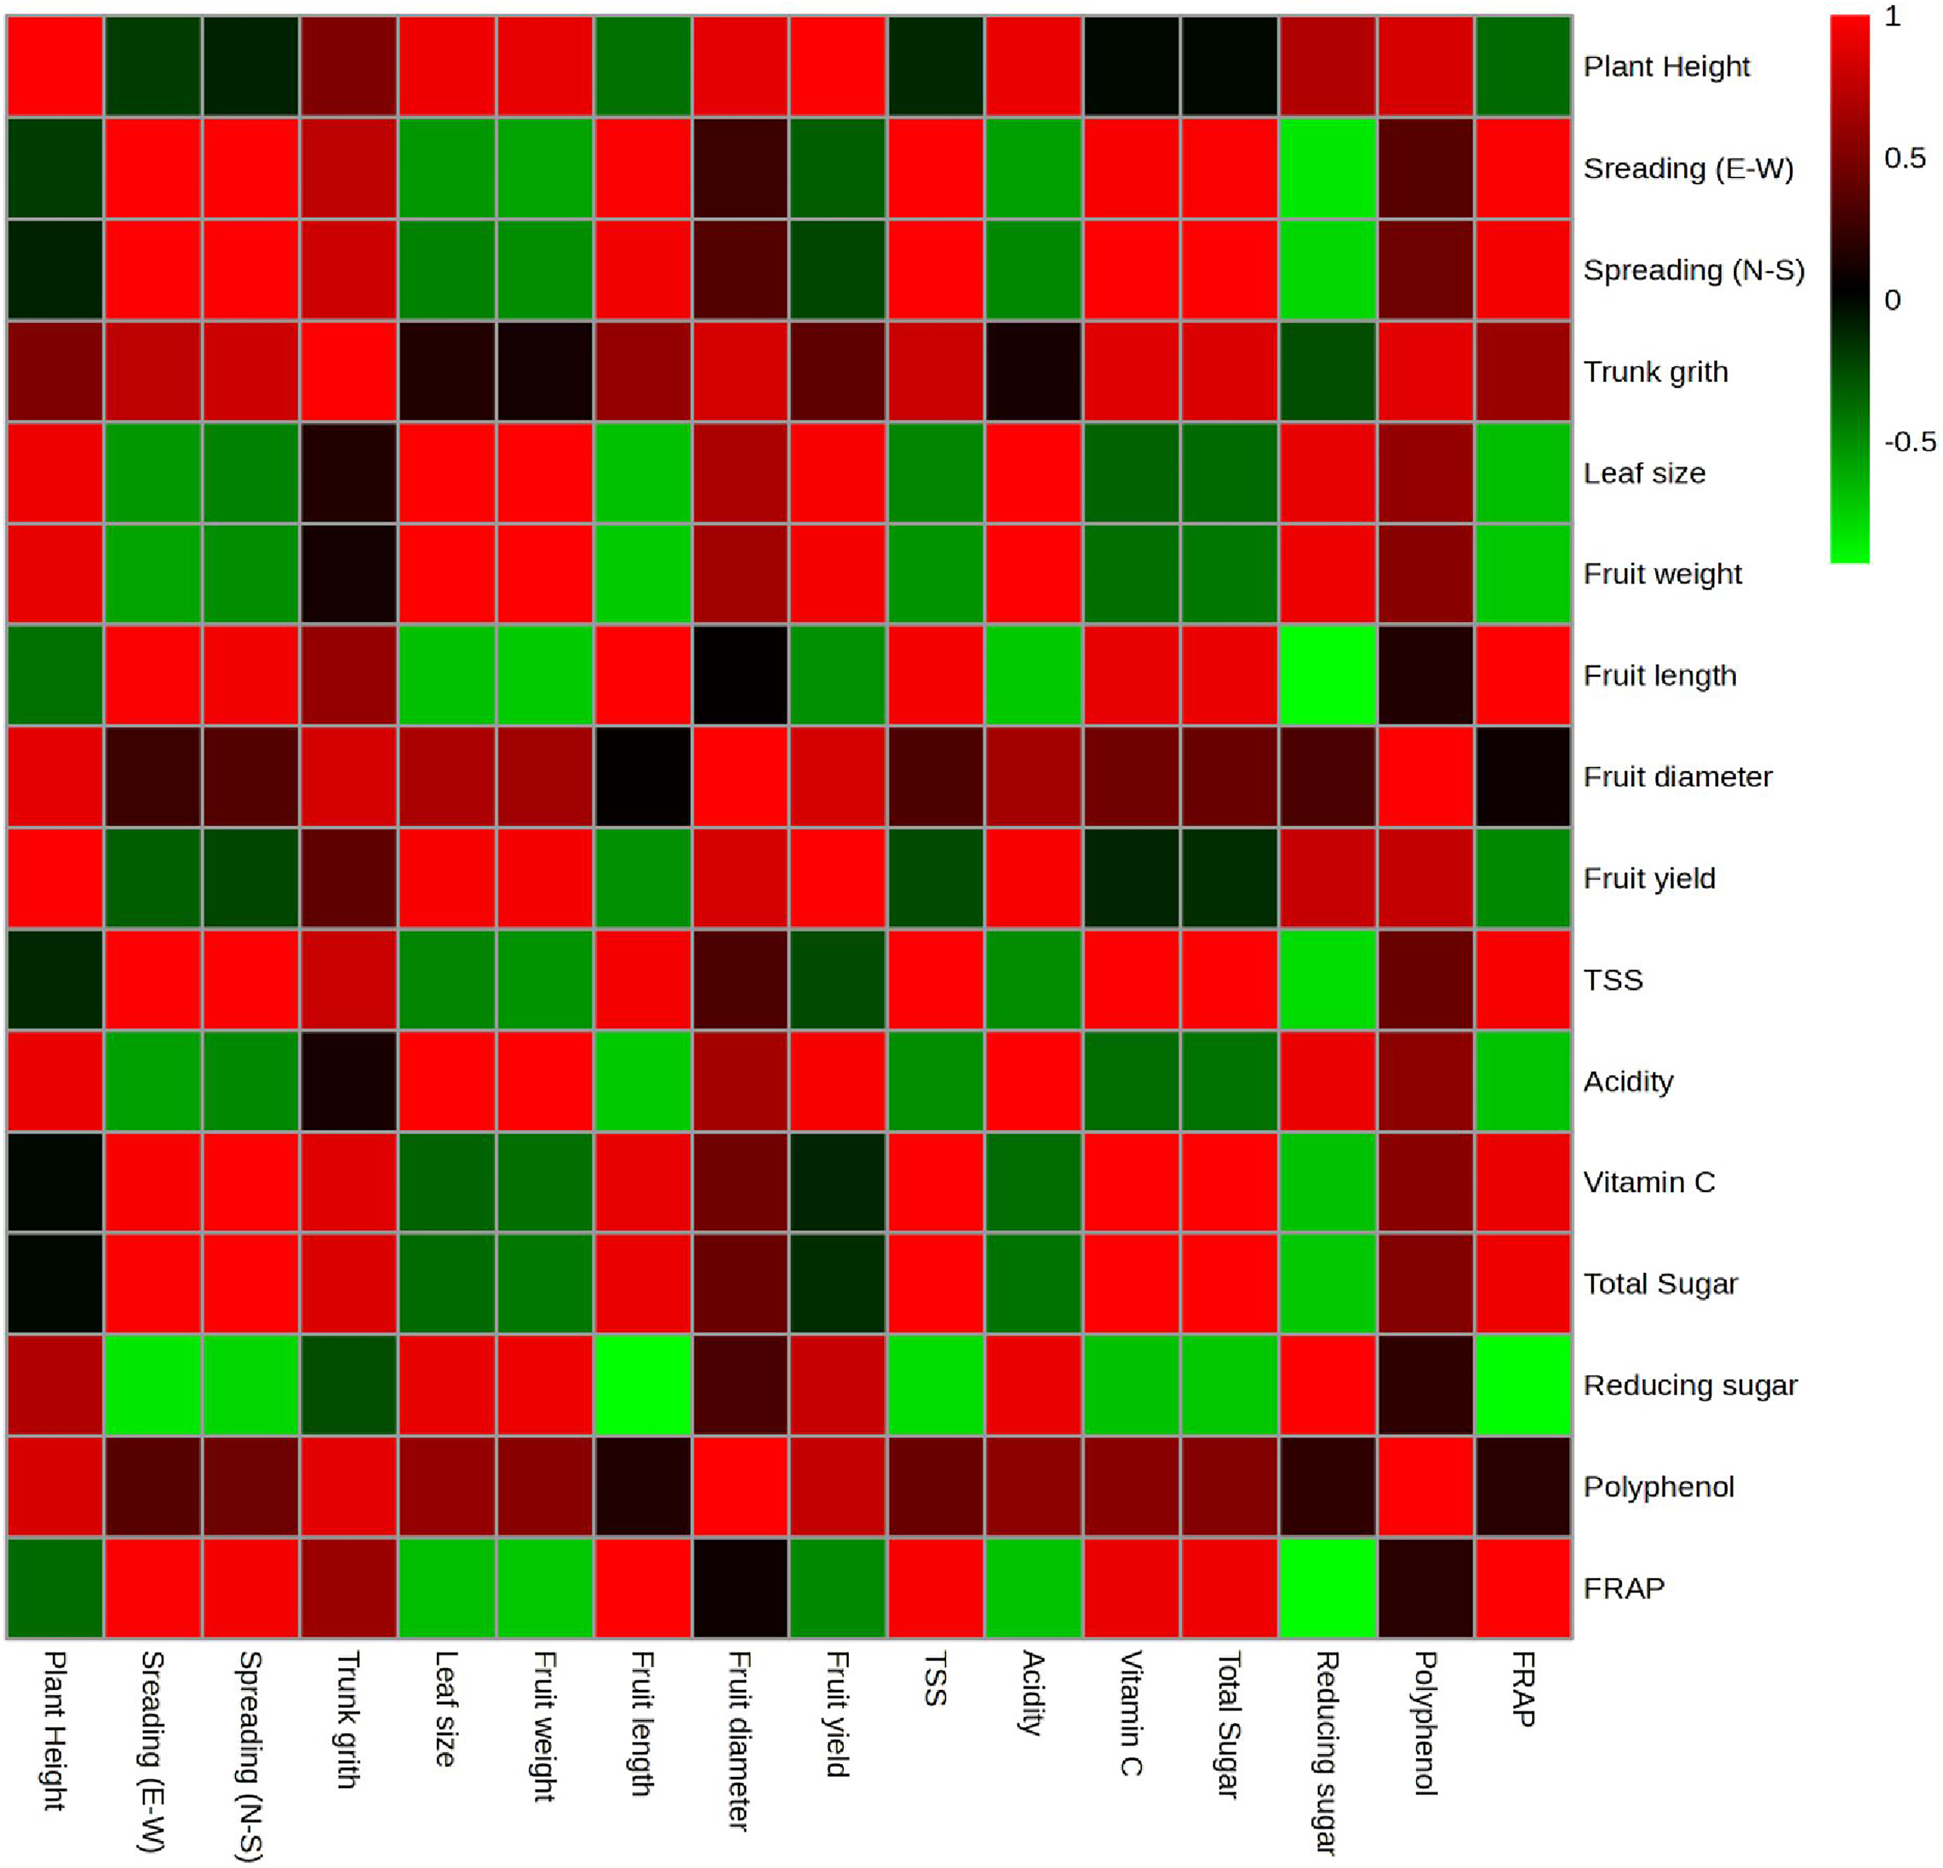
The correlation studies conducted on various morphological, biochemicals and fruit traits have offered valuable insights into the interrelationships among these parameters (Table 4 and Fig. 2). Fruit weight showed a strong positive correlation with fruit yield (0.957), fruit diameter (0.640), acidity (0.999), reducing sugar (0.931) and polyphenol content (0.554), while displaying negative correlations with traits such as TSS (−0.515), ascorbic acid (−0.385), total sugar (−0.414) and FRAP content (−0.714). Similarly, yield was positively correlated with important biochemical traits like ascorbic acid (0.962), reducing sugar (0.787) and polyphenol content (0.770). In contrast, yield exhibited negative correlations with TSS (−0.247), total sugar (−0.134), ascorbic acid (−0.104) and FRAP content (−0.482).
Correlation between morphology and biochemical attributes of genotypes

Correlation significant at the 0.05 level.
Heat-map correlation for physico-chemical traits for 11 genotypes.

Principal component analysis
In this particular study, PCA was done to identify genotypic diversity based on fruit and biochemical traits. The additional details are provided in the online Supplementary materials.
Cluster analysis
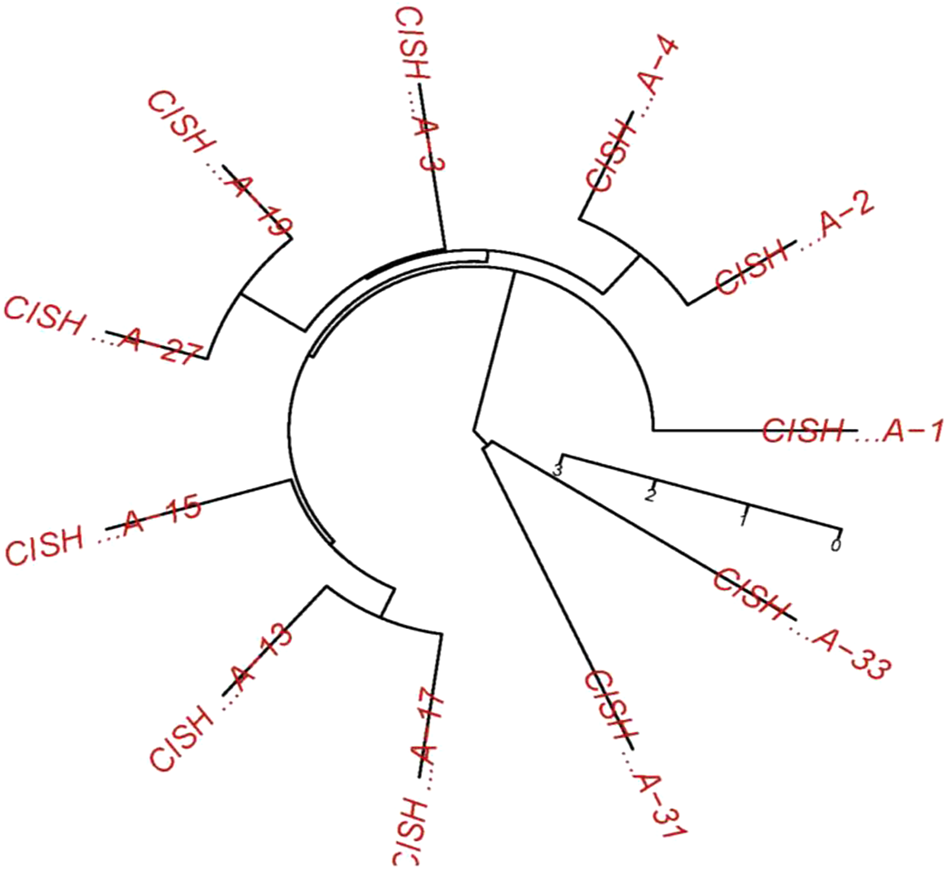
Cluster analysis of 11 genotypes, based on morphological and biochemical parameters, revealed two primary groups when visualized using a dendrogram (Fig. 3). The additional details are provided in the online Supplementary materials.
Dendrogram analysis of 11 genotypes of aonla focusing on morph-biochemical traits.

Discussion
Morphological attributes of aonla genotypes
The current work explored the impact of genotype variation on the morphological and biochemical parameters of aonla cultivated in the sub-tropical region of India under alkaline conditions. In-depth measurements of plant characteristics, including height, east–west and north–south plant spread, trunk girth, leaf size, fruit weight, fruit length and diameter and yield (kg/tree), were taken during the study and are shown in Table 2. Alkaline stresses hinder plant growth and development by disrupting various physiological processes, such as photosynthesis, ion homoeostasis, Reactive oxygen species regulation and the antioxidant system (Aung et al., Reference Aung, Shi, Zhai, Xue, Wang, Ren and Zhang2022). In the present study, the CISH-A-31 genotype was found to have the highest values for plant height, plant spread and trunk girth. However, the CISH-A-33 genotype had the biggest leaf size among the genotypes under alkaline conditions. These differences are probably caused by the many genotypes found in the aonla germplasm, which are impacted by their agroclimatic conditions and genetic composition. Alkaline conditions can influence soil water dynamics or trigger osmotic adjustments in plants. When these adjustments enhance water uptake or retention, plants can maintain higher turgor pressure, promoting the development of larger leaf cells and ultimately larger leaves (Aung et al., Reference Aung, Shi, Zhai, Xue, Wang, Ren and Zhang2022). Results of our study on morphological behaviour of aonla accessions was comparable to Singh et al. (Reference Singh, Kumar and Sharma2021, Reference Singh, Pandey, Gangadhara, Yadav, Rane, Krishna and Ravat2024) who obtained plant growth differences among the genotypes collected from different locations.
Fruit weight, a key trait for selecting promising cultivars, has high genetic heritability, offering significant potential for genetic improvement (Singh et al., Reference Singh, Uniyal, Rawat and Rana2012, Reference Singh, Pandey, Gangadhara, Yadav, Rane, Krishna and Ravat2024). Due to genotype-specific reactions to alkaline soil conditions, CISH-A-33 had the maximum fruit weight and length in this study, while CISH-A-31 had the lowest. Changes in cell division, expansion and intercellular space growth can all be responsible for changes in fruit weight (Bairwa et al., Reference Bairwa, Verma, Pal, Prakash, Kumar and Shivran2020). Commercial cultivation relies heavily on yield, which varies across genotypes from 13.25 ± 1.65 to 53.99 ± 1.97 kg/tree. The maximum yield was obtained by CISH-A-33, followed by CISH-A-31, and the lowest by CISH-A-27. Variations in fruit number, weight, genotype development potential and soil conditions could be the cause of this discrepancy. These findings align with previous studies on aonla cultivars under sub-tropical conditions comparable to other varieties, viz. Narendra Aonla-6, Narendra Aonla-7 and Narendra Aonla-10 (Bakshi et al., Reference Bakshi, Wali, Jasrotia, Sharma and Iqbal2015; Singh et al., Reference Singh, Singh and Makwana2015; Maurya et al., Reference Maurya, Pratap, Sonkar, Tiwari, Yadav, Pratap and Kumar2024). Based on their balanced fruit size and higher yield, CISH-A-33 and CISH-A-31 are recommended for cultivation in alkaline soils.
Biochemical attributes of aonla genotypes
The aonla genotypes showed notable differences in biochemical characteristics, including TSS, acidity, total sugar, ascorbic acid, polyphenol and antioxidant content. Ripeness, flavour and processing suitability are all influenced by TSS (Bulo et al., Reference Bulo, Nimbolkar, Singh, Sahu, Wangchu, Das and Pandey2024). Due to variances in genotype, microclimate and development phases, CISH-A-33 showed the greatest TSS in this study, while CISH-A-2 had the lowest. These results are consistent with earlier research (Gupta et al., Reference Gupta, Singh and Shvetambri2003; Godara et al., Reference Godara, Sharma, Goyal and Kumar2004). Similarly, CISH-A-33 had the highest acidity, which affects flavour and preservation, indicating changes in the metabolism of organic acids throughout ripening (Godara et al., Reference Godara, Sharma, Goyal and Kumar2004).
Ascorbic acid, a key antioxidant, varied significantly among genotypes, with CISH-A-33 showing the highest content (318.04 ± 2.19 to 504.65 ± 1.12 mg/100 g pulp). These differences may be linked to genotype-specific adaptations to alkaline soil, influencing nutrient synthesis (Killadi et al., Reference Killadi, Dikshit and Chaurasia2015). This result is consistent with studies under sub-tropical conditions (Bakshi et al., Reference Bakshi, Wali, Jasrotia, Sharma and Iqbal2015; Singh et al., Reference Singh, Singh, Singh, Bhargava and Makwana2016), and emphasizes the nutritional value of certain aonla cultivars.
Total and reducing sugars, essential for energy production and health, were highest in CISH-A-33, influenced by climatic conditions and genetic performance. The increase in reducing sugars likely results from enzymatic breakdown and photosynthate translocation during fruit ripening (Geetha et al., Reference Geetha, Kumar, Sandooja and Rana2006; Pandey et al., Reference Pandey, Shukla and Kumar2008). These findings are consistent with previous studies on sugar content in aonla varieties (Nimse and More, Reference Nimse and More2018; Bairwa et al., Reference Bairwa, Verma, Pal, Prakash, Kumar and Shivran2020).
CISH-A-31 had the highest levels of polyphenolic chemicals, which add flavour, colour and health benefits. CISH-A-33 came in second. The higher phenol content in CISH-A-31 may reflect its genetic adaptation to alkaline soil, with phenolic compounds acting as a defence mechanism against stress (Devi et al., Reference Devi, Kaur, Singh and Singh2020; Zagoskina et al., Reference Zagoskina, Zubova, Nechaev, Kazantseva, Goncharuk, Katanskaya and Aksenova2023). Our findings align with previous studies showing genetic control of phenol content (Pandey et al., Reference Pandey, Shukla and Kumar2008; Singh et al., Reference Singh, Singh, Singh, Bhargava and Makwana2016).
CISH-A-33 and CISH-A-31 had the highest FRAP values, which indicate antioxidant activity. Since ascorbic acid levels and antioxidant activity are strongly correlated, this is probably due to their higher ascorbic acid content. Increased antioxidant synthesis is probably a protective reaction to the physiological stress brought on by alkaline conditions (Zagoskina et al., Reference Zagoskina, Zubova, Nechaev, Kazantseva, Goncharuk, Katanskaya and Aksenova2023; Shukla et al., Reference Shukla, Kumar, Bhardwaj, Pandita, Patel, Thakur and Saxena2024). These results demonstrate how genotype, environmental factors and metabolic pathways interact intricately to determine the antioxidant qualities of aonla fruits.
The correlation table clearly demonstrates that most biochemical traits show a positive relationship with the fruit yield trait, reinforcing the idea that higher yields are generally associated with increased biochemical content for many traits. However, certain traits, such as TSS, total sugar, ascorbic acid and FRAP content, display negative correlations with yield. This pattern highlights the inverse relationship among these traits and offers valuable insights into their interconnections, providing a solid foundation for further research and analysis of fruit characteristics. Similar findings have been reported in studies on fruit crops like bael (Poojan et al., Reference Poojan, Dwivedi, Pandey, Singh, Siddiqui, Pandey and Rajan2024) and Pyrus syriaca (Khadivi et al., Reference Khadivi, Mirheidari, Moradi and Paryan2020).
Conclusions
The study revealed substantial diversity among aonla accessions and their bioactive constituents, offering valuable insights for farmers by identifying high-performing genotypes having high nutraceutical values, i.e. high vitamin C and phenol content. This facilitates the selection of suitable varieties for alkaline soil conditions, enhancing crop survival, yield and profitability. Accessions CISH-A-33 and CISH-A-31 stood out with their superior fruit yield per plant and higher levels of key biochemical traits, including TSS, acidity, ascorbic acid, total sugar, reducing sugar, phenol and FRAP content, confirming their overall advantage over other accessions. Cluster analysis and PCA identified broad variation in biochemical and quality traits, underscoring the potential to develop aonla varieties optimized for alkaline conditions with enhanced yield and fruit quality. This research supports implementing evidence-based strategies focused on selecting superior germplasm, presenting a promising approach to enhance quality traits and tolerance to alkaline soil conditions. This study identifies promising E. officinalis genotypes (CISH-A-33 and CISH-A-31) for alkaline soils but has certain limitations that should be addressed in future research. Future research could focus on developing breeding programmes and multi-location trials across diverse agro-climatic regions are necessary to validate the adaptability and stability of these genotypes.
Supplementary material
The supplementary material for this article can be found at https://doi.org/10.1017/S1479262125000073
Acknowledgement
All the authors thankfully acknowledge the Director, ICAR-CISH Lucknow.
Author contributions
Devendra Pandey: collection of germplasm, monitored and guided for the experiment; Shiv Poojan and Shardulya Shukla: recorded observation, written manuscript; Himanshu Pandey: edited the manuscript and developed graphs; Sanjay Kumar Singh: review the manuscript and edited for grammar.
Funding statement
This study is an institute funded in house project.
Competing interests
None.
Consent for publication
All authors have approved the manuscript and agree with its submission to Plant Genetic Resources.
Availability of data and materials
The datasets generated during and/or analysed during the current study are available from the corresponding author on reasonable request.
Note
Generative AI and AI-assisted technologies’ slowdown during the writing process. In order to improve the manuscript's language, the author employed chatGPT, a generative artificial intelligence tool, during the writing process. Following the use of this tool, all authors examined and revised the manuscript's content.