INTRODUCTION
Although the allometric relationship between metabolism and body size has been an important topic in ecology and physiology since the beginning of the 20th Century (Calder, Reference Calder1984; Schmidt-Nielsen, Reference Schmidt-Nielsen1984; Brown et al., Reference Brown, Gillooly, Allen, Savage and West2004), metabolism at bathyal depths remains scarcely documented. The allometry of anaerobic enzymatic activity has received special attention in recent decades due to the discovery that the specific activities of glycolytic enzymes are greater in larger-sized animals than in smaller ones (Childress & Somero, Reference Childress and Somero1990; Somero & Childress, Reference Somero and Childress1990; Baldwin et al., Reference Baldwin, Seymour and Webb1995; Thuesen et al., Reference Thuesen, Mccullough and Childress2005). This tendency does not follow the widely documented allometry of the aerobic metabolism, in which specific metabolic activity decreases as body size increases (Kleiber, Reference Kleiber1932; Calder, Reference Calder1984; Schmidt-Nielsen, Reference Schmidt-Nielsen1984; Brown et al., Reference Brown, Gillooly, Allen, Savage and West2004; West & Brown, Reference West and Brown2005; White et al., Reference White, Phillip and Blackburn2007). The positive allometry of the glycolytic enzymatic activity found in pelagic organisms is thought to increase burst swimming, used in predator–prey interactions (Childress & Somero, Reference Childress and Somero1990; Somero & Childress, Reference Somero and Childress1990), and to be an adaptation for tolerating hypoxia during vertical migrations that cross the oxygen minimum zone (González & Quiñones, Reference González and Quiñones2002; Thuesen et al., Reference Thuesen, Mccullough and Childress2005). For benthic organisms, however, and specifically polychaetes, there is no clear interpretation for the positive allometry shown by the anaerobic metabolism (González & Quiñones, Reference González and Quiñones2000).
Here we report the aerobic and anaerobic enzymatic activity and allometric relationships in Hyalinoecia artifex, a carnivorous polychaete (Orensanz, Reference Orensanz and Kornicker1990) of the deep ocean (Verrill, Reference Verrill1880; Menzies et al., Reference Menzies, George and Rowe1973), whose genus is found widely distributed around the world (Kirkegaard, Reference Kirkegaard1995).
MATERIALS AND METHODS
Sampling and study area
Sampling was carried out on board the RV ‘Sonne’, Cruise 156 (PUCK expedition) off Antofagasta, Chile (22°47′98″S 70°32′58″W) in May 2001. The regional hydrography of the Humboldt Current System (HCS) is described in detail by Schneider et al. (Reference Schneider, Fuenzalida, Rodriguez-Rubio and Garcés-Vargas2003). Briefly, on the continental margin of Chile during non-El Niño regimes, the upper border of the Equatorial SubsurfaceWater (ESSW) reaches between 50 to 100 m depth and from there covering down to about 350–400 m water depth. Between this depth and about 1200 m the low salinity and high dissolved oxygen Antarctic Intermediate Water (AAIW) is distributed along the continental slope. Below this water mass (1200–3000 m), the deeper slope is influenced by the Pacific DeepWater (PDW).
Biological material
Specimens of H. artifex were collected at 1312 m depth, by means of an Agassiz trawl (mouth width 1.5 m; mesh size 10 mm). The sample was sifted through a 500 µm sieve and individuals were identified on board using a stereoscope. Each specimen was stored individually in a cryovial and kept in liquid nitrogen for later enzymatic analysis in the laboratory. The body weight of each organism was determined using an analytical balance and expressed as wet weight in grams.
The specimens were weighed and a sub-sample was homogenized in a buffer solution of K2HPO4 80 mM (pH 7.4), with an Ultra Turrax homogenizer (3×10 seconds at maximal speed) in an ice bath. The homogenate was centrifuged for 5 minutes at 6600 g and 4°C; the supernatant was used immediately to determine enzymatic and ETS activities.
Anaerobic enzymatic activity
ENZYME ASSAYS
The following pyruvate oxidoreductases (PORs) were analysed: lactate dehydrogenase (LDH, EC 1.1.1.27), octopine dehydrogenase (OPDH, EC 1.5.1.15), alanopine dehydrogenase (ALPDH, EC 1.5.1.17), and strombine dehydrogenase (STRDH, EC 1.5.1.22), as well as ethanol dehydrogenase (EtOHDH, EC 1.1.1.1). These enzymes were selected because they have been reported to be the most important for polychaetes in terms of anaerobic activity (Schiedek, Reference Schiedek1997; Gonzalez & Quiñones, 2000; Quiroga et al., Reference Quiroga, Quiñones, González, Gallardo and Jessen2007).
The extraction media (homogenization buffer) consisted of 200 mM phosphate buffer (K2HPO4), pH 7.9, 1 mM dithiothreitol, 0.3% (wt/vol) polyvinyl pyrrolidone, 5 mM EDTA, 0.1% (vol/vol) Triton X-100, and 3% (wt/vol) bovine sero albumin. The homogenized samples were centrifuged at 5000 g, for 5 minutes at 4°C, and the supernatants were used for enzymatic assays.
Measurements of the various enzyme activities were conducted by spectrophotometry at 340 nm (20°C). The assay mixture was modified from Schiedek (Reference Schiedek1997) and contained 80 mM K2HPO4 buffer, 0.1 mM NADH. Depending on the enzyme under study, 3.2 mM pyruvate, 3.2 mM pyruvate and 5.4 mM arginine, 3.2 mM pyruvate and 250 mM alanine, or 3.2 mM pyruvate and 250 mM glycine was added for LDH, OPDH, ALPDH and STRDH, respectively. Reactions were started by the addition of the supernatant and all determinations were made in triplicate. The measurements were expressed as µmol min−1 g−1 wet weight (IU g−1).
All enzymatic activity measurements were corrected for nonspecific NADH oxidation. In addition, OPDH, ALPDH, and STRDH were corrected for LDH activity when this enzyme was present.
Ethanol dehydrogenase (EtOHDH) activity was measured with an assay mixture of 80 mM K2HPO4 buffer, pH 7.9 at 20°C, 0.1 mM NADH, and 3.2 mM acetaldehyde. Reactions were started by adding the supernatant, after which absorbance was measured at 340 nm. Enzymatic activity was corrected for nonspecific NADH oxidation.
Respiratory electron transport activity (ETS) measurements
The electron transport system activity was determined according to the method described by Packard & Williams (Reference Packard and Williams1981). Preliminary experiments determined the optimum concentration of reactants and all assays were carried out in triplicate. The incubation temperature of the ETS assay was 20°C, estimating the activity of the electron transport chain through formazan formation, measured at 490 nm. The ETS was corrected to in situ temperature values using the Arrhenius equation, i.e.:

where S is the ETS in situ, A is the ETS incubation temperature of the assay, Ea the Arrhenius activation energy, k is the gas constant (1.987 cal mol−1 deg−1), Ta the assay temperature (in Kelvin degrees), and Ts the in situ temperature (Kelvin). An activation energy of 16.2 (kcal mol−1) was used (Arístegui & Montero, Reference Arístegui and Montero1995).
Statistical analysis
Data were analysed using a simple linear regression (r = correlation coefficient, α = 0.05, F = F calculated) after conducting a normality test (Shapiro–Wilk) (Zar, Reference Zar1999).
A power equation was used to describe the allometry of the enzymatic activity measurements (equation 2):

where Y is metabolic activity, W is body weight (wet weight in g), b is the slope, and a is the intercept. The power equation was linearized using a logarithmic transformation.
RESULTS AND DISCUSSION
The H. artifex specimens were in good condition when collected and they remained active until the time of cryopreservation. Their sizes ranged from 0.22 to 2.99 g (wet weight). Hydrographic conditions during the study period are reviewed in detail elsewhere (Hebbeln et al., Reference Hebbeln2001; Schneider et al., Reference Schneider, Fuenzalida, Rodriguez-Rubio and Garcés-Vargas2003; Palma et al., Reference Palma, Quiroga, Gallardo, Arntz, Gerdes, Schneider and Hebbeln2005), but are summarized briefly here. The oxygen concentration over the sediments (10 m from the bottom) during collection was 1.7 mL O2 L−1. The sediments presented a very high percentage of sand (97.97% in the first 5 cm) and the surface sediment had 2.58 and 20.70 µg g−1 dry weight of chlorophyll-a and phaeopigments, respectively.
Table 1 summarizes the activity of the ETS and enzymes analysed in this study. The specific ETS activity (296.18 uL O2 h−1 g−1) fell within the range described for polychaetes (Ikeda & Fay, Reference Ikeda and Fay1981; Cammen et al., Reference Cammen, Corwin and Christensen1990; Quiroga et al., Reference Quiroga, Quiñones, González, Gallardo and Jessen2007) and other benthic metazoos (Cammen et al., Reference Cammen, Corwin and Christensen1990; Madon et al., Reference Madon, Schneider and Stoeckel1998; Wahle et al., Reference Wahle, Tully and O'Donovan2001; Simcic et al., Reference Simcic, Lukanc and Brancelj2005). Likewise, enzymatic activity associated with the anaerobic metabolism was within the range previously reported for benthic organisms (Thuesen & Childress, Reference Thuesen and Childress1993; Grieshaber et al., Reference Grieshaber, Hardewig, Kreutzer and Pörtner1994; González & Quiñones, Reference González and Quiñones2000; Quiroga et al., Reference Quiroga, Quiñones, González, Gallardo and Jessen2007). The PORs ALPDH and STRDH had the highest average activity (12.66 and 10.78 µmol NADH min−1 g−1, respectively), followed by LDH and OPDH (0.35 and 0.11 µmol NADH min−1 g−1). Several authors (Grieshaber et al., Reference Grieshaber, Hardewig, Kreutzer and Pörtner1994; González & Quiñones, Reference González and Quiñones2000; Quiroga et al., Reference Quiroga, Quiñones, González, Gallardo and Jessen2007) have reported high activity for these enzymes in polychaetes and have suggested this to be an adaptation for coping with environmental and/or functional hypoxic situations. Although the environmental oxygen concentration in which H. artifex was found (~1.7 mL O2 L−1) is considered to be moderate hypoxia (Diaz & Rosenberg, Reference Diaz and Rosenberg1995; Mistri, Reference Mistri2004), the activity of these PORs could reflect the increased glycolytic metabolism needed to maintain the high muscular activity that a carnivore like H. artifex must exert during predation. It is likely that this strong muscular activity often results in functional hypoxia, especially in an oxygen-limited environment. Thus, high ALPDH and STRDH activities are less damaging than high LDH activity because their accumulation products (alanine and strombine) are much less acid (20 times) than lactate (Zammit, Reference Zammit1978). Limiting the use of LDH to minor functional hypoxic events avoids the risk of provoking cellular acidosis (Pörtner, Reference Pörtner2002). When the EtOHDH activity (0.48 µmol NADH min−1 g−1) is also considered, the high number of dehydrogenases found in this polychaete is consistent with its adaptation to the environmental hypoxic conditions (Grieshaber et al., Reference Grieshaber, Hardewig, Kreutzer and Pörtner1994) and explains biochemically the wide range of environments, in terms of oxygen conditions, that the genus inhabits worldwide.
Averages and standard error (±) of specific activity of lactate dehydrogenase (LDH), octopine dehydrogenase (OPDH), alanopine dehydrogenase (ALPDH), strombine dehydrogenase (STRDH), ethanol dehydrogenase (EtOHDH) (activity in µmol NADH min−1 g−1), and the activity of the electron transport system (ETS) (µLO2 h−1 g−1) in Hyalinoecia artifex. Weight ranged from 0.22 to 2.99 g (wet weight).

Aerobic and anaerobic metabolisms are usually reported to decrease with increasing hydrostatic pressure (Drazen & Seibel, Reference Drazen and Seibel2007). This has been shown using both oxygen consumption (Childress & Thuesen, Reference Childress and Thuesen1993; Thuesen & Childress, Reference Thuesen and Childress1994; Seibel et al., Reference Seibel, Thuesen, Childress and Gorodezky1997) and enzymatic activity (Hochachka & Somero, Reference Hochachka and Somero1984; Vetter et al., Reference Vetter, Lynn, Garza and Costa1994; Seibel et al., Reference Seibel, Thuesen and Childress1998). Nevertheless, the specific enzymatic activity measured in H. artifex does not differ largely from that reported for organisms from shallower waters (Ikeda & Fay, Reference Ikeda and Fay1981; Cammen et al., Reference Cammen, Corwin and Christensen1990; Thuesen & Childress, Reference Thuesen and Childress1993; Grieshaber et al., Reference Grieshaber, Hardewig, Kreutzer and Pörtner1994; Madon et al., Reference Madon, Schneider and Stoeckel1998; González & Quiñones, Reference González and Quiñones2000; Wahle et al., Reference Wahle, Tully and O'Donovan2001; Simcic et al., Reference Simcic, Lukanc and Brancelj2005; Quiroga et al., Reference Quiroga, Quiñones, González, Gallardo and Jessen2007). We hypothesize that the similarity observed in H. artifex enzymatic activity with that of shallower polychaetes may be related to its carnivorous feeding behaviour.
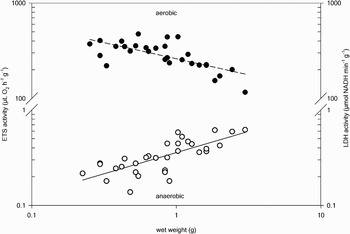
The linear relationship (log–log) between enzymatic activity associated with anaerobic metabolism and body size (Table 2) was only significant for LDH (P < 0.001), with enzymatic activity (µmol NADH min−1 g−1) increasing as a function of body size, as can be seen in Figure 1. The positive scaling of LDH activity agrees with the allometry of the anaerobic metabolism, in which the specific activity of PORs increases with body size (Childress & Somero, Reference Childress and Somero1990; Somero & Childress, Reference Somero and Childress1990; Baldwin et al., Reference Baldwin, Seymour and Webb1995; González & Quiñones, Reference González and Quiñones2000; Thuesen et al., Reference Thuesen, Mccullough and Childress2005). This tendency does not follow the widely documented allometry of the aerobic metabolism, in which specific metabolic activity decreased when body size increased (Kleiber, Reference Kleiber1932; Brown et al., Reference Brown, Gillooly, Allen, Savage and West2004; Calder, Reference Calder1984; Schmidt-Nielsen, Reference Schmidt-Nielsen1984; West & Brown, Reference West and Brown2005; White et al., Reference White, Phillip and Blackburn2007). The slope found for the (log–log) relationship of LDH activity and body size in H. artifex (i.e. b = 0.44) is similar to that reported for Eufausia mucronata (b = 0.45) (González & Quiñones, Reference González and Quiñones2002) and very near to that reported for Paralichthys californicus (b = 0.39), a flat fish inhabiting deep benthos (Vetter et al., Reference Vetter, Lynn, Garza and Costa1994). To date, there is no clear explanation for the positive allometry of the glycolytic enzyme activity. It has been proposed that it is due to the demand for glycolytic energy as the distance for the diffusion of gases increases in larger organisms (Thuesen & Childress, Reference Thuesen and Childress1994). Future research is needed to explain this pattern.
Allometric relationship (log–log) of ETS activity (μLO2 h−1 g−1) (closed circles, N = 30) and LDH activity (µmol NADH min−1 g−1) (open circles, N = 32) in Hyalinoecia artifex. Body weight ranged from 0.22 to 2.99 g. The regression model (dashed line) describing the relationship between ETS activity (y) and wet mass (x) is log y = log 2.42 – 0.35 log (x) (r2 = 0.49; F-test for regression coefficient P < 0.001). The regression model (solid line) for the relationship between LDH activity (δ) and wet mass (ω) is log δ = log 1.78 + 0.44 log (ω)(r 2 = 0.54; F-test for regression coefficient P < 0.001).

Linear regression parameters of the relationship between specific activity and body size (g) in Hyalinoecia artifex. Regression model: log (specific activity) = log a+b log (wet weight in g). Where N = number of organisms, r2 = squared correlation coefficient, SEb = standard error of the slope b, P = probability. Weight ranged from 0.22 to 2.99 g (wet weight).

A negative slope of the relationship between specific aerobic metabolism and body size has been widely described for the animal kingdom, from the first observations of Kleiber (Reference Kleiber1932) to the most recent publications of West & Brown (Reference West and Brown2005) and White et al. (Reference White, Phillip and Blackburn2007). Although there is consensus regarding the negative nature of the slope, there is still no consensus about its numerical value (White et al., Reference White, Phillip and Blackburn2007). In the case of the ETS activity of H. artifex, there is a negative scaling with body size (Figure 1) with a slope (b) = –0.35. This value of the specific aerobic metabolism (ETS activity) is near b = –0.33, a general value proposed by several authors (e.g. Heusner, Reference Heusner1991; Nevill, Reference Nevill1994), although it differs from the other widely accepted slope value of b = –0.25 (e.g. Kleiber, Reference Kleiber1932; Brown et al., Reference Brown, Gillooly, Allen, Savage and West2004; Calder, Reference Calder1984; Schmidt-Nielsen, Reference Schmidt-Nielsen1984; West & Brown, Reference West and Brown2005). The case of H. artifex is not unique, since slopes more negative than –0.25 (such as those found herein) have also been described in the few allometric relationships reported using ETS activity for other benthic organisms in both marine (Wahle et al., Reference Wahle, Tully and O'Donovan2001; b = –0.32) and lake systems (Simcic & Brancelj, Reference Simcic and Brancelj2003; b = –0.33). Indeed, slopes close to b = –0.4 have been reported in the little data available regarding the allometric scaling of the aerobic metabolism of intertidal polychaetes of the Onuphid family (Mangum, Reference Mangum1972).
ACKNOWLEDGEMENTS
This research was funded by the Center for Oceanographic Research in the eastern South Pacific (COPAS, FONDAP-CONICYT, Chile, Grant No. 150100007). We wish to thank all participants of the RV ‘Sonne’ 156 Cruise (PUCK-Expedition 2001) who contributed to the success of this study. We thank Javier Sellanes, Eduardo Quiroga, and Ariel Pacheco for their valuable help onboard, and Maritza Palma for her identification of Hyalinoecia artifex.