Neonates undergoing surgery for congenital heart disease (CHD) are particularly vulnerable to adverse events due to the complex technical nature of the operations, the need for a multispecialty approach to care, variability in the complex cardiac anatomy to be corrected, and comorbid conditions that often accompany CHD.Reference Catchpole, Giddings and Wilkinson1–Reference Carthey, de Leval and Reason4 Catchpole et al demonstrated via direct observational studies of operative procedures that one can expect 9.9 minor negative events, defined as an event, which was undesirable but did not affect the “operative flow,” per operation.Reference Catchpole, Giddings and De Leval2 In his work on intraoperative error analysis, Catchpole created an intraoperative performance score that expressed operating problems, or negative events, as a proportion of the total number of successfully completed key tasks. Key tasks were defined by textbook intraoperative steps and local accepted practice, for example, aortic cannulation and heparin administration as a step in cardiac surgery. They demonstrated that for every three minor negative intraoperative events that occur above 9.9, intraoperative performance decreases by 1%.Reference Catchpole, Giddings and Wilkinson1 Whereas the importance of minor negative events has been shown to decrease operative performance, little has been done to practically mitigate these events. Traditional mortality and morbidity conferences focus on significant morbidity and mortality, leaving little opportunity to analyse what teams may perceive as irrelevant or inconsequential annoyances that, taken in aggregate, can have significant effect on outcomes. The lack of systems for analysing such issues is a profound gap in the current quality assurance processes of healthcare organizations.
Much work has been done to reduce this vulnerability, yet significant gaps remain.Reference Jacques, Anand and Hickey5–Reference Bowermaster, Miller and Ashcraft7 The Society for Thoracic Surgeons ranks programs based on outcomes with a star rating system, and these rankings are publicly available (https://publicreporting.sts.org/) to promote transparency. Many CHD programs publicly post their own outcomes by surgical complexity on hospital websites. Work has also been done to identify the human factors and intraoperative performance errors, which contribute to poor outcomes.Reference Catchpole, Giddings and Wilkinson1,Reference De Leval, Carthey and Wright8 However, congenital cardiac surgery outcomes are influenced not only by the intraoperative course but also by the care provided preoperatively and postoperatively, and this exemplifies the dynamic complexity of clinical settings.Reference Wilson and Holt9 Thus, a comprehensive evaluation of the hospital course as it relates to each patient’s outcomes is required.
Hickey et al described the application of threat and error analysis techniques to congenital heart surgery.Reference Hickey, Nosikova and Pham-Hung10 Each surgical admission constituted a “flight,” and each “flight path” was tracked in real time with the aim of identifying error chains. In the study by Hickey et al, threats, errors, and error chains were identified, but no formal process was described for mitigating the same threats and errors in future patients.Reference Hickey, Nosikova and Pham-Hung10 It can be challenging to develop a standard “flight path” for every congenital cardiac lesion a priori, due to patient comorbidities as well as variations in environmental factors, such as start time, case scheduling, and personnel present in the operating room.Reference Elhoff and Lasa11 Thus, we present the implementation of a modified version of the threat and error analysis applied to complex neonatal congenital cardiac surgical patients. In our model, a multidisciplinary team involved in the care of the patient meets regularly during the patient’s hospital course to determine the patient’s flight path. The flight path process includes the generation of a graphical representation of the hospital course from birth to discharge as described in the following. System processes, if any, contributing to threats and errors are identified, and action items are generated to improve the process for future patients. It is our hope that this will lead to improved outcomes and quality of care.
Methods
The project received institutional review board approval from the University of Louisville and Norton Healthcare Office of Research Administration. We performed a retrospective review of all congenital cardiac surgical cases that occurred at Norton Children’s Hospital between March 1, 2018 and March 31, 2019 in patients less than 30 days of age at the time of operation. Exclusion criteria included patients older than 30 days or patients undergoing the following index operative procedures: patent ductus arteriosus ligation, coarctation of the aorta repair, ventricular septal defect closures, and extracorporeal membrane oxygenation cannulation. The process for developing a “flight path” is outlined in the following, and a discussion of the project’s development follows.
Flight path development description
Principal Investigator schedules flight path review for all complex neonatal cardiac surgical patients within 72 hours after the operation. This time frame was chosen in an effort to minimise recall bias of the preoperative and intraoperative patient course prior to flight path generation.
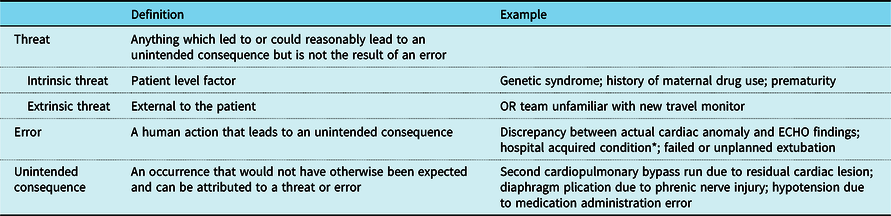
Representatives from the following specialties meet to review the case with discussion and input from all team members: cardiac surgery, nursing (Operating Room [OR] and Cardiac Intensive Care Unit [CICU]), neonatology, critical care, anesthesiology, cardiology, and perfusion. The goals of this process are to identify threats, errors, and unintended consequences that occurred during the patient’s hospital course. A detailed explanation of terminology can be found in Table 1. Occasionally, there are actions, which are somewhat difficult to classify as either threats or errors, having elements of both. In those instances, the multidisciplinary team arrives at a consensus on the best classification of the action.
Table 1.Terminology definitions and examples

OR = Operating Room.
*Central line associated bloodstream infections, ventilator associated infection, hospital acquired pressure injury, and catheter associated urinary tract infections. Hospital acquired conditions were defined utilising National Healthcare Safety Network definitions except for ventilator associated infection, which was defined as a positive sputum culture from an endotracheal tube accompanied by the clinical team decision to treat with antibiotics.
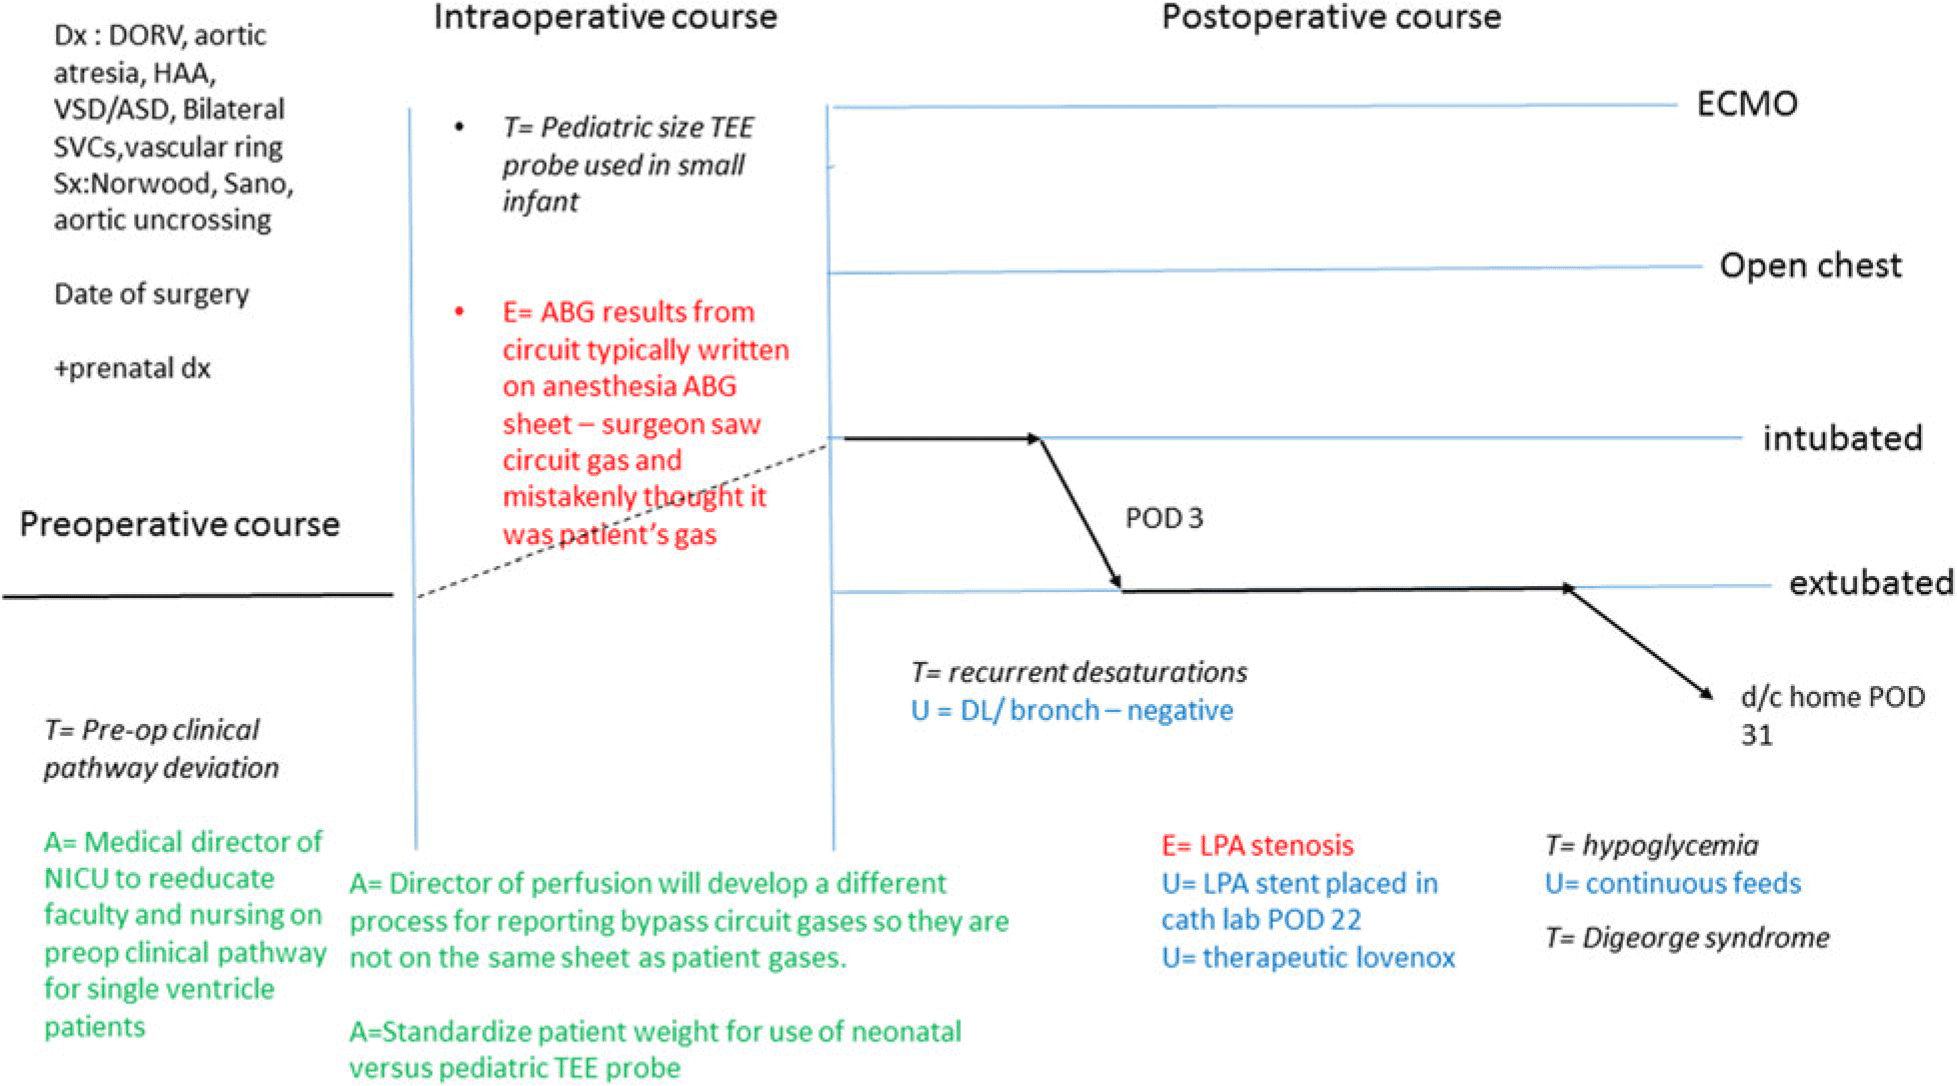
A graphical display of the “flight path” is generated utilising Microsoft PowerPoint by the principal investigator (Fig 1).
Figure 1.Example flight path A = action items; E = error; T = threats; U = unintended consequences attributed to the threat or error. (a) Beginning on the left-hand side of the graphic, the preoperative course is described. Important factors include: lesion, planned surgery, prenatal diagnosis, preoperative complications, respiratory support, and need for vasoactive medications. (b) In the middle of the graphic is a brief description of the operative course. Important factors include: operative concerns such as delay in blood product arrival, surgical errors, anesthesia complications, and perfusion issues. As the patient goes through the operative experience, a graphical line is draw representing an escalation in acuity and risk in their hospital stay during this time. (c) The right-hand side of the graphic represents the postoperative course. A line is drawn as the patient de-escalates or escalates care in the postoperative course. Important factors include: threats to the patient, errors in care, reoperations, unplanned procedures, and length of stay.
If any threats or errors are deemed secondary to a process issue, multidisciplinary team consensus is utilised to generate an action item to help improve the process, which led to the threat or error. A working group is assigned to address the items.
The principal investigator monitors the patient’s medical record and discusses with patient’s physicians weekly the patient’s progress. Any new threats, errors, or unintended consequences are noted on the flight path weekly until discharge.
Each flight path is reviewed at a weekly multidisciplinary clinical conference utilising a projection of the flight path visual facilitated by the primary investigator (PI). Representatives from each discipline involved in initial flight path generation are present at the weekly conference and participate in the generation of new action items based on threats or errors that occur during the remaining hospital course.
At discharge, each flight path and action item are logged into a database created utilising Microsoft Excel. Errors are categorised in the database as per Table 5, and threats are categorised as intrinsic and extrinsic (see Table 4).
The database is analysed quarterly by the principal investigator utilising descriptive statistics (percentage of threats and errors per case; percentage and number of threats and errors per category; and mortality rate) to look for trends in threats or errors across systems that may require improvement work and to monitor the success of prior action item implementations. This analysis is presented quarterly at heart institute mortality and morbidity conference.


A five-phase implementation framework was utilised to manage the project’s development. Phase 1 consisted of development of a project charter stating the goals and key metrics for the project. Nursing and physician champions were also identified. The champion’s role was to break down barriers and obtain resources necessary for implementation. For this pilot, the physician champion was the medical director of the hospital, and the nursing champion was the nursing director for acute care services.
Phase 2 consisted of project design. An effort was made to obtain input from the multidisciplinary team that would be a part of the flight path generation. A survey to capture stakeholder input was created using SurveyMonkey® and was sent to representatives from cardiac critical care, cardiology, nursing, perfusion, neonatology, and cardiac anesthesia. Questions were posed addressing the expectations of these key stakeholders for the new process, as well as fears they may have about moving forward. The answers were then analysed and grouped according to theme, as shown in Table 2. The flight path process was developed based on these survey results.
Voice of customer survey results

Phase 3 of the implementation process involved the development of a communication plan to ensure that all team members were aware of the process and their role. Our chosen approach involved written email communication to all members of the clinical team who care for congenital cardiac surgical patients announcing the project. An overview of the project was presented at Heart Institute meetings involving many of the key stakeholders whose participation was deemed necessary for success. Face to face communication and detailed conversations were held with the chiefs of cardiology, cardiac surgery, cardiac anesthesia, the medical director of the neonatal intensive care unit, and nursing leadership to achieve commitment to the project.
Phase 4 involved the development of a process for recording and analysing results. A database was developed to store completed flight paths and to log threats and errors in a categorical fashion.
Phase 5 focused on project sustainability. Electronic flight path templates were created to ease flight path creation. Maintenance of certification type-IV credit was obtained from the American Board of Paediatrics to reward participants who are certified by the American Board of Paediatrics for their meaningful participation in the project. Review of all flight paths, action items, and resolutions were presented each quarter at the Heart Institute Mortality and Morbidity conference. The same multidisciplinary team representatives present for flight path generation were also present for these conferences in addition to other heart institute team members. This allowed for widespread dissemination of information and awareness of the flight path quality improvement initiative across the entire heart institute.
Results
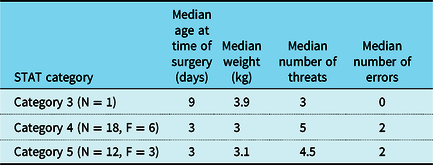
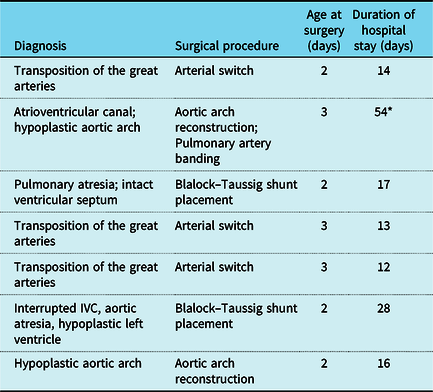
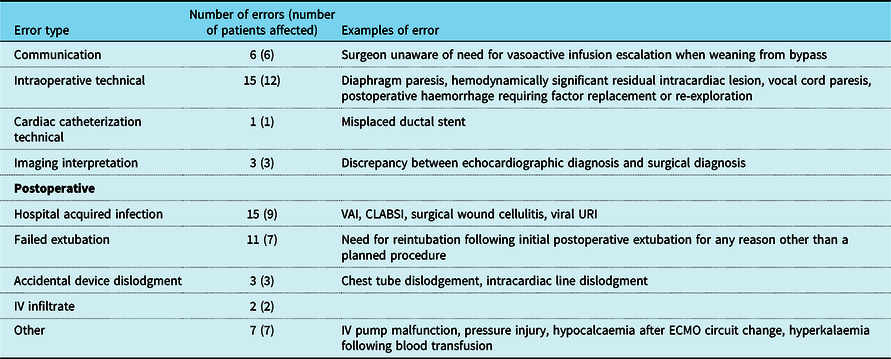
Our initial implementation included 34 patients. Due to schedule constraints, such as clinical schedule and vacations, only 31 of the 34 patients had a flight path review and were included in this analysis. Table 3 provides characteristics of the patients included in the analysis. The cohort had a 90.3% (N = 28) survival to discharge; 22.5% (N = 7) of patients had a completely error-free flight (meaning no errors were identified through the flight path review [Table 4]). Table 5 provides a summary of identified error types, the number of errors identified, and examples of each error type.
Patient characteristics

F = female; N = number.
There were 24 patients that had threats identified during their flight path reviews. The majority of the identified threats were intrinsic threats, such as lack of prenatal diagnosis, maternal drug use, genetic syndromes, or primary arrhythmias. Ten patients had extrinsic threats identified. Examples of extrinsic threats included accidental arterial line dislodgment by the patient and a delay in medication reaching the patient from the pump due to relatively large amount of priming volume in the manifold setup utilised for cardiac surgical patients.
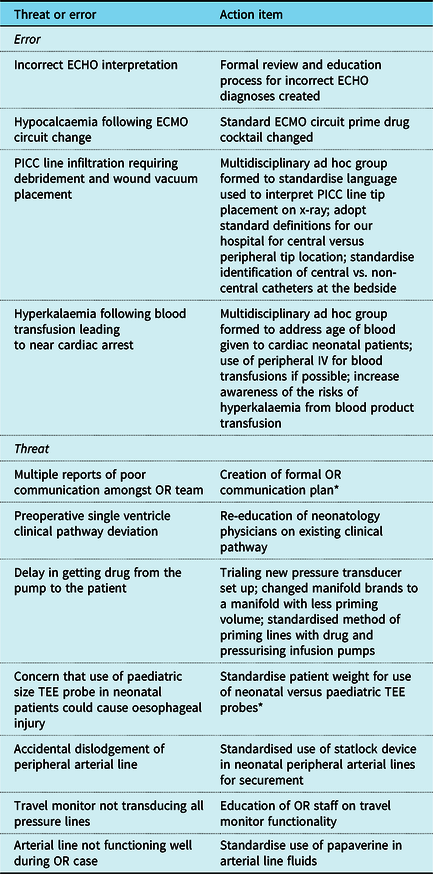
The identification of errors and threats led to causal analysis, which resulted in actions taken to enhance system reliability. A total of 11 action items were generated from the 31 flight path reviews, as shown in Table 6. Four action items were generated from errors identified through flight path review. The remaining seven action items were generated from identified threats. All but two action items were completed (Table 6).
Patients with error-free stay

IVC = inferior vena cava.
*Patient remained inpatient for longer than was clinically necessary for social concerns
Summary of identified errors

CLABSI = central line associated bloodstream infection; ECMO = Extracorporeal Membranous Oxygenation; IV = intravenous catheter; URI = upper respiratory infection; VAI = ventilator associated infection.
Threats and errors leading to action item generation

ECMO = Extracorporeal Membranous Oxygenation; IV = intravenous catheter; OR = Operating Room; PICC = peripherally inserted central catheter; TEE = transesophageal echocardiogram.
*Action item not completed
Discussion
In his text on human error, James Reason details that human error is unlikely to ever be eliminated.Reference Reason12 As we cannot eliminate the inherently fallible nature of humans, patient safety will benefit from an approach, which examines the threats within the system that lead to human errors.Reference De Leval, Carthey and Wright8,Reference Spear13 Human error can be evaluated by either person-oriented or system-based approaches.Reference Reason14 In a person-oriented approach, blame and intention become the focus of the evaluation. In contrast, a system-based approach evaluates the conditions, which led to the error. In this study, we present the successful implementation of a system-based approach utilising a modified threat and error flight path review process to identify systems processes that may contribute to poor outcomes in neonates with complex CHD requiring surgery.
Hickey et al demonstrated that human error can lead to cycles of error and poor patient outcomes through the use of threat and error modeling.Reference Hickey, Nosikova and Pham-Hung10 In the Hickey study, a single full-time Heart Centre Performance Coordinator was dedicated to tracking the patients and generating the flight paths via clinician interviews.Reference Hickey, Nosikova and Pham-Hung10 We were able to achieve flight path generation without any dedicated staff in a way that brought heart institute team members together frequently. As touted by Spear in his work on improving broken care delivery systems, the flight path generation and review process allowed physicians to collaboratively define expectations and study deviations closely, so they can experimentally learn how to achieve higher reliability in patient care.Reference Spear13This collaboration was viewed as an additional benefit.
Utilization of a structured design and implementation process was paramount to the success of the project. Surveying members to learn their hopes and fears for the project allowed us to mitigate some of the fears in the design process and thus achieve crucial support from team members. In addition, meetings were scheduled at times convenient for the largest number of key stake holders invited. The idea of creating a blame-free space for team members to engage in dialogue about patients’ clinical courses and outcomes was a key observation from the survey. In designing the flight path process, it was important to ensure the creation of a safe environment that could permit robust discussion about the true concerns present in a given patient’s flight path. A thorough communication plan was also key to ensure that members were aware of their importance and role in the process and to lay the foundation for the creation of a safe space for discussion. In addition, maintenance of certification type-IV credit was obtained for team members boarded by the American Board of Paediatrics, thus rewarding them personally for their active participation in flight path reviews.
Over the course of our study, program surgical mortality improved from 7.3% in the year prior to the flight path project implementation to 2.2% in the year following the flight path project initiative. Many factors likely contributed to this improvement. It is possible that the nine actions implemented to enhance system reliability had a favourable impact by reducing or mitigating errors and threats. Unfortunately, we were unable to directly quantify the impact of this work on outcomes. This is due to lack of sufficient resources to perform a multifactorial analysis that considers other contributions to the reduction in program surgical mortality along with our effort. That said, we are confident that our work indeed benefits patient safety based on what we have observed. We know, for example, that as the flight path driven action item to change our Extracorporeal Membranous Oxygenation (ECMO) circuit prime due to a case of hypocalcaemia, there have been no further incidences of hypocalcaemia following ECMO initiation.
Two action items were not completed – the development of a formal intraoperative communication plan and standardization of the use of neonatal versus paediatric transoesophageal echo probe based on patient weight. There may be several reasons for the lack of implementation on these two action items. For instance, we suspect that the conflict clinicians face when pulling time away from clinical duties to complete quality improvement projects is most likely a major factor. We must also acknowledge the possibility that not all persons involved recognised the perceived threats as actual threats or were committed to the idea of flight path review for process improvement. In addition, issues such as communication barriers are quite nebulous and difficult to address, perhaps requiring a slow and consistent change in culture involving significant investment from many people. We believe that the skilled leadership described by Spear as the fourth basic organizational capability is needed to address these challenges.Reference Spear15
Aside from process improvement, another benefit to implementation of the flight path reviews includes intangible improvement of communication and teamwork skills. Regular meetings bringing the entire team including neonatology, cardiothoracic surgery, operative services, nursing, critical care, cardiology, and perfusion together allowed us to learn from each other and to better understand the stresses to the system from each discipline’s perspective. The simple familiarity we have gained amongst team members has opened channels of communication that were previously not present. In addition, we now have an opportunity to understand how each person works within their discipline to achieve the common goal of excellent care and outcomes. In short, though difficult to measure, there seems to be a palpable breakdown of the “silos” existing within the heart institute and enhancement of teamwork that seems attributable to this process.
A key tenet of Hickey’s original application of the “threat and error” model is the concept that apical errors lead to error chains.Reference Hickey, Nosikova and Pham-Hung10 In our initial implementation, we chose to focus on system and process issues associated with individual threats and errors rather than the association of threats and errors with one another. In addition, unintended consequences are directly attributable to the identified threats and errors in many instances. For example, a hospital acquired central line associated blood stream infection may result in the unintended consequences of prolonged length of stay, antibiotic associated diarrhoea, and hemodynamic instability. This association is important and will be the focus of future work at our program.
Flight path reviews of complex congenital cardiac patients can be generated with relatively few resources, and they aid in the detection of quality improvement opportunities. Utilising a robust implementation framework as presented here can aid in the success and sustainability of the initiative and may be most valuable in those settings that have a high degree of complexity. We also hope readers gain a blueprint for developing and customising flight path review processes to their own centres from this paper, with emphasis on improving the quality of care in the congenital cardiac population.
Limitations of our study include the lack of resources for monitoring efficacy and sustainability of action items generated as a result of our flight path reviews and our institution’s lack of standard lesion specific clinical pathways to suggest what a typical “flight” should be for a given lesion. In addition, the use of flight path reviews could be enhanced by obtaining baseline and post intervention data for each action item. For example, if a given action item does not decrease the incidence of a threat or error, the multidisciplinary group could reconvene to determine alternative actions to test for mitigating the problem. Another limitation of the study is that the graphical display of the flight path does not allow for depiction of all possible “escalations” in risk or complexity of care. This was done in an effort to maintain a simple and consistent template for all patients. However, consideration of other templates to better capture a visual description of all increases in risk unique to each patient should be considered. Future directions may include reviews of several flight paths of the same lesion to develop clinical pathways, which would represent an ideal “flight” for a specific lesion.
At our centre, generation of action items and accountability to task completion from flight path reviews on a perpetual basis has been feasible and appears to have led to tangible system improvements. In addition, the regular multidisciplinary meetings that occur as a part of the flight path review process can improve workplace culture and promote inter-professional teamwork.Reference Beauchamp, McEwan and Waldhauser16 We recommend this technique to other centres in the hope that it will enable them to generate similar beneficial changes in patient care and team function.
Acklnowledgements
None.
Financial Support
This research received no specific grant from any funding agency, commercial or not-for-profit sectors.
Conflicts of Interest
None.