I. INTRODUCTION
Many investigations of new materials with catalytic properties have been focused on the hydrogen production by means of water, methane, methanol, and ethanol among others as hydrogen precursors. Reference Biswas and Kunzru1–Reference Yang, Ma and Wu7 A number of Ni-based catalysts with different supports, for example, Ni/CeO2–ZrO2, Reference Biswas and Kunzru1 Ni/CeO2,2 Ni/γ-Al2O3, Reference Lu, Li, Guo and Zhang3 Ni–Cu–Fe/γ-Al2O3, Reference Chesnokov and Chichkan4 Cu–Ni/SiO2, Reference Vizcaíno, Carrero and Calles5 Ni/SiO2, Reference Venugopal, Kumar, Ashok, Prasad, Kumari, Prasad and Subrahmanyam6 and Ni/ZnO Reference Yang, Ma and Wu7 have been successfully applied in the hydrogen production. Nickel is chosen and widely used as the active phase in steam-reforming reactions because of its high activity and low cost. However, the nanostructural properties of Ni supported on activated carbon in the hydrogen production have not been extensively studied.
For this, in the present research work, a series of Ni/C catalysts with various nickel loadings were prepared by the wet incipient impregnation method using nickel nitrate as the nickel precursor and activated carbon as the support. In oxidative dehydrogenation reactions at 623 K, Pereira et al. Reference Pereira, Órfão and Figueiredo8 reported catalytic photoactivity of carbon. In this research, the photodehydrogenation of ethanol is performed under mild conditions (pH ≈ 7, 298 K). Although nickel immobilized on activated carbon is responsible for the photodehydrogenation of ethanol, the textural properties of carbon allow us to improve reaction kinetics.
The textural properties were studied by surface fractal dimension (Ds) and nonlocal density functional theory (NLDFT) using adsorption–desorption isotherms data. The crystalline structure and the point defects in Ni crystallites were studied by x-ray diffraction (XRD), Rietveld refinement, radial distribution functions (RDFs), and electron density maps of Fourier. Morphology of the Ni/C catalysts was studied by transmission electron microscopy (TEM). The catalytic activity of the catalysts was evaluated in the photodehydrogenation of ethanol. Reference Weissermel and Arpe9 According to ab initio calculations [DFT/generalized gradient approximation (GGA)/Perdew–Burke–Enzerhof (PBE)] performed for this paper, the ethanol–water solution can be dehydrogenated using Ni/C photocatalysts.
The discussion of results was focused to show that hydrogen production is sensitive to the nanostructures of the Ni/C catalysts.
II. EXPERIMENTAL
A. Catalysts preparation
The Ni/C catalysts were prepared as follows: a calculated amount of nickel nitrate Ni(NO3)2·6H2O (Sigma-Aldrich, St. Louis, MO) was respectively added into 3 beakers containing 10-mL water to obtain 15, 20, and 30 wt% nickel on carbon. Next, carbon (CARBOCHEM, Ardmore, PA, 900 m2/g) was added to nickel solutions with constant stirring for 5 min. Afterward, the solids were dried at 373 K for 24 h. The dried NiO/C solids were annealed in nitrogen flow at 773 K for 4 h. Finally, the NiO/C solids were reduced in H2 flow (150 mL/min) at 773 K for 3 h to obtain Ni/C catalysts.
B. Characterization
1. Adsorption measurements
N2 sorption isotherms at 76 K on Ni/C were determined by means of an automatic Quantachrome Autosorb 3B instrument (Boynton Beach, FL). Prior to the adsorption run, all samples were outgassed overnight at 573 K. N2 and He gases required for the operation of the sorption apparatus were UHP grade. The specific surface areas were calculated from desorption isotherms by using the BET equation, and the pore size distribution functions (PSDFs) were obtained by NLDFT using a slit pore model. Reference Lowell, Shields, Thomas and Thommes10
The NLDFT method for pore size analysis is considered to be one of the most advanced methods with regard to pore size analysis of micro- and mesoporous materials. In this technique, a set of isotherms was calculated for a set of pore sizes in a given range. Reference Ravikovitch and Neimark11,Reference Neimark, Ravikovitch and Vishnyakov12 Such a set of isotherms, called kernel, is the basis for pore size analysis by density functional theory (DFT). The calculation of the pore size distribution is based on a solution of the generalized adsorption isotherm equation (GAI), which correlates the kernel of theoretical adsorption/desorption isotherms with the experimental sorption isotherm:
 $$N(P/{P^0}) = \int_{{W_{{\rm{MIN}}}}}^{{W_{{\rm{MAX}}}}} {N(P/{P^0},W)\,f(W){\rm{d}}W} \quad ,$$
where N(P/P 0) are the experimental adsorption isotherm data, W is the pore width, N(P/P 0,W) is the isotherm on a single pore of W, and f(W) is the PSDF. The GAI equation reflects the assumption that the total isotherms consist of a number of individual “single pore” isotherms multiplied by their relative distribution, f(W), over a range of pore sizes. Hence, NLDFT allows the adsorption study over a complete range, and it is possible to obtain with a single method a pore size distribution which extends over the complete micro–mesopore range. In this work, we have preferred the NLDFT model approach to evaluate PSDF since this method eliminates some of the most important shortcomings inherent to the BJH analysis Reference Ojeda, Esparza, Campero, Cordero, Kornhauser and Rojas13,Reference Lukens, Schmidt-Winkel, Zhao, Feng and Stucky14 mainly because it takes into account the variety of interaction potentials (i.e., solid–adsorbate, adsorbate–adsorbate, etc.) existing in the adsorption system and also because it can shed light about some of the particularities of the mechanistic aspects of the evaporation and condensation processes that are taking place inside the cavities and throats. Reference Mayagoitia, Rojas and Kornhauser15
2. Fractal dimension
The fractal dimension is a measure of classifying and quantitatively comparing complex chaotic patterns as shown in solid surfaces. In this way, it has been shown that although a chaotic behavior is essentially unpredictable in detail, this can be modeled quantitatively in a statistical sense. In the present work, the values of fractal dimension D s were calculated from the adsorption–desorption isotherms data using the Frenkel–Halsey–Hill equation expressed as follows Reference Wang and Li16,Reference Neimark17 :
 $$Ln({S^{\lg }}) = {\rm{const}} - (3 - {D_{\rm{s}}})Ln({\rm{\mu }})\quad ,$$
where S lg is the amount adsorbed at the relative pressure P/P 0 at the absolute temperature T and μ is the so-called adsorption potential defined as
 $${\rm{\mu }} = RTLn\left( {{{{P^0}} \over P}} \right)\quad .$$
3. Molecular hardness and UV-vis diffuse reflectance spectroscopy
The molecular hardness (η) is a global property which allows us to measure the resistance imposed by a system to charge transfer. Reference Pearson18–Reference Pearson21 In other words, less reactive systems have the highest hardness in agreement with the maximum hardness principle. Reference Pearson21 The molecular hardness is defined by the derivate of energy, which is expressed in terms of the number of electrons N and external potential v(r):
 $${\rm{\eta }} = {1 \over 2}{\left[ {{{{\partial ^2}E} \over {\partial {N^2}}}} \right]_{{\rm{\nu (}}r{\rm{)}}}}\quad ,$$
where the band gap energy (E g) can be expressed as follows:
 $${E_{\rm{g}}} = {\left[ {{{{\partial ^2}E} \over {\partial {N^2}}}} \right]_{{\rm{\nu (}}r{\rm{)}}}}\quad .$$
Experimentally the molecular harness of powder semiconductors can be obtained by the Kubelka–Munk's equation applied to UV-vis diffuse reflectance data as follows Reference Escobedo Morales, Sánchez Mora and Pal22 :
 $${[F({R_\infty })h{\rm{\nu ]}}^{\rm{2}}} = {C_2}(h{\rm{\nu }} - 2{\rm{\eta )}}\quad {\rm{,}}$$
where
 ${R_\infty } = {R_{{\rm{sample}}}}/{R_{{\rm{standard}}}}$
, C
2 is the constant of proportionality and hν is the photon energy. For this purpose, UV-vis spectra were obtained with a Varian Cary III UV-vis spectrophotometer (Cary, NC) coupled with an integration sphere for diffuse reflectance spectroscopy. A sample of MgO with a 100% reflectance was used as a reference.
4. XRD and Rietveld refinement
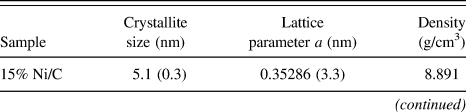
XRD data were obtained in a Bruker Advance D-8 diffractometer (Madison, WI) with Cu Kα radiation equipped with a detector Lynxeye and a graphite secondary beam monochromator. Intensities were obtained in the 2θ range between 40 and 110° with a step of 0.01° and a measuring time of 10 s per point. The nickel structures were refined by the Rietveld method with the parameters shown in Table I.
Parameters utilized for nickel structure refinement.

With the purpose of knowing quantitatively changes in densities obtained by the Rietveld method, the theoretical density (Table I) for a nickel structure was calculated by the following equation:
 $${{\rm{\rho }}_{{\rm{Ni}}}} = {{(Z)(M{M_{{\rm{Ni}}}}){{({\rm{Avogadro's}}\,{\rm{number}})}^{ - 1}}} \over {{\rm{Cell}}\,{\rm{volume}}}}\quad ,$$
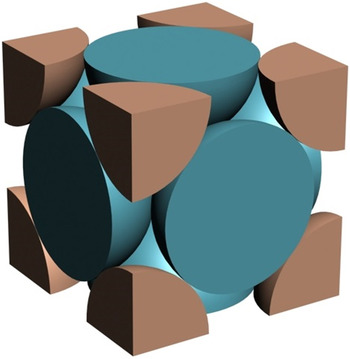
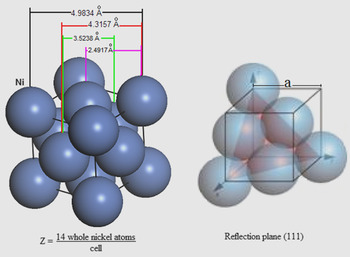
where MM Ni is the atomic weight and Z is the number of nickel atoms per cell. The “number of nickel atoms” per unit cell was calculated taking into account a face-centered cubic (FCC) structure as that shown in Fig. 1 and the following equation 23 :
 $$Z = {6 \over 2}({\rm{face}}) + 8*{1 \over 8}({\rm{vertexes}}) = 4{{{\rm{atoms}}} \over {{\rm{cell}}}}\quad .$$
Hypothetical chemical species (identical) in a unit cell: FCC.

Finally, the theoretical occupancy for Ni was calculated using its multiplicity and the maximum multiplicity for its space group as follows:
 $${\rm{Occupancy}}\,\,{\rm{theoretical}} = {{{\rm{Multiplicity}}\,\,{\rm{of}}\,\,{\rm{Ni}}} \over {{\rm{Maximum}}\,\,{\rm{multiplicity}}}} = {4 \over {192}} = 0.02083\quad .$$
This value means that 4 nickel atoms distributed, as that shown in Fig. 1, corresponding to an occupancy value of 0.02083.
5. Electron density maps of Fourier
Electron density maps are a bidimensional description of the electron density in a crystal structure, i.e., these maps describe content and the structural disorder (if any) in crystallites. The electronic density maps for Ni/C catalysts were obtained from XRD data on a point (x ,y, z) of the crystallite cell with volume V and calculated by Fourier's series Reference March24 using the structural factors F(h, k, l):
 $${\rm{\rho }}(x,y,z) = \;{V^{ - 1}}\mathop\sum\limits_h {\mathop\sum\limits_k {\mathop\sum\limits_l {F(h,k,l)\exp [ - 2{\rm{\pi }}i(hx + ky + lz)]} } } \quad ,$$
where (x, y, z) represent a vector r of real space, with one vectorial space (a, b, c), and (h, k, l) coordinates of one vector from the reciprocal space with base (a*, b*, c*), i.e., they are the coordinates from the diffraction plane that it is given by the Bragg's Law. The electron density distributions were delineated for a slice with z = 0, i.e., face ba. In this work, the electron density maps are focused to look for changes between the interatomic distances of nickel atoms.
6. Radial distribution functions
RDF, or the pair correlation function [G(r)], is a measure to determine the correlation between particles within a system. Specifically, it is the probability of finding a particle at a distance of r away from a given reference particle. RDFs G(r) of Ni/C catalysts calcined at 773 K were obtained with a Siemens D500 diffractometer (Cherry Hill, NJ) coupled to a molybdenum anode x-ray tube. Intensities and angles were measured with a step of 0.01°, from 2 to 110°, and these were the input data for the program Radiale. Reference Magini and Cabrini25 RDFs were obtained up to a radius of 6 Å.
7. Transmission electron microscopy
TEM analyses of Ni/C crystallites were performed in a JEE-2200FS transmission electron microscope (JEOL USA, Inc., Peabody, MA) with an accelerating voltage of 200 kV. The microscope is equipped with a Schottky-type field emission gun and an in-column omega-type energy filter.
8. Ab initio calculations using DFT
For ethanol–water system, interaction energy (ΔE), electronegativity (χ), molecular hardness (η), and energy band gap (E g) were calculated using a molecular mechanics program (Accelrys Materials Studio V6.1). 26 Interfacial binding characteristics of ethanol and their interactions with water were investigated using molecular mechanics. A representative structure of ethanol and water were utilized for the calculations.
The calculations are performed within the DFT through the GGA with the PBE functional Reference Perdew, Burke and Ernzerhof27 by using norm conserving pseudopotentials. Reference Hamann, Schlüter and Chiang28
9. Catalytic activity measurement
Photoactivity of the Ni/C catalysts was evaluated using a 200-mL Pyrex batch reactor containing an aqueous ethanol–water solution with a molar ratio of 1:1 and 0.2 g of catalysts. Photoirradiation was made using a high-pressure Hg lamp encapsulated in a quartz tube with λ = 254 nm (4.88 eV) and an intensity of 4.4 mW. Circulation of gases was made with a peristaltic pump. The reaction procedure was followed by taking sample each hour. Products were analyzed using gas chromatography in a GC Varian 3800 with a detector TCD and capillary column (Mol Sieve 5A).
III. RESULTS AND DISCUSSION
A. Textural properties
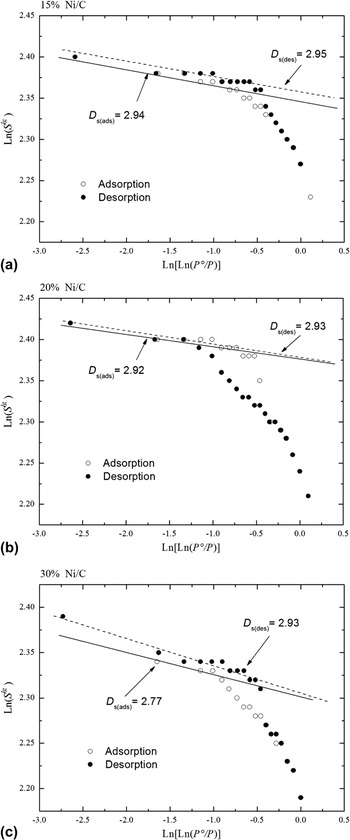
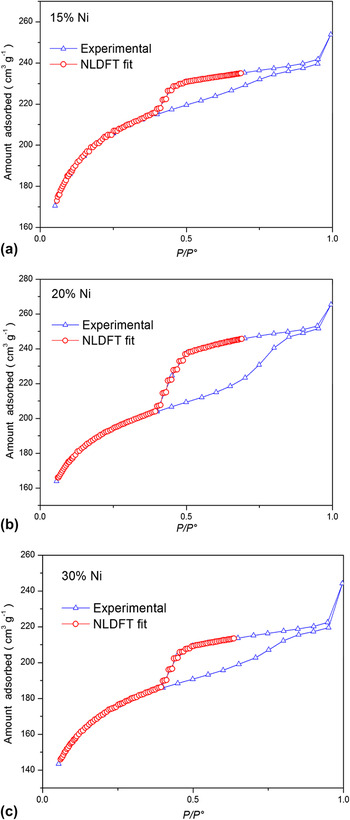
Figure 2 displays the Frenkel–Halsey–Hill fractal analysis of the adsorption–desorption isotherms of the Ni/C catalysts annealed at 773 K, and Fig. 3 shows their loops of adsorption–desorption isotherms. The specific surface areas of the Ni/C samples are reported in Table II. It can be seen that the addition of nickel on carbon decreases slightly the BET specific surface area, from 614 m2/g for the sample 15 wt% Ni/C to 533 m2/g for the sample 30 wt% Ni/C. These results suggest that the intrawall pores and principal channels or micropores of these samples are blocked by nickel deposits, which are also supported by the facts that the values of intrawall volume diminished from 215 to 154 mm3/g and the micropore volume diminished from 190 to 141 mm3/g as the Ni loadings increased from 15 to 30 wt%.
Frenkel–Halsey–Hill fractal analysis of the adsorption–desorption isotherms of Ni/C catalysts as a function of the Ni content. (a) 15 wt% Ni, (b) 20 wt% Ni, and (c) 30 wt% Ni.

Comparison of the experimental nitrogen desorption isotherm on Ni/C catalysts with the NLDFT isotherm in a slit pore as a function of the Ni content. (a) 15 wt% Ni, (b) 20 wt% Ni, and (c) 30 wt% Ni.

Pore structure parameters for Ni/C catalysts.

S BET was calculated using the molecular cross-sectional area of N2, 0.162 nm2 per molecule.
S NLDFT was obtained by the NLDFT from the desorption branch.
 $V_{\rm{P}}^{{\rm{NLDFT}}}$
: total pore volume;
 $D_{\rm{P}}^{{\rm{NLDFT}}}$
: pore diameter taken from the maximum of the PSD curve. For samples with bi-modal PSDs, two values are given;
 $V_{{\rm{iw}}}^{{\rm{NLDFT}}}$
: volume of the intrawall; V
Mi: micropore volume determinated by the t-method; Ds: surface fractal dimension.
The numbers in parentheses correspond to the standard deviation.
By comparing Tables II and III, we may suggest that an important fraction of the surface areas reported in Table II is the contact area between N2 and Ni crystals. We can note that the sample with the lowest nickel content shows the smallest crystallite size, and the sample with the highest nickel content shows the biggest crystallite size; nevertheless, there are not remarkable differences among the values of the surface areas. Therefore, the facts mentioned above allow us to infer that between the exposed surface area of Ni crystallites and the crystallite sizes, there is an approximately constant ratio (in the range of 15–30 wt% Ni).
Rietveld refinement data and photoactivity of the Ni/C catalysts.

The numbers in parentheses correspond to the standard deviation.
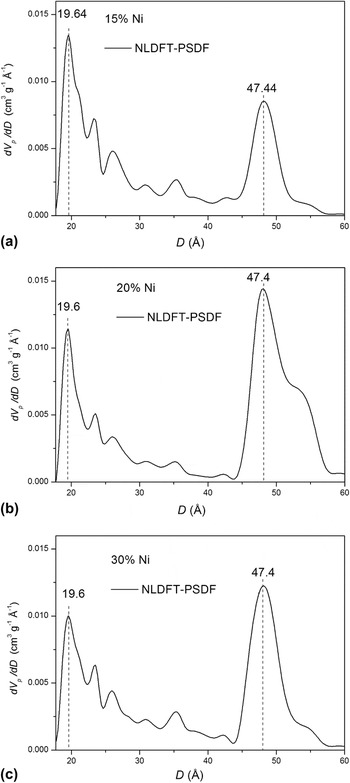
On the other hand, the calculated average value of the fractal dimension is 2.9, which seems to be too high because the regular values of fractal dimension should be between 2.0 and 3.0. This result indicates that the surfaces of the Ni/C materials are too rough. These results are characteristic of materials with high porosity and/or microporosity. Therefore, the Ni/C materials possess high capacity of adsorption, and hence, their D s values are less sensitive to high nickel contents. Figure 4 shows PSDFs for the samples with 15, 20, and 30% of nickel deposits. These materials have a bimodal pores system (1.96 and 4.74 nm of diameter); however, the profiles of pore diameter distribution were not significantly varied with the nickel content. These data are in good agreement with the D s values reported above.
Pore size distribution of Ni/C catalysts as a function of the Ni content, calculated from the NLDFT model using desorption isotherms. (a) 15 wt% Ni, (b) 20 wt% Ni, and (c) 30 wt% Ni.

B. UV-vis absorption spectra
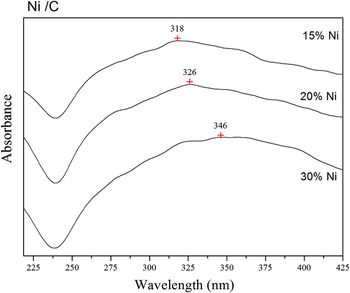
UV diffuse adsorption spectra for Ni/C catalysts as a function of the nickel content are displayed in Fig. 5. Zhang et al. Reference Zhang, Dragan and Geddes29 reported that the wave length of the absorption band for nickel surface plasmon is a function of the particle size. Plasmons are collective oscillations of the free electron gas density at optical frequencies. The plasmons can couple with a photon to create another quasiparticle. Reference Shuwen, Xia, Wing-Cheung, Yating, Rui, Xuan-Quyen, Ho-Pui and Yonga30 Taking into account the mentioned above, the possibility of finding surface plasmons that resemble those arising from NiO structures within the induction period may not be discarded. However, NiO crystals formed at the end of the reaction is not feasible because Comerta and Pratt Reference Comerta and Pratt31 have reported that the standard molar Gibbs free energy of formation of NiO is within the temperature range 760–1275 K. In this paper, the photodehydrogenation of ethanol is carried out under mild conditions of temperature and pH (298 K and pH ≈ 7).
UV-vis spectra for Ni/C catalysts.

The maximum of the surface plasmon resonance is around 318, 326, and 346 nm, corresponding to deposits of 15, 20, and 30 wt% Ni, respectively. Moreover, Table III shows nickel particle sizes of 5.1, 19.7, and 31.4 nm for 15, 20, and 30 wt% Ni content, respectively. Thus, a particle size effect on Ni surface plasmon resonance can be clearly observed. When Ni content increases, the width of the absorption spectra increases, similar to the results reported by Zhang et al. Reference Zhang, Dragan and Geddes29 This correlation shows that the surface plasmon resonance of metallic Ni nanoparticles is sensitive to the particle size.
C. XRD and Rietveld refinement
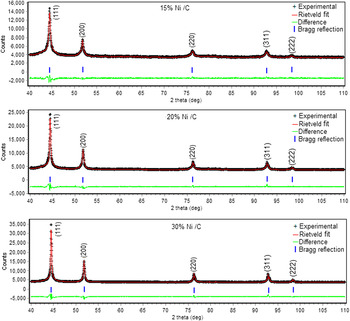
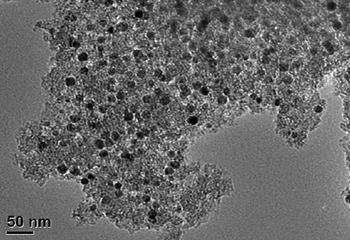
Figure 6 displays XRD patterns and Rietveld fits for the Ni/C materials. Five peaks corresponding to Bragg reflection planes of nickel crystallites were observed. Figure 7 shows the TEM image of catalysts containing 30 wt% Ni. Ni particle diameter ranges are within 5 and 30 nm, most of them are between 20 and 30 nm. TEM observations agree with Rietveld refinement results reported in Table III. There are many Ni atoms close to each other, so that their valence orbitals overlap producing a larger metallic network. This fact is justified by the band model of the metal-binding theory.
Rietveld plot of the Ni/C catalysts (weighted profile R-factor, Rwp = 2.8, 2.2, and 2.3 for 15, 20, and 30 wt% Ni respectively). In the upper curve crosses correspond to the experimental data and the continuous line corresponds to those calculated; the lower curve is the difference of both data. The tick marks correspond to nickel structure according is indicated in the figure. The numbers in parenthesis corresponds to different reflection planes (hkl) of the crystalline structures.

TEM image of catalysts containing 30 wt% Ni.

Important differences related to the symmetry properties (occupancy values) in the nickel nanostructures in the three Ni/C materials under study were found. The occupancy values are reported in Table IV. Differences between occupancies mean point defects in nickel crystallites, i.e., nickel deficiencies and/or vacancies in its lattice. It must be noted that if the nickel vacancies were produced by displacing some lattice atoms, the atoms released are either trapped within the lattice or are moved out to the surface to form new crystal layers (Schottky defect). Reference Agullo-López, Catlow and Townsend32 Otherwise, if nickel atoms were not confined to the nearest-neighbor shell of nickel atoms, the disturbance could perturb several lattice sites. The point defects can be Frenkel or Schottky. A Frenkel defect is when the displaced nickel atom is retained in the interior of the crystal at an interstitial site. In many cases, the vacancy–interstitial Frenkel pair is well separated, and the annealing stage may lead to alternative reaction with other interstitials, impurity atoms, or extended defects. It should be noted that as a consequence of the vacancies formed, new interstitial structures and more complexes can be developed. The three simplest interstitial sites are: at the interstices of normal lattice sites, as a pair of nickel atoms sharing a single lattice site, and as an additional nickel atom inserted into a row of atoms. Reference Agullo-López, Catlow and Townsend32,Reference Schultz, Takamura, Doyama and Kiritani33 The samples with 20 and 30 wt% Ni content, their occupancy values are very similar to each other (Table IV) and could mean that some atoms are out of their regular positions in the nickel structures, and hence, these could be forming Frenkel defects. Reference Agullo-López, Catlow and Townsend32 It is important to note that vacancies of nickel do not mean empty sites in the nickel lattice because these vacancies could be occupied by other atoms. In this case, it could be C atoms.
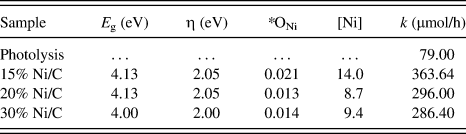
E g, η, occupancies and photoactivity of the Ni/C catalysts.

E g: band gap energy; η: molecular hardness; *refined occupancies; [Ni]: whole nickel atoms per unit cell. These Ni atoms correspond to the refined occupancies ONi; k: kinetic constant.
Other related differences now with the lattice parameter a in the nickel nanostructures in the three Ni/C materials were found. The refined lattice parameter a is different within the three samples under study (see Table III). This can be a consequence of point defects in Ni nanostructures. Something from this was already discussed above. To explain this, we will advance two hypotheses that will be justified after discussing RDF results: (i) observing Table III and reflection picks in Fig. 6, the point defects may be localized on the perimeter refection plane (111); (ii) additionally, changes in the lattice parameter a shown in Table III can be due to displacements of some nickel atoms onto the lattice surface (Schottky defect).
Considering that the unit cell FCC has dimensions a = b = c, the reflection plane area (111) will be related with a as follows:
 $${\rm{Reflection\,\,plane\,\,area}} = {a^2}\sqrt 2 \quad.$$
From the last equation, the results reported in Table III and Fig. 8, we can suggest the possible displacement of Ni atoms along of the perimeter of the reflection plane (111). Moreover, Johnson Reference Johnson34 considers six possible configurations for atoms occluded interstitially in a FCC lattice such as (A) octahedral, (B) tetrahedral, (C) crowdion, (D) (100) split, (E) (111) split, and (F) (110) split. These configurations can also generate point defects by changes in positions of nickel atoms in nickel structures.
Nickel crystal lattice: FCC with a = 3.5238 Å, ρ = 8.902 g/cm3 and Wyckoff site: 4a (Fm3m). The theoretical distances correspond to a nickel structure without point defects.

D. Radial distribution function
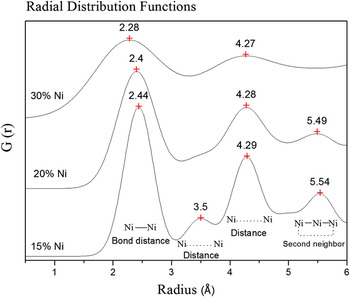
RDFs obtained from XRD for Ni/C materials at different nickel contents are displayed in Fig. 9. Each interatomic distance localized by XRD between two Ni atoms contained within the nickel structures is being represented by one peak in one RDF. Hence, all peaks in each RDF are all possible interatomic distances between the Ni atoms included into the nickel structures of each Ni/C sample under study. Theoretical distances between Ni atoms for a unit cell without point defects are reported in Table V.
RDFs obtained by XRD for Ni/C catalysts as a function of Ni content.

RDF peaks of Ni structures for Ni/C catalysts as a function of Ni content.

a Theoretical distances.
b Obtained by XRD analysis.
Comparing picks of the interatomic distances taken from RDFs and theoretical values with each other (see Fig. 9 and Table V), absence of peaks corresponding to first neighbors (3.5 Å) in samples prepared at 20 and 30 wt% Ni was the first thing noticed. Taking into account the Ni structures displayed in Fig. 8 and the missing peaks, we could suggest point defects in the midpoints of the line segments of the perimeter of the plane of reflection (111).
Regarding second neighbors, the interatomic distances shown in Fig. 9 and Table V for samples prepared at 15 and 20 wt% Ni are higher than theoretical values, which could correspond to the vertexes of the reflection plane (111) at shown in Fig. 8, and this could be either associated Frenkel or Schottky defects. For the sample prepared with 30 wt% Ni, the distance between the second neighbors is absent. Elsewhere, using the refined lattice parameter a (Table III) and also considering the reflection plane area equation, we can deduce that the reflection plane areas (111) are in the following order:
 $$S_{(111)}^{15{\rm{wt\% Ni}}} > S_{(111)}^{20{\rm{wt\% Ni}}} > S_{(111)}^{30{\rm{wt\% Ni}}}\quad .$$
This result implies that the sample prepared at 15 wt% Ni must have the biggest surface area measured by N2 sorption. Table II shows the following order:
 $$S_{{\rm{BET}}}^{15{\rm{wt\% Ni}}} > S_{{\rm{BET}}}^{{\rm{20wt\% Ni}}} > S_{{\rm{BET}}}^{{\rm{30wt\% Ni}}}\quad .$$
Hence, the reflection plane areas measured by Rietveld refinement and surface areas measured by N2 sorption agree each other, and at the same time, these agree with the RDF results.
After comparing the crystallite sizes and occupancies reported in Tables III and IV, one can note that if the crystallite size decreases, the occupancy values increase as a function of the Ni content. In view that the crystallite sizes for 15 wt% Ni are smaller than other contents, it appears that the Ni atoms are more ordered in these nickel nanostructures.
Therefore, the nickel content plays an important role in the generation of point defects, and at higher nickel nitrate content, there is a greater probability to obtain a greater amount of nickel particles forming agglomerations during the thermal treatment.
E. Electron density maps of Fourier
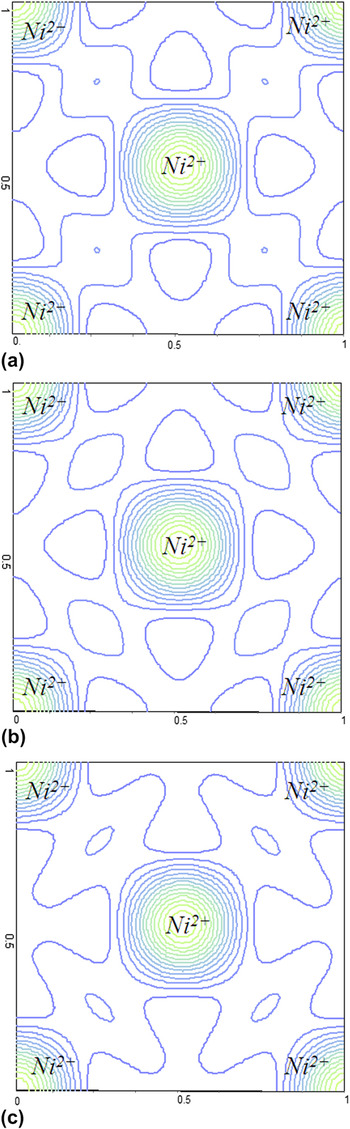
The metal nickel atoms have few electrons in its last layer, and then they can easily lose these electrons and become positive ions. The positive ions are arranged in space forming a metal network and the valence electrons detached from atoms form a cloud of electrons that can move across the network. Thus, the whole of the positive ions of the metal is attached through the cloud electrons that are surrounding them. This fact can be seen by electron density maps obtained from XRD data. In the base plane (face ab normalized to 1), the electron density distributions around the nickel structure of the Ni/C catalysts are shown in Fig. 10. The number of contours in the electron density maps gives the relative electron concentration. In Fig. 10, the valleys are represented by few contour lines that at the same time represent distances between the central atom and the atoms placed in the vertexes of nickel lattice (see also Fig. 8). Reference Agullo-López, Catlow and Townsend32,Reference Kittel35 Differences among the contours of the valleys shown in Fig. 10 are shifts of distances between the nickel atom neighbors as a function of the nickel content. As compared with the results obtained from RDFs (Fig. 9), we may conclude that the amount of nickel deposited on carbon greatly influences the structural properties of Ni/C catalysts.
Electron density maps obtained by XRD for Ni/C catalysts: (a) 15%, (b) 20%, and (c) 30% Ni content, respectively.

F. Catalytic activity
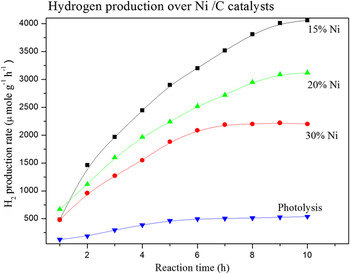
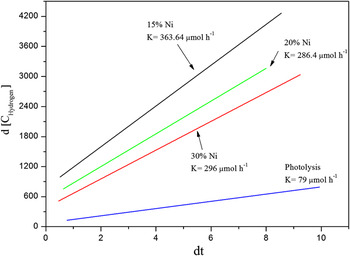
The activities of the Ni/C catalysts were evaluated in the hydrogen production from ethanol photodecomposition at room temperature. The evolution of the hydrogen produced as a function of time is shown in Fig. 11. From the data of the curves, the apparent rate constant k was calculated by the differential method for an irreversible unimolecular-type zero-order reaction Reference Levenspiel36 :
 $$ - {r_A} = - {{{\rm{d}}{C_{\rm{A}}}} \over {{\rm{d}}t}} = k\quad ,$$
where C A is the concentration at time t, and k is the constant kinetic.
Hydrogen production rate as a function of the reaction time.

An acceptable linearity was obtained for 6 h of reaction by applying the zero-order kinetic equation (Fig. 12). The values calculated from selected slopes are reported in Table IV. A maximum constant rate, k = 363 μmol/h, was obtained for the sample with 15 wt% Ni. Regarding CO gas, it was also measured, however, at the end of 10 h, the concentration of CO gas was less than 90 µmol. Then, we decided not to report it.
Kinetic constant for the hydrogen production on Ni/C catalysts.

1. Photoactivity versus structural properties
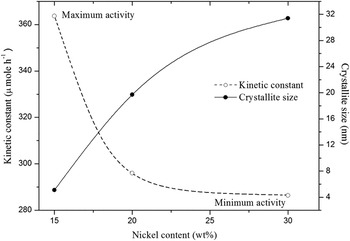
The nickel crystallite sizes calculated by Rietveld refinement (Table III) were plotted as a function of the nickel content and compared with the catalytic activity (Fig. 13), where the maximum activity was achieved by 15% Ni/C catalyst, which has the smallest crystallite size among the three Ni/C catalysts.
Kinetic constant and crystallite size as a function of nickel content.

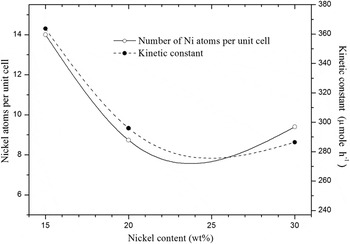
To understand these last results and their relationship with the structural properties of the Ni/C catalysts, the whole atoms corresponding to the refined occupancies (compare Figs. 1 and 8) were calculated. These were displayed with the catalytic activity as a function of the nickel content in Fig. 14.
Whole Ni atoms per unit cell and kinetic constant as a function of nickel content.

The results shown in Figs. 13 and 14 confirm that the crystallite size of nickel nanoparticles and the number of whole nickel atoms per unit cell in Ni nanostructures are the main factors affecting the catalytic activity.
On the one hand, both the band gap energy and the molecular hardness values shown in Table IV are the same for all the samples. That is, the resistance to charge transfer is the same for all samples under study. It appears that kinetic constants depend on occupancy values as it was pointed out before.
2. Photodehydrogenation of ethanol/water solution using Ni/C catalysts
The global molecular properties (ΔE, χ, η, and E g) for ethanol–water and ethanol–ethanol systems were obtained by theoretical calculations (DFT/GGA/PBE) and are reported in Table VI. We can note the following: (i) ethanol molecules and water are less close to each other, (ii) for the ethanol–water system, the tendency to attract electrons to itself is larger than the ethanol–ethanol system, (iii) given that the ethanol–water system has the bigger molecular hardness, this is less reactive than the ethanol–ethanol system, and (iv) water which is used as a solvent increases the band gap energies of all systems.
Global molecular properties obtained by DFT/GGA/PBE for ethanol–water and ethanol–ethanol systems.

ΔE: interaction energy; χ: electronegativity; η: molecular hardness; and E g: band gap energy.
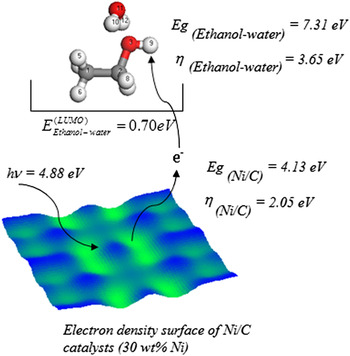
The photodehydrogenation of ethanol starts with the nucleophilic attack from Ni/C catalysts to hydrogen (site 9) and was determined by theoretical calculations DFT/GGA/PBE as reported in Table VII.
Nucleophilic attack obtained by DFT/GGA/PBE for ethanol–water and ethanol–ethanol systems.

a See Fig. 15.
b It is the highest trend of each system.
By comparing Tables IV, VI, and VII with each other, we can conclude that the light intensity of 254 nm (4.88 eV) by itself is not able to do the photodecomposition of ethanol; however, all results shown above allow us to suggest that the photodecomposition is carried out by a nucleophilic attack into the ethanol–water system (hydrogen site 9). The electrons involved in the transfer are from the conduction band of the Ni/C photocatalyst, and they enter into the lowest unoccupied molecular orbital (LUMO) of the ethanol–water system, as shown in Fig. 15.
Nucleophilic attack into the ethanol molecule (hydrogen site 9): electrons involved in the transfer are from the conduction band of the Ni/C photocatalyst, and they enter into the LUMO of the ethanol–water system.

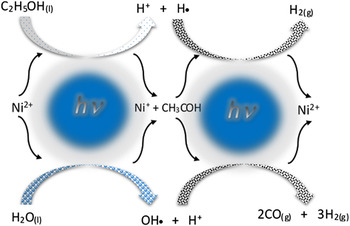
The photodehydrogenation of the ethanol/water solution is schematized in Fig. 16, and it is described as follows:
Photodehydrogenation of the ethanol/water solution over Ni/C photocatalysts.

First, two atoms of hydrogen are eliminated from C2H5OH(l) to form one acetaldehyde molecule (CH3COH) and one hydrogen molecule:
 $${\rm{(1) }}\;{{\rm{C}}_{\rm{2}}}{{\rm{H}}_{\rm{5}}}{\rm{O}}{{\rm{H}}_{{\rm{(}}l{\rm{)}}}} + {\rm{h\nu }} \to {\rm{ C}}{{\rm{H}}_{\rm{3}}}{\rm{CO}}{{\rm{H}}_{{\rm{(}}l{\rm{)}}}} + {{\rm{H}}_{{\rm{2(}}g{\rm{)}}}}\quad .$$
The formation of CH3CHO molecule as an intermediate was determined by DFT/GGA/PBE calculation, which agrees with Kawai's results, Reference Kawai, Kawai, Naito and Tamaru37 who found by HPLC that the reaction proceeds with intermediate formation of acetaldehyde.
Next, four atoms of hydrogen are eliminated from CH3COH(l) and two more from H2O(l) to form three hydrogen molecules:
 $${\rm{(2)\; C}}{{\rm{H}}_{\rm{3}}}{\rm{CO}}{{\rm{H}}_{{\rm{(}}l{\rm{)}}}} + {{\rm{H}}_{\rm{2}}}{{\rm{O}}_{{\rm{(}}l{\rm{)}}}} + {\rm{h\nu }} \to {\rm{2C}}{{\rm{O}}_{{\rm{(}}g{\rm{)}}}} + {\rm{3H}}{{\rm{2}}_{{\rm{(}}g{\rm{)}}}}\quad .$$
In summary,
 $${{\rm{C}}_{\rm{2}}}{{\rm{H}}_{\rm{5}}}{\rm{O}}{{\rm{H}}_{{\rm{(}}l{\rm{)}}}} + {{\rm{H}}_{\rm{2}}}{{\rm{O}}_{{\rm{(}}l{\rm{)}}}} + {\rm{h\nu }} \to {\rm{2C}}{{\rm{O}}_{{\rm{(}}g{\rm{)}}}} + {\rm{4}}{{\rm{H}}_{\rm{2}}}_{{\rm{(}}g{\rm{)}}}{\rm{, }}\Delta {{\rm{G}} \circ } = {\rm{191}}{\rm{.08}}\,{\rm{kJ/mol; }}\;\Delta {\rm{E}} = {\rm{1}}{\rm{.98}}\,{\rm{eV}}\quad {\rm{.}}$$
IV. CONCLUSIONS
The present study shows that increasing Ni content results in a decrease of the surface area, volume intrawall, and volume micropore but leads to an increase in crystallite size in the Ni/C catalysts. It is found that point defects are formed in the nickel structures during annealing, which vary with Ni content. In the sample with 15 wt% Ni, both the number of point defects in Ni structure and Ni crystallite size are the smallest compared to the other two catalysts with high Ni loadings. These important factors greatly affect the catalytic activity for the hydrogen production from the ethanol photodecomposition, which was confirmed by the reaction that showed sensibility to the crystallite size. A notable relationship between the hydrogen production activity, the crystallite size, and the number of nickel atoms per unit cell in the Ni structure was established.
ACKNOWLEDGMENTS
F. Galindo-Hernández thanks the financial support from CONACyT-51007 for his postdoctoral research in the Instituto Politecnico Nacional. The authors are grateful to Dr. Manuel Aguilar for his technical assistance in XRD analysis.