

BEYOND POST-APARTHEID POLITICS?
During the late 1980s and 1990s, democratisation spread across Sub-Saharan Africa. During this ‘second liberation’ (Cheeseman Reference Cheeseman2015: 86), multiparty elections replaced authoritarian and one-party regimes that emerged through mid-century decolonisation. In some instances, democratisation and political competition fuelled destabilisation, violence and ethnic conflict. The dismantling of apartheid in South Africa, including the introduction of fully democratic elections, paralleled the continental turn towards electoral democracy. Yet the context was very different, due to the recent defeat of white minority rule. For South Africa, democratisation in the 1990s was not the second liberation, but the first. In the immediate post-apartheid period, ‘nationalist sentiment’ helped to guard against the fragmentation and ethnic division experienced elsewhere (Cheeseman Reference Cheeseman2015: 189).
For some observers, the persistent domination of the African National Congress (ANC) – the party of Nelson Mandela and national liberation – represented the biggest threat to South Africa's post-apartheid democracy. Early into the democratic period, Giliomee & Simkins (Reference Giliomee and Simkins1999) described South Africa as a ‘dominant party’ regime. They defined such regimes as lacking the basic features of liberal democracy, in which ‘executive power is constrained, minority groups express their interests effectively, party competition is strong and electoral outcomes are uncertain with an alternation of ruling party constitution a real prospect’ (Giliomee & Simkins Reference Giliomee and Simkins1999: 3). In South Africa, they suggested, the unwavering loyalty of the black majority to the ANC left the ruling party unaccountable and prone to corruption.
Two decades into the post-apartheid period, commentators continued to express concern about the ANC's apparent immunity from defeat, and its relationship to government corruption, incompetence and authoritarianism (Everatt Reference Everatt2016). There was certainly some evidence to support these claims. The ANC won the first five national elections between 1994 and 2014, securing at least 60% of votes cast each time. The ruling party dominated within the black townships (Friedman Reference Friedman2015). Further, within this context of dominance, corruption, patronage and authoritarianism increasingly permeated the ANC (Lodge Reference Lodge2014; Duncan Reference Duncan2015; Southall Reference Southall2016). Yet the dominant party thesis has important limits. Crucially, it underestimates the ANC's organisational capacities. The ruling party developed a political machine with an impressive record of turning out voters, and consistently used its position within government to regenerate power (Booysen Reference Booysen2011; Southall Reference Southall2013; Butler Reference Butler, Schulz-Herzenberg and Southall2014). If the ANC benefitted from the legacy of national liberation, it worked hard to do so.
The dominant party thesis also underestimates the extent of recent ANC decline, which manifested with respect to electoral performance, organisational stability and popular resistance. After improving its performance at the polls during the first decade of democracy, the ANC suffered declining electoral support from the late 2000s. In terms of national government elections, ANC support dropped from 70% in 2004, to 66% in 2009 and 62% in 2014, just below the level where it began in 1994 (63%). Likewise, ANC support in local government elections dropped from 65% in 2006, to 62% in 2011 and 54% in 2016. Marking a new low, in 2016 the ANC failed to secure a majority in four key metropolitan municipalities – Johannesburg, Tshwane, Ekurhuleni and Nelson Mandela Bay – for the first time in the post-apartheid period. The above figures represent votes cast, but growing rates of abstention represented another worrying trend for the ANC. Poor citizens, a key constituency for the ruling party, were especially likely to abstain from voting (Everatt Reference Everatt2016).
Organisational splits, within both the ruling party and its allies, accompanied electoral decline. Supporters of former ANC president Thabo Mbeki, who Jacob Zuma ousted in 2007, founded a breakaway party, the Congress of the People (COPE), in 2008. COPE secured 7% of the vote in the 2009 national election, but declined quickly afterwards, managing less than 1% five years later. The Economic Freedom Fighters (EFF), founded in 2013 by expelled former leaders of the ANC Youth League, split the ruling party again. EFF secured 6% of the vote in the 2014 national elections, and 8% in the 2016 local elections. Following the Marikana massacre in 2012, during which police killed 34 striking mineworkers, the ANC also lost support from the two largest affiliates of its formal Alliance partner, the Congress of South African Trade Unions (COSATU). Tens of thousands of workers defected from the National Union of Mineworkers (NUM), while the National Union of Metalworkers South Africa (NUMSA) formally withdrew support from the ruling party.
Growing popular resistance, by the urban poor, workers and students, raised further questions about ANC dominance (Paret & Runciman Reference Paret and Runciman2016). Local protests by the urban poor accelerated from 2009, and focused on issues of public service delivery, most notably housing, electricity and water. Workplace strikes by both unionised and non-unionised workers proliferated during the same period, including massive strikes by public sector workers in 2007 and 2010, and by mineworkers in 2012 and 2014. Finally, a vibrant student movement emerged in 2015 and 2016, featuring prominent demands for free and ‘decolonised’ higher education. While the various forms of resistance did not always oppose the ANC directly, they frequently criticised the state and represented a potential threat to political stability.
These dynamics suggest a potential political shift. Noting the ANC's weakening grip, one commentator remarked that, ‘we are witnessing nothing less than the end of post-Apartheid politics’ (Grootes Reference Grootes2016). As the democratic transition of the early 1990s fades farther into history, the effectiveness of anti-apartheid nationalism may recede, giving way to increasing political competition. South Africa may become more like other African countries, where multiple decades separated recent democratic reform from prior episodes of national liberation. Intensifying ethnic division, and the reduction of elections to ‘ethnic censuses’ (Horowitz Reference Horowitz2000), represents one possibility. In post-independence Africa, evidence suggests that ethnic identification increased when party organisations were weak and patronage networks were strong (Cheeseman Reference Cheeseman2015: 184–5). Conversely, however, evidence also suggests that voters across Africa weigh government performance and service delivery alongside ethnic identity (Bratton et al. Reference Bratton, Mattes and Gyimah-Boadi2005: 304–8; Cheeseman Reference Cheeseman2015: 189–91). In a context of deepening political competition, how are South African voters choosing their party affiliations?
This article examines two surveys of South African voters, conducted during the 2014 national government elections and the 2016 local government elections. In contrast to most scholarship on South African elections, which relies heavily on aggregate results (Booysen Reference Booysen and Booysen2012; Friedman Reference Friedman2015; Schulz-Herzenberg Reference Schulz-Herzenberg2016), the two surveys provide a rare view into the decisions of individual voters. To my knowledge, they represent the only recent election-day exit polls of voters that asked about social background characteristics, protest activity and voting decisions. The two surveys also present a valuable opportunity to contrast voter decisions between national government and local government elections. A key limitation is that the surveys only covered a limited number of impoverished townships and informal shack settlements. While not nationally representative, though, they offer crucial insight into one of the ANC's historically most important constituencies: poor and working-class black residents. The surveys only include residents who cast a vote, and thus do not not offer any information about the important trend of voter abstention.
I pose two questions. First, what are the social profiles of voters for the ANC and opposition parties, most notably the recently formed ANC-breakaway party EFF? Consistent with the ethnic census model, the surveys reveal a close association between ethnic identities and voting decisions. Yet other identities, such as age and gender, also mattered. Further, beneficiaries of the welfare state were more likely to vote for the ANC, and different resources mattered during national versus local elections, demonstrating that voters paid close attention to government performance. As elsewhere in Africa, ethnic identity was important, but it offers only a partial explanation of voting patterns. Second, how do voting decisions relate to ongoing patterns of popular resistance? Examining three case studies of voting and protest – by mining communities in the Platinum Belt, residents of informal settlements in Johannesburg, and students in Johannesburg – I show that some protests failed to challenge, or even reinforced, ANC dominance, while others fed into oppositional forces. Challenging notions of uncontested one party dominance, the findings reveal that some poor black voters are critically evaluating the ANC's performance and developing oppositional political identities.
AN ELECTORAL LENS INTO SOUTH AFRICAN POLITICS
Recent literature on voting decisions underscores two prominent approaches. One approach emphasises party identification, or a sense of personal closeness and attachment that voters learn through family, participation in organisations and movements, or other socialisation processes (Goren Reference Goren2005). A second approach emphasises retrospective voting, in which voters make decisions based on perceptions of past performance and expectations of future performance (Healy & Malhotra Reference Healy and Malhotra2013). Whereas the ‘ethnic census’ model is consistent with the party identification approach, the retrospective voting approach accounts for evidence that African voters frequently base their decisions on government performance. Both factors matter in South Africa, and shed light into differences between elections at national and local levels.
Two decades after the democratic transition, the ANC continued to reap a significant ‘liberation dividend’ due to its role in overcoming apartheid. Appealing to an ongoing National Democratic Revolution, the ruling party portrayed itself as the only true heir of the anti-apartheid struggle. Likewise, the ANC portrayed its main competitor, the DA, as a party that protects white interests (Ferree Reference Ferree2010). While the DA countered by promoting black leadership, the image proved difficult to shed (Schulz-Herzenberg Reference Schulz-Herzenberg2016: 507). Not only could the EFF claim closer ties to the liberation movement, but the party's campaign rhetoric also emphasised race and especially economic freedom for the black majority. Competition between the ANC and the EFF refracted through generational divisions. Older voters were more likely to have memorable experiences of apartheid and the anti-apartheid struggle, and thus an emotional attachment to the ANC, while the EFF's younger leadership appealed to younger voters.
Aggregate results for local geographic areas, which largely remain racially homogeneous due to persistent racial segregation, show that race continues to correlate highly with voter decisions (Friedman Reference Friedman2015). Friedman argues that, within the black townships and shack settlements, this reflects local power dynamics rather than the ideological power of national liberation. A mixture of local and national dynamics may reproduce ethnic divisions as well. While Friedman (Reference Friedman2015: 143) usefully points out that apartheid manufactured and reproduced ethnic divisions as a tool of racial domination, he incorrectly assumes that this history necessarily stigmatises ethnic identity. President Jacob Zuma, known affectionately by some supporters as ‘100% Zulu boy’, reinvigorated ethnic identity and helped to shift the ANC towards a Zulu support base (Chipkin Reference Chipkin2016; Paret Reference Paret2016a). Likewise, EFF leader Malema identified with the Pedi ethnic group, and frequently addressed crowds with his mother tongue of Sepedi.
The historical legacy of national liberation may prove especially significant during national elections, when loyal voters ‘come home’ to the ANC. Conversely, research suggests that voters use ‘second-order elections’ – those perceived to be less consequential – to punish governing parties by strategically voting for opposition parties that they prefer less (Blais et al. Reference Blais, Nadeau, Gidengil and Nevitte2001; Koepke & Ringe Reference Koepke and Ringe2006). In South Africa's local government elections, voters may support opposition parties to punish the ANC or improve local government performance, without risk of hurting the ruling party nationally. Consistent with this idea, ANC support in the 2006 and 2011 local elections was 4–5 percentage points lower, and ANC support in the 2016 local elections was 8 percentage points lower, compared to prior national elections (in 2004, 2009 and 2014, respectively).
As apartheid has faded further into the past, perceptions and expectations of government performance may have grown more significant. Yet for some ANC supporters, party identification and retrospective voting went hand-in-hand, because the ruling party could ‘reinvest’ in its ‘symbolic political capital’ by making ‘material interventions into the lives of its core constituency so as to sustain the potency of its nationalist liberation discourses’ (Beresford Reference Beresford2012: 884). Different levels of government provided different benefits. The central government, for example, disbursed the popular social grants – such as the Child Support Grant and the Older Persons Grant – that reached nearly one-third of the total population. Conversely, local government played a large role in ‘service delivery’ issues such as housing, water and electricity. Different provisions, therefore, may have been especially relevant during either national government or local government elections.
Whereas the ANC claimed responsibility for the welfare state, opposition parties sought to leverage growing concerns about corruption and poor governance. The scandals surrounding President Jacob Zuma – especially the use of public funds for upgrades to his personal homestead in Nkandla, and his close ties to the Gupta business family – provided ample ammunition. These national scandals were most relevant during national elections, but they may have also influenced local elections (Schulz-Herzenberg Reference Schulz-Herzenberg2016: 504–6). Concerns about corruption also influenced perceptions of local government. In terms of housing, for example, residents commonly viewed the local state as both ‘responsible for delivery’, and plagued by ‘a lack of capacity and coordination and pervasive corruption’ (Tomlinson Reference Tomlinson2011: 419).
Gender likely shaped both party identification and retrospective voting. Whereas the DA's liberal policies were consistent with ideas of gender equality, to a certain extent the ANC paid greater attention to women's rights as a political issue. Yet ANC leader Jacob Zuma, as well as ANC-turned-EFF leader Julius Malema, historically rejected liberal notions of gender equality, asserting instead ‘a single, virtuous, independent, heterosexual, anti-Western African masculinity’ (Morrell et al. Reference Morrell, Jewkes and Lindegger2012: 24). The EFF's military command structure also presented a masculinist image, and Gouws (Reference Gouws, Schulz-Herzenberg and Southall2014: 122) suggests that some women felt uncomfortable with the party's ‘chauvinism and bravado’. At a deeper level, in the context of widespread unemployment and poverty, women acted as ‘shock absorbers’ in the ‘crisis of social reproduction’ by providing unpaid labour within households (Fakier & Cock Reference Fakier and Cock2009; see also Mosoetsa Reference Mosoetsa2011). For this reason, poor women may have prioritised basic resources and therefore evaluations of government ‘service delivery’.
While perceptions of poor governance underpinned popular resistance, the precise relationship between voting and protest was unclear and varied across localities (Schulz-Herzenberg Reference Schulz-Herzenberg2016: 505). Some scholars found that local community protests went hand-in-hand with ANC votes (Booysen Reference Booysen and Booysen2012), while others found that such protests reinforced opposition (Alexander Reference Alexander, Dawson and Sinwell2012). In terms of worker resistance, mineworker protests in the Platinum Belt reinforced hostility towards the ANC (Sinwell & Mbatha Reference Sinwell and Mbatha2016), while worker protests associated with the ANC-aligned COSATU likely had the opposite effect. Student protests wavered between vigilant abstention from party politics and association with politically aligned student organisations. The various protests also focused on different levels of government. Whereas community protests prioritised engagement with local government, worker and student protests emphasised national level policies around labour and higher education funding.
TWO ELECTION SURVEYS
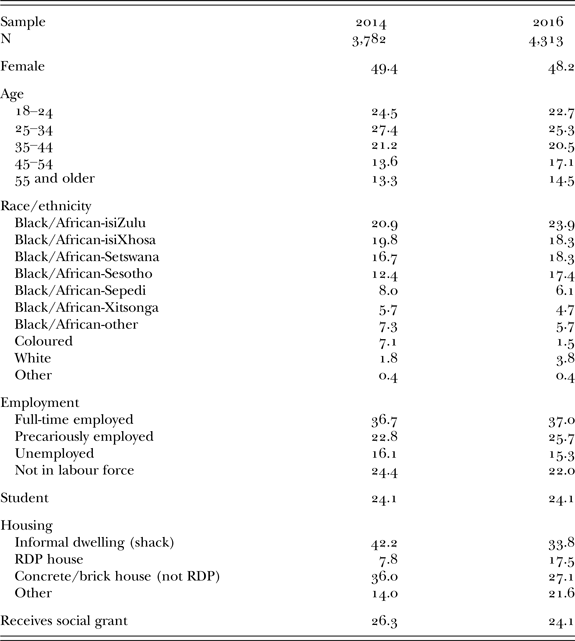
This study is based on two exit surveys of voters, conducted by the Centre for Social Change at the University of Johannesburg, on the days of the 2014 national government election (7 May) and the 2016 local government election (3 August). In both surveys, fieldworkers recruited respondents outside voting stations after they cast their votes. The 2014 survey yielded 3,782 respondents, and the 2016 survey yielded 4,313 respondents, for a combined sample of 8,095.
The surveys were not nationally representative, but rather focused primarily on urban, poor and working-class, and predominantly black townships and informal settlements. All of the sites were within a two-hour drive from Johannesburg. The 2014 survey covered 15 sites, including 11 in Gauteng province (Thembelihle, Motsoaledi, Brixton, University of Johannesburg, Alexandra, Bekkersdal, KwaThema, Noordgesig, Dube hostel, Diepkloof extension), three in North West province (Platinum Belt, Potchefstroom and Bokfontein), and one in Free State province (Zamdela). The 2016 survey returned to eight of these sites (Thembelihle, Motsoaledi, Brixton, University of Johannesburg, Alexandra, Platinum Belt, Potchefstroom, Zamdela) and also added three new sites, including two in Gauteng (Freedom Park, Hammanskraal) and one in Mpumalanga (Balfour).
The key variables of race and housing illustrate the particularity of the sample. According to the 2011 Census, 77% of South African residents were black/African and 14% lived in informal dwellings or shacks. In the combined survey sample, however, 93% of respondents were black/African and 38% lived in shacks. The proportion of Coloured respondents is higher in the 2014 sample (7%) due to the inclusion of Noordgesig, a predominantly Coloured township in Soweto, which was not included in the 2016 survey. The vast majority of white and other race voters participated in the Brixton, University of Johannesburg and Potchefstroom sites. In Potchefstroom, the survey team alternated between the city centre and the nearby informal settlement. These same three sites also accounted for the majority of student respondents, including 64% in 2014 and 70% in 2016. In both surveys, students represented nearly one-quarter of the entire sample.
Employment status is based on three questions with a skip sequence: (1) ‘Do you have full-time employment?’; (2) if no, ‘In the last month, did you do any temporary, casual, part-time, or ‘piece’ jobs for pay?’; (3) if no, ‘Would you have liked to work last month?’ I classified respondents answering ‘yes’ to #1, #2 and #3, respectively, as full-time employed, precariously employed and unemployed. I classified respondents who answered ‘no’ to all three questions, as well as students and those aged 65 or older who answered ‘no’ to #1 and #2, as not in the labour force. In both surveys, roughly one-in-five respondents classified as in the labour force were unemployed. Approximately one-quarter of respondents in each survey received a social grant (Table I).
Proportion of survey respondents with selected characteristics, 2014 and 2016.

Source: Centre for Social Change Election Surveys, 2014 and 2016.
In addition to focusing on low-income, urban black areas, the surveys also concentrated on areas with recent histories of protest. The 2014 survey asked whether respondents had participated in either a community protest/strike or a worker protest/strike, and the 2016 survey added to these a question about participation in a student protest/strike. In all sites except for two, at least one-quarter of respondents had participated in at least one form of protest (Table II). The two exceptions were Diepkloof extension, a middle-class area in Soweto where protests were not common, and Alexanda, where participation in both community and worker protests was just below the 25% mark. Most of the sites were prominent areas of community protest. Half of the respondents in the Platinum Belt had participated in a worker protest, reflecting the recent wave of mineworker resistance. Likewise, close to one-third or more of the respondents in Potchefstroom (32%), Brixton (32%) and the University of Johannesburg (56%) had participated in the recent surge of student protests.
Proportion of survey respondents participating in protests, by site.

Source: Centre for Social Change Election Surveys, 2014 and 2016.
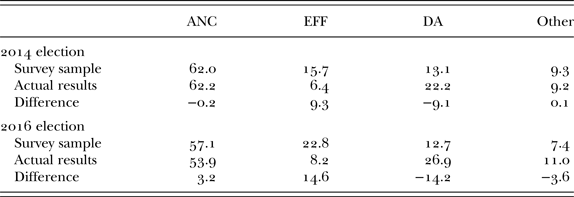
The key dependent variable in the analysis is the respondents’ voting decision. The 2014 survey asked respondents which party they voted for in the national election, and the 2016 survey asked respondents which party they voted for on both the ward councillor ballot and the proportional representation ballot. For the latter survey, 96% of respondents chose the same party on both ballots. I focus here on the proportional representation ballot. Among those who indicated their voting decision, the proportion of voters within the survey samples who voted for the ANC matched national results closely. Yet the surveys over-sampled EFF voters and under-sampled DA voters, relative to national results, representing the relative strengths of these parties within the impoverished black urban areas (Table III). At the ward level, the 2016 survey results differed from actual results by 0–17 points, depending on the specific ward and party (see Paret Reference Paret2016a and Reference Paret2016b for further methodological details).
Proportion of votes for major parties: actual election results versus survey sample results, 2014 and 2016.

Source: Centre for Social Change Election Surveys, 2014 and 2016; Electoral Commission of South Africa (http://www.elections.org.za/content/default.aspx/).
One potential source of bias was the fact that 23% of voters across the two surveys – 20% in 2014 and 25% in 2016 – refused to indicate their voting decision. Such refusal may have reflected intimidation by party agents outside the voting stations, or respondents’ general fear or discomfort about sharing their decision. Both factors likely contributed to suppression of reported non-ANC votes. Not only did the ANC have significantly greater presence at most of the surveyed voting stations, but it was also the dominant party in the surrounding areas. Separate multivariate analyses reveal that women and older voters, who were both more likely to vote for the ANC, were more likely to refuse to answer the voting question in both surveys. To the extent that these voters were afraid to disclose a non-ANC vote, the results may be biased. In contrast, non-black/African, Setswana-speaking, and non-student respondents, as well as those not living in RDP housing and not receiving a social grant – all groups that were less likely to vote for the ANC – were more likely to refuse to answer the voting question in the 2014 survey. To the extent that voters were afraid to disclose a non-ANC vote, the results may underestimate the potential influence of these variables.
To better understand how support for political parties varied according to social background characteristics, I estimated two separate multinomial logit regression models (MNLM), including one each for the two different surveys. The MNLM is a variation of the typical logit model that allows for multiple, discrete, non-ordered outcomes. In this case, the outcomes pertained to the political party receiving the respondent's vote, including four different possibilities: (1) ANC; (2) EFF; (3) DA; and (4) all other parties (OTH). The MNLM simultaneously estimates three different models, one for each of the outcomes other than the base category, which in this case is an ANC vote:
 $${\rm ln} \left[ {{\rm P}\left( {{\rm EFF \vert x}} \right){\rm / P}\left( {{\rm ANC \vert x}} \right){\rm}} \right]= {\rm b}_{{\rm 1}{\rm. 0}}\;+ {\rm b}_{{\rm 1}{\rm. 1}}{\rm x}_{\rm 1}+ {\rm b}_{{\rm 1}{\rm. 2}}{\rm x}_{\rm 2}+ {\rm \ldots + \varepsilon} \eqno(1)$$
 $${\rm ln} \left[ {{\rm P}\left( {{\rm DA\; \vert x}} \right){\rm / P}\left( {{\rm ANC \vert x}} \right){\rm}} \right]= {\rm b}_{{\rm 2}{\rm. 0}}+ {\rm b}_{{\rm 2}{\rm. 1}}{\rm x}_{\rm 1}+ {\rm b}_{{\rm 2}{\rm. 2}}{\rm x}_{\rm 2}+ {\rm \ldots + \varepsilon} \eqno(2)$$
 $${\rm ln} \left[ {{\rm P}\left( {{\rm OTH \vert x}} \right){\rm / P}\left( {{\rm ANC \vert x}} \right){\rm}} \right]= {\rm b}_{{\rm 3}{\rm. 0}}+ {\rm b}_{{\rm 3}{\rm. 1}}{\rm x}_{\rm 1}+ {\rm b}_{{\rm 3}{\rm. 2}}{\rm x}_{\rm 2}+ {\rm \ldots + \varepsilon} \eqno(3)$$
These models estimated the effect of each independent variable on the log-odds (‘logit’) of voting for one of the opposition parties, rather than the ANC. Each model included the same set of independent variables (x1, x2, x3, etc.), but the coefficients (b) varied across models. Thus, the effect of variable x1 on the odds of voting for the EFF rather than the ANC (b1.1) was different from the effect of variable x1 on the odds of voting for the DA rather than the ANC (b2.1). The independent variables included dummy variables for gender, age, race/ethnicity, employment and student status, housing, receipt of a social grant, and each of the field sites.
I ran the models twice, first using the full sample and second using only ‘repeat’ sites surveyed in both 2014 and 2016. I present the results for the full sample below, but note instances where the results for only the repeat sites were substantively different. The analysis below presents expected probabilities, which indicate the likelihood that a hypothetical voter would vote for each of the different parties. Given the small sample sizes for non-black/African respondents, I focus on expected probabilities for black/African respondents. I calculated the probabilities by varying focal variables (e.g. gender, age, etc.), while setting the remainder of the independent variables at their mean. The figures demonstrate the substantive effects of each variable, among black/African respondents, after controlling for the effects of other variables.
SOUTH AFRICA'S POLITICAL CLEAVAGES
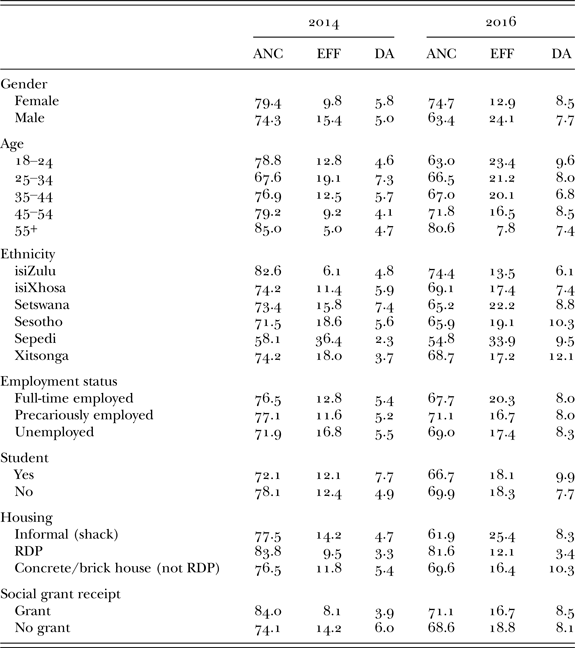
The results point to two overarching findings (Table IV). First, crucial cleavages, with respect to gender, age, ethnicity, housing and social grant receipt, underpinned South Africa's intensifying party competition. Second, these cleavages operated differently during national and local elections. This suggests that voters may be acting very deliberately by carefully considering government operations and the political consequences of their votes.
Expected voting probabilities, black/African respondents, 2014 and 2016.

Source: Centre for Social Change Election Surveys, 2014 and 2016.
Gender was significant during both elections, with women more likely to vote for the ANC and less likely to vote for the EFF. Yet the 2016 local elections produced an especially pronounced gender difference. Whereas the probability of a vote for the ANC or EFF differed between male and female respondents by 5–6 percentage points in the 2014 survey, the difference was more than 11 percentage points in the 2016 survey. We must treat these findings as tentative, given that women were more likely than men to refuse the voting question. Yet they are consistent with the idea that women, as the primary ‘shock absorbers’ of economic insecurity, firstly view the ANC as more reliable in terms of providing crucial resources, and secondly view the local state as a key vehicle through which such provision occurs.
Age also mattered. In general, the ANC performed better and the EFF performed worse among older voters in both elections, while votes for the DA did not vary dramatically by age. Older voters were more likely to refuse to answer the voting question, but the strength of the pattern suggests that the age effect did not stem primarily from refusal-related bias. The age results for 2016 followed a mostly linear trend, with ANC support jumping and EFF support declining especially among the eldest age group aged 55 and older. The 2014 results were slightly less straightforward. Both the EFF and the DA secured the greatest support from the 25–34 year-old group, rather than the youngest voters, while the probability of an ANC vote was similar for 18–24 year-olds and 45–54 year-olds (note: if only repeat sites are included, the DA secured its greatest support from the 55+ group). This result points towards important family socialisation processes among younger voters, which may kick in especially during national elections when the ruling party must defend its hold on the central government.
Ethnic differences among black/African respondents, defined by mother tongue, were highly associated with voting decisions. The ANC secured its greatest support from isiZulu speakers, while Sepedi speakers were especially likely to vote for the EFF. The expected probability of an ANC or EFF vote differed between Zulu and Pedi respondents by 25–30 points in 2014, and by 20 points in 2016. These are dramatic differences, suggesting that ethnic differences played a key role in voting decisions. It is also worth noting that respondents in the Platinum Belt, where the Marikana massacre took place in 2012, substantially shaped the expected voting probabilities for isiXhosa speakers. Of the 34 workers killed, most if not all were likely Xhosa. Excluding the Platinum Belt site, the predicted gap between isiZulu and isiXhosa speakers remains relatively stable in 2014, but disappears in 2016.
Given both the high unemployment rate and the centrality of jobs to political campaigns – in 2014, for example, the DA promised to create 6 million new jobs – one might expect employment status to be crucial for elections. Yet employment status had a relatively minor influence on voting decisions. Unemployed respondents were slightly more likely than full-time employed and precariously employed respondents to vote for the EFF in the 2014 election, but not in the 2016 election. While the context of widespread economic insecurity certainly mattered a great deal, these results suggest that employment was not central, at least not directly, to the emergent battle between the ANC and the EFF within the black townships and informal settlements. They may also reflect waning support for the EFF among unemployed voters between 2014 and 2016. Student status had a similarly limited influence. Students were slightly less likely than non-students to vote for the ANC, by 6 percentage points, and slightly more likely to vote for the DA, by 3 percentage points, in the 2014 election. Student status did not have a statistically significant association with voting decisions in the 2016 election.
In contrast to employment and student status, access to publicly provided resources was crucial in both local elections, though different resources proved to be especially consequential during national versus local elections. Receipt of a social grant was especially consequential in the 2014 national election. The probability of an ANC vote was 10 percentage points higher for recipients of a social grant, compared with those not receiving a grant, while the probability of an EFF vote was 6 points lower. In contrast, there was not a statistically significant relationship between receipt of a social grant and voting decision in the 2016 local election (note: if only repeat sites are included, grant recipients were slightly more likely than non-recipients to vote for the DA in 2016).
A converse story held for housing. The type of housing mattered for voting decisions in both elections, but was especially consequential in the 2016 local election. In the 2014 election, the probability of an ANC vote was 7 percentage points higher for respondents who were living in a state-provided ‘RDP’ house, compared with those living in a shack, while the probability of an EFF vote was 4 percentage points lower. The gap expanded dramatically in the 2016 election: the probability of an ANC vote was more than 20 percentage points higher for respondents living in an RDP house than it was for respondents living in a shack, while the probability of an EFF vote was 13 points lower. The differences were even more dramatic when considering only the repeat sites, surveyed in both 2014 and 2016. For these sites only, the expected probability of an ANC vote was 10 percentage points higher for RDP dwellers compared with shack dwellers in 2014, and a whopping 34 percentage points higher in 2016.
These findings regarding social grants and housing suggest that voters used elections to either reward or punish the ruling party for its performance in government, depending on whether or not they benefitted personally from the welfare state. Recipients of social grants and RDP houses rewarded the ANC at the polls, while those who did not receive those benefits punished the ANC by voting for the opposition and especially the EFF. Further, the differences between the two elections suggest that voters paid close attention to the operations of government agencies, and that they considered such observations when voting. Social grants, distributed by the national government, were most crucial during the national election, while housing, a key responsibility of local government, was especially crucial during the local election.
Within the impoverished black townships and informal settlements, South Africa's rapidly shifting political landscape produced important cleavages. Many revolved around the emerging contest between the ANC and the EFF. Whereas the ANC drew particular support from women, older voters, isiZulu speakers and welfare state beneficiaries, the EFF base leaned towards men, younger voters, Sepedi speakers and those overlooked by the welfare state.
VOTING AND POPULAR RESISTANCE
The surveys also provide a valuable window into the contentious side of South African society, including the relationships between voting, protest and political attitudes. In both 2014 and 2016, respondents who had participated in a worker protest, as well as those who had participated in a community protest, were significantly less likely to vote for the ANC and significantly more likely to vote for the EFF. This finding challenges Booysen's (Reference Booysen and Booysen2012) hypothesis that residents alternate between ‘the ballot and the brick’ to engage, rather than oppose, the ruling party. Consistent with Alexander (Reference Alexander, Dawson and Sinwell2012), it suggests instead that protest activity may reflect deeper disaffection with the ANC, which translates into opposition votes. With respect to attitudes, the 2016 survey asked, ‘Overall, how satisfied are you with the way democracy works in South Africa?’ Overall, 40% of respondents were dissatisfied, including responses of ‘not very satisfied’, ‘not at all satisfied’ and ‘South Africa is not a democracy’. Not surprisingly, levels of dissatisfaction varied significantly by party preference. Whereas 62% of EFF voters and 54% of DA voters expressed dissatisfaction with democracy, only 23% of ANC voters did so.
The 2016 survey also asked: ‘If trade unions formed a political party for workers, would you vote for it?’ Previous surveys found substantial support for a ‘workers’ party’ or ‘labour party’. One-third of adults in a 2014 national survey, and nearly two-thirds of respondents in a 2012 survey of COSATU shop stewards, expressed willingness to vote for such a party (Webster & Orkin Reference Webster and Orkin2014). By 2016, political divisions made it difficult to interpret the results. Respondents may have understood ‘trade unions’ to mean, variously, the ANC-aligned COSATU; the Association of Mineworkers and Construction (AMCU), COSATU/NUM's biggest rival in the mining sector; or the National Union of Metalworkers of South Africa (NUMSA), which COSATU expelled due to the union's rejection of the ANC. Despite the ambiguities, the results nonetheless affirm substantial support – 43% of respondents answered positively – for the formation of a new political party centred on workers. This support crossed party lines. Similar proportions of ANC (43%), EFF (47%) and DA (45%) voters indicated support for a workers’ party.
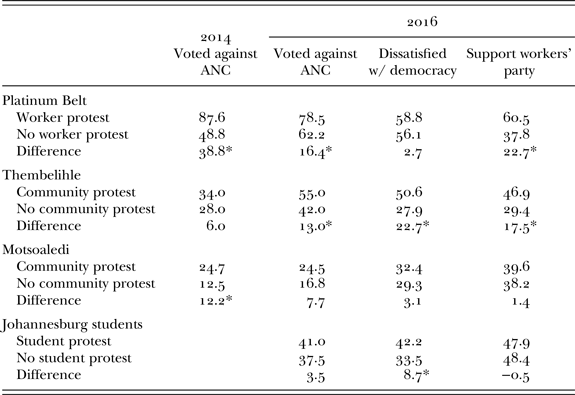
I further examine the relationship between voting, protest and political attitudes through three brief case studies of collective resistance: (1) worker protest in the North West province Platinum Belt; (2) community protest in Thembelihle and Motsoaledi, two informal settlements in Johannesburg; and (3) student protest in the Johannesburg city centre. Table V presents the survey results pertaining to the three case studies. The first three sections of the table include all of the respondents in the Platinum Belt, Thembelihle and Motsoaledi sites, respectively, while the fourth section (Johannesburg students) includes student respondents in the Brixton and University of Johannesburg sites. For each group, the figures contrast the voting decisions and political attitudes of worker (Platinum Belt), community (Thembelihle and Motsoaledi) or student (Johannesburg students) protesters, with those who did not participate in the relevant form of protest.
Proportion of respondents with oppositional political views, by site and protest participation, 2014 and 2016.

Source: Centre for Social Change Election Surveys, 2014 and 2016.
Note: * denotes a statistically significant difference.
Worker protest in the Platinum Belt
The Marikana massacre was a defining moment for post-apartheid South Africa, and especially for the mining communities in the Platinum Belt. The police killing of 34 striking workers on 16 August 2012 solidified a shared hostility towards NUM, COSATU, ANC and the state. As one worker explained, ‘the ANC is COSATU. COSATU is NUM. All those people; they have got a hand in the killing of workers who died at the mountain. Because they are the ones who called the government and said we must be killed’ (Paret et al. Reference Paret, Sinwell and Ndibongo2014). While the massacre inspired large-scale disaffection from the ANC-aligned NUM, the EFF developed an important base within the area. Two days after the massacre, future EFF leader Malema gave a rousing speech to a massive rally of mineworkers, during which he condemned the ANC, NUM and President Jacob Zuma. In the Rustenberg municipality, the EFF secured 24% of the vote in 2014 and 27% of the vote in 2016, giving the party 24 council seats.
Within the Platinum Belt site, participants in worker protests were more likely than non-protesters to vote for opposition parties in both 2014 and 2016. The gap was much wider in 2014 (39 percentage points) than it was in 2016 (16 percentage points). The 2014 result may have reflected the recent, five-month AMCU strike, including about 70,000 mineworkers, which likely reinforced animosity towards the ANC. Because the labour politics of the Platinum Belt revolved primarily around national alliances, it also makes sense that they would feature more prominently during a national election. Protesters (59%) and non-protesters (56%) alike expressed high levels of dissatisfaction with democracy. Conversely, however, participants in worker protests were significantly more likely than non-protesters were to support the idea of a workers’ party, by a difference of 23 percentage points. These findings suggest that while the decision to protest required additional motivation beyond simply discontent, which was widespread, those who did protest were especially interested in political alternatives. Given the centrality of worker organising in the area (Sinwell & Mbatha Reference Sinwell and Mbatha2016), the notion of a workers’ party was probably an especially comprehensible alternative for many protesters.
Community protest in Thembelihle and Motsoaledi
Thembelihle and Motsoaledi were prominent sites for community protests, with central demands revolving around housing and electricity. Both experienced significant improvements around the 2014 and 2016 elections, enabling perceptions that protest action inspired local development. In Thembelihle, the state agreed in April 2015 to develop the area pending a geotechnical study of the land, and in early 2016 began work on installing formal electricity into residents’ shacks. Shortly before the 2016 local elections, in a pro-ANC media stunt, President Jacob Zuma visited the area to ‘switch on the lights’ for the first three beneficiaries. In Motsoaledi, the state began construction on a formal housing development ahead of the 2014 national election, and by the 2016 local election, two entire sections of the informal settlement had relocated into the houses.
Despite these similarities, local organising developed a more oppositional orientation in Thembelihle than it did in Motsoaledi. In Thembelihle, where residents confronted an ongoing threat of eviction, the Thembelihle Crisis Committee (TCC) joined with the Soweto Electricity Crisis Committee (SECC) to form an anti-ANC ‘electoral front’ called the Operation Khanyisa Movement (OKM). Between 2006 and 2016, OKM held a single proportional representation seat in the Johannesburg council. Ahead of the 2016 elections, OKM condemned Zuma's publicity stunt and claimed the electricity project as a product of their own struggles. In contrast, Motsoaledi residents did not face the same threat of eviction, and maintained a friendly relationship to the ANC from inception in the early 1990s. While activists associated with the Motsoaledi Concerned Residents (MCR) put forward an independent candidate in the 2011 local government elections, securing 25% of the vote, a combination of long-standing political loyalties and patronage – the ANC incorporated some activists into work on the housing development – muted the opposition. MCR eventually joined forces with a newly formed local branch of the ANC-aligned South African National Civic Organization (SANCO).
Voting patterns reflected these different trajectories. In the 2014 national election, the gap between community protesters and non-protesters in Thembelihle was not statistically significant. This was consistent with the OKM's greater focus on local service delivery and local elections, rather than national-level politics. In Motsoaledi, however, community protesters were twice as likely as non-protesters to vote against the ANC. This likely reflected popular frustration stemming from a massive 2013 protest, and the fact that houses were still under construction, generating anxiety about who would benefit. An opposite story unfolded during the 2016 local elections. In Thembelihle, 55% of community protesters voted against the ANC, compared with only 42% of non-protesters – a high rate of opposition for both groups, but also a gap of 13 percentage points. Protesters were also more likely to say that they were dissatisfied with democracy (23 percentage point gap), and would support a workers’ party (18 percentage point gap). Conversely, in Motsoaledi the divide between community protesters and non-protesters dissipated. In the 2016 survey, there were no statistically significant differences between community protesters and non-protesters with respect to voting against the ANC, dissatisfaction with democracy, or support for a workers’ party.
These findings reinforce the mixed results in previous research regarding the relationship between voting and community protests. Consistent with Alexander's (Reference Alexander, Dawson and Sinwell2012) analysis, between 2014 and 2016 community protest in Thembelihle increasingly fed into anti-ANC opposition. Strong local political organisation with a clear anti-ANC politics reinforced this pattern. Conversely, in Motsoaledi, overall support for the ANC was higher, and the divide between community protesters and non-protesters diminished over time. This reflected long-standing loyalties to the ruling party, and the absence of a strong local organisation with a clear anti-ANC politics. Consistent with Booysen's (Reference Booysen and Booysen2012) ‘ballot and brick’ hypothesis, the Motsoaledi case shows how community protest may feed back into ANC dominance.
Student protest in Johannesburg
The student movement emerged rapidly in 2015. It began with efforts at the University of Cape Town to remove a statue of Cecil Rhodes, a late 19th century white mining capitalist, which in turn sparked movements around the country for the decolonisation of higher education. The #RhodesMustFall movement foreshadowed the much larger #FeesMustFall movement, which erupted in October 2015 and continued into early 2016. The latter opposed fee increases and sought free higher education. Though national, students from the University of Witwatersrand (Wits) and the University of Johannesburg – located within a kilometre of each other in Johannesburg – played leading roles in the #FeesMustFall movement. Students directed their protests towards the national government and, at times, the ANC, though some participants and leaders belonged to ANC-aligned student organisations. Mass rallies and meetings sometimes became sites for political posturing, including squabbles between student groups aligned with the ANC and EFF, while other students sought to build a non-party movement (Naidoo Reference Naidoo2016).
This fluidity probably contributed to the weak political divide between student protesters and non-protesters. Only the 2016 survey asked about student protests, as there was little evidence of such at the time of the 2014 election. The 2016 survey affirmed that student protests reflected significant discontent. Student protesters were more likely than non-protesters, by 9 percentage points, to express dissatisfaction with democracy. Yet the survey results also show that participation in student protest did not translate into heightened desire for political alternatives. Compared with non-protesters, student protesters did not express significantly higher levels of either opposition to the ANC or support for a workers’ party. These results suggest that, as of August 2016, the student movement had yet to channel dissatisfaction in a clear direction that was distinct from general student views.
CONCLUSION
During the decade of Jacob Zuma's leadership, the ANC confronted growing internal divisions, publicised scandals and widespread popular resistance. At the polls, competition deepened as the ruling party lost ground to opposition parties. While South Africa's future remains incredibly uncertain, the findings presented here point to three general conclusions about the emerging political moment. First, age, gender and ethnicity represent potentially explosive axes of political division. The constant influx of young voters into the electorate underscores a looming crisis for the ANC, which draws greatest support from older voters. If the ruling party is going to stem the tide of decline, it will have to find a way to incorporate younger generations. Conversely, however, the ANC remains strong among women. While this pattern may stem partially from the EFF's masculine presentation, the amplified gender gap during local elections hints that women may trust the ANC more to deliver crucial resources. These age and gender differences underscore the potential for tension and conflict within households, where poor residents manage the current crisis of social reproduction. As a result, patterns of family socialisation may prove especially significant. This will be a crucial area for further research.
Consistent with previous research on African democracy, internal division and the growth of patronage networks within the ANC went hand-in-hand with increased ethnic identification. In both 2014 and 2016, the ANC drew particular support from isiZulu speakers while the EFF drew particular support from Sepedi speakers. This represented a rejuvenation of long-standing ethnic divisions, which the apartheid state entrenched through policies of indirect rule. Ethnic divisions burst to the fore in a surge of violent conflict that ravaged the townships in the early 1990s, on the eve of the official democratic transition. While such divisions persist within South African society, their salience depends, at least partly, on party actors. As the ‘articulation’ approach within political sociology highlights, political parties do not only reflect cleavages within society, they also construct and reproduce them (De Leon et al. Reference De Leon, Desai and Tugal2015). In South Africa, Zuma's celebration of Zulu heritage and Malema's identification as Pedi helped to reinvigorate ethnic divisions. To the extent that political parties highlight ethnic identities in the future, heightened party competition may provoke resurgent ethnic division or ethnic conflict.
A second primary conclusion is that control of the state apparatus is a crucial resource in the unfolding competition between the ANC and opposition parties. If ethnicity figured prominently among voter decisions, the elections in 2014 and 2016 were far from ethnic censuses. Voters also paid close attention to government performance. Across the African continent, ruling parties use a variety of measures, from gerrymandering and corruption to repression and vote fraud, to retain control of the state (Cheeseman 2015: 146). In South Africa, however, the ANC arguably benefitted even more from its ability to claim responsibility for the welfare state. Against the backdrop of widespread poverty and unemployment, public benefits were immensely valuable politically. That access to certain resources shaped voting decisions during specific elections – social grants in national elections, housing during local elections – attests to just how closely residents followed the operations of government agencies. The results suggest that perceptions of government performance, whether evaluations of the past or expectations of the future, will be central to heightened competition between political parties.
The third conclusion is that the political character and consequences of popular resistance are fluid and variable. As per Alexander's (Reference Alexander, Dawson and Sinwell2012) analysis, the Platinum Belt and Thembelihle cases suggest that protest activity reinforced opposition to the ruling party. Conversely, among Motsoaledi residents and Johannesburg students, there were no significant differences between protesters and non-protesters in terms of opposition to the ANC or support for a workers’ party. The Motsoaledi case, in particular, affirmed Booysen's (Reference Booysen and Booysen2012) ‘ballot and brick’ hypothesis, which posits that voters choose to keep ANC officials in power while using protest to engage them between elections. While there is a high level of dissatisfaction overall, the political direction of mobilised discontent remains malleable. With no foreseeable end to chronic problems of poverty and unemployment, political parties will continue to fight for the allegiances of disgruntled residents. The potential benefits of being able to channel discontent are significant.
Evidence of significant political divisions within the impoverished townships and informal settlements challenges notions of one-party dominance, or even Friedman's (Reference Friedman2015) notion of local ‘archipelagos of dominance’. The legacy of national liberation and local power dynamics certainly reinforced support for the ANC. Yet voters also critically evaluated the ANC's performance in government, and some turned to opposition parties. The entry of the EFF amplified competition within the electoral sphere, giving voters a new way to identify and punish the ruling party. The division between isiZulu-speaking ANC voters and Sepedi-speaking EFF voters represented one emergent division, but age, gender and welfare receipt mattered too. In some places, participation in protests signalled disaffection from the ruling party. Far from uniform, local electorates within black poor and working-class areas fractured along varied lines. The fact that the EFF doubled its total votes in just two years, from 1.17 million in 2014 to 2.45 million in 2016, suggests that the party may fare better than COPE, the previous ANC-breakaway that quickly faded into obscurity. If so, continued EFF success will probably translate into further fragmentation within the black townships and informal settlements.
With the close of the Jacob Zuma era, reorganisation of the ANC is hugely important. At the ANC's national conference in December 2017, Cyril Ramaphosa, the trade unionist-turned-business mogul, defeated Zuma's preferred successor, his former wife Nkosazana Dlamini-Zuma, in the race for party president. Shortly afterwards, the ANC recalled Zuma as head of state and replaced him with Ramaphosa. Promising to restore dignity to the ruling party and the country's democratic institutions, the shift signalled hope for investors, ANC supporters and concerned citizens. The renewed post-Zuma ANC will almost certainly aim to preserve a link to the anti-apartheid struggle and the democratic transition. Yet references to the past may become decreasingly effective, pushing the ANC to prove to voters that it is the best option in the present, independent of historical legacy. This is what it would mean for South Africa to move beyond post-apartheid politics.
Loyal ANC voters may return to the ANC in the 2019 national election, allowing the ruling party to recover some of the ground lost during the 2016 local elections. Yet unless the ANC can achieve a remarkable turnaround, deepening political fragmentation marked by increasingly competitive elections will characterise the near future. Crucially, Ramaphosa does not politicise his own ethnic identity. As one commentator put it, ‘he speaks Zulu when he's in KwaZulu-Natal, Xhosa in the Eastern Cape, Tsonga and Sepedi in Limpopo. He hardly speaks Venda, his mother tongue … it has a unifying feel about it’ (Mkhabela Reference Mkhabela2017). In contrast to the findings here, ethnic divisions may become less salient, amplifying the significance of government performance. Will the ANC, under Ramaphosa's leadership, significantly undermine corruption and patronage? How will the party perform on issues of job creation and public service delivery? The results presented here suggest that voters in the black townships and informal settlements will be watching closely. Future control of the South African state depends heavily on their evaluation.