INTRODUCTION
Fasciolosis is an increasing problem (Pritchard et al. Reference Pritchard, Forbes, Williams, Salimi-Bejestani and Daniel2005) both from a veterinary perspective – with up to 80% of British dairy herds showing evidence of infection (Salimi-Bejestani et al. Reference Salimi-Bejestani, Daniel, Felstead, Cripps, Mahmoody and Williams2005) – and also as a zoonosis with 40 million people potentially at risk of disease (Mas Coma et al. Reference Mas-Coma, Bargues and Valero2005). Although the increased incidence of fasciolosis has been ascribed to climatic fluctuations (Mitchell, Reference Mitchell2002), an additional cause for concern is the spread of resistance against the drug of choice, the benzimidazole derivative triclabendazole (TCBZ). Resistance to TCBZ, which was first detected in Australia (Overend and Bowen, Reference Overend and Bowen1995), has now been reported from Ireland, Scotland, the Netherlands and Spain (Anon, 1995; Mitchell et al. Reference Mitchell, Maris and Bonniwell1998; Moll et al. Reference Moll, Gaasenbeek, Vellema and Borgsteede2000; Alvarez-Sanchez et al. Reference Alvarez-Sanchez, Mainar-Jaime, Perez-Garcia and Rojo-Vazquez2006). At present, the mechanisms underlying the loss of efficacy of TCBZ are poorly understood (Fairweather, Reference Fairweather2005), but it would appear that, in contrast to benzimidazole resistance in nematodes (Kwa et al. Reference Kwa, Veenstra and Roos1994), changes in β-tubulin, the presumed target molecule, are not involved (Robinson et al. Reference Robinson, Trudgett, Hoey and Fairweather2002; Ryan et al. Reference Ryan, Hoey, Trudgett, Fairweather, Fuchs, Robinson, Chambers, Timson, Ryan, Feltwell, Ivens, Bentley and Johnston2008). Evidence suggests that differences in the metabolism and efflux of TCBZ may be of greater importance in trematodes (Robinson et al. Reference Robinson, Lawson, Trudgett, Hoey and Fairweather2004; Mottier et al. Reference Mottier, Alvarez, Fairweather and Lanusse2006; Devine et al. Reference Devine, Brennan, Lanusse, Alvarez, Trudgett, Hoey and Fairweather2009). Despite our lack of information relating to the mechanism of TCBZ resistance and the consequent lack of a genetic marker for this phenotype, we can infer from analogous studies in nematodes (Otsen et al. Reference Otsen, Hoekstra, Plas, Buntjer, Lenstra and Roos2001) that responses to varying environmental pressures, in this case the selection of resistant flukes following anthelmintic usage, will be more rapid if the infrapopulations (i.e. those flukes contained within an individual host) involved are genetically diverse. Studies of the mitochondrial lineages present in the infrapopulations of flukes infecting cattle and sheep from eastern Europe (Semyenova et al. Reference Semyenova, Morozova, Chrisanfova, Gorokhov, Arkhipov, Moskvin, Movsessyan and Ryskov2006) and elsewhere (Walker et al. Reference Walker, Prodöhl, Fletcher, Hanna, Kantzoura, Hoey and Trudgett2007) have shown that each definitive host may carry a large number of genetically diverse flukes, which tend to exhibit a leptokurtic distribution (i.e. more peaked about the mode than the normal distribution) of genotypes. A theoretical framework for the dispersal and spread of trematodes in their definitive and intermediate hosts has been proposed (Prugnolle et al. Reference Prugnolle, Liu, de Meeus and Balloux2005). It may be assumed that this model would also be applicable to the liver fluke, but we have comparatively little experimental data to support this inference. In addition, the economic constraints associated with high-value farm animals impose limits on experimental designs that would address this deficit directly. In this study, we used parasite material collected as part of a study concerned with the spread of anthelmintic resistance to determine the mitochondrial lineages of F. hepatica from cattle present on farms in the Netherlands. This has allowed us to assess the stability of the populations within a locality and the differences seen in fluke populations between 2 localities separated by ∼100 km. The results from this study will be useful in the determination of the phylogeography of the liver fluke and in the interpretation of studies of the genetic factors underlying the response of fluke populations to environmental changes, such as anthelmintic use or climate alteration (Mas-Coma et al. 2009).
MATERIALS AND METHODS
Farms and fluke samples
Samples of F. hepatica from cattle from 2 farms were used. Both farms were comparable in size and stocking rates. The first of these was situated at Beetsterzwaag (53.058° N 6.078° E) in the province of Friesland. This farm kept both cattle and sheep. While the cattle were born on the farm, sheep were occasionally introduced from elsewhere in the Netherlands. Triclabendazole was used approximately once a year as an anthelmintic, and the liver fluke population on this farm is regarded as susceptible for TCBZ. The second farm was situated at Heiloo (52·364° N 4·427° E) in the province of North-Holland. Both cattle and sheep were present on this farm, again with all cattle being born on the farm as well as the majority of the sheep. Whilst triclabendazole had been used as an anthelmintic in the past, due to the presence of TCBZ resistance in this area (Moll et al. Reference Moll, Gaasenbeek, Vellema and Borgsteede2000; Borgsteede et al. Reference Borgsteede, Moll, Vellema and Gaasenbeek2005), cattle are now treated 2 or 3 times a year with clorsulon. The 2 farms were approximately 100 km apart, but due to the IJsselmeer man-made lagoon lying between them, the distance by land is closer to 150 km. All fluke samples were obtained from cattle at post-mortem.
(i) Beetsterzwaag 2004 samples: 10 cattle were used. The cattle were 6–7 months old and uninfected when ‘turned out’ to pasture in mid-October 2004. They were allowed to graze for 1 month and then re-housed. Two weeks later all cows were slaughtered and necropsies performed. Any flukes present thus represented a sample of the pasture contamination from the summer of 2004.
(ii) Beetsterwaag 2005 samples: the 10 cows used were uninfected when turned out to pasture in mid-May 2006 and were thus exposed to metacercariae that had been encysted on the vegetation in the summer and autumn of 2005 and to metacercariae from infected snails that had survived the winter and had started shedding in spring 2006. During the winter of 2005/2006, sheep had been grazed on the pasture, but they would not have contributed to the liver fluke population in the cows due to the inactivity of the intermediate host during the winter months. The experimental design for the 2004 cows was repeated with cows grazing for 4 weeks before re-housing, subsequent slaughter and post-mortem examination for liver fluke infection.
(iii) Heiloo 2005 samples: the 10 cows used were uninfected at turn-out in early May 2006 and were thus exposed to metacercariae originating from the same time-period as Beetsterzwaag 2005. The protocol for Beetsterzwaag 2004 was followed with regard to grazing period, re-housing and slaughter.
Preparation of individual F. hepatica extracts for PCR-based amplification
Adult F. hepatica were removed from the livers and bile ducts at slaughter and washed in warm Heidon-Fleig solution to remove contaminating host material and allow for exvasation of gut contents. Approximately 25 mm2 of fluke tissue were placed into 500 μl of 10% Chelex® (Fluka) solution incorporating 10 μl of proteinase K (Sigma) at a concentration of 20 mg/ml. This suspension was heated at 55°C for 1 h, followed by gentle vortexing and a further incubation at 95°C for 30 min. The mixture was gently vortexed and centrifuged at 10 000 g for 10 sec. The supernatant (250 μl) was taken, diluted 1:10 in deionized water and stored at −20°C.
PCR-based mitochondrial DNA (mtDNA) analysis of individual flukes
The distribution of variation within the F. hepatica mitochondrial genome has been described previously (Walker et al. Reference Walker, Prodöhl, Fletcher, Hanna, Kantzoura, Hoey and Trudgett2007) and a region of high variability identified. This region comprised 1400 bp of contiguous mtDNA enclosing the regions coding for cytochrome c oxidase subunit III (cox III), transfer RNA histidine (tRNA-His) and cytochome b (cob). Two primer sets were used to generate overlapping fragments in PCR: Primer set 1: Fhmt1.1F 5′-gcttgtgggttttcttaggg-3′, Fhmt1.1R 5′-caaccaaacctcaacaacct-3′; Primer set 2: Fhmt1.2F 5′-tgtggtgtcggagagttctg-3′ and , Fhmt1.2R 5′-taaccataggatccgcctga-3. Fragment 1 consisted of nucleotides 77 to 881 of the complete F. hepatica mitochondrial sequence (Le et al. Reference Le, Blair and McManus2001), whilst fragment 2 ran from nucleotides 681 to 1480.
PCR conditions
The PCR reaction mix consisted of 20 μl of PCR ReadyMix™ (Sigma), 13 μl of deionized water, 1 μl (10 pmol) of primers followed by 5 μl of fluke extract (1:10 dilution), giving a total of 40 μl. PCR amplifications were carried out as follows: 2 min at 94°C followed by 40 cycles of 1 min at 94°C, 1 min at 59°C and 1 min at 72°C, followed by a final extension at 72°C for 10 min. PCR products were purified using the GeneElute™ PCR Clean-Up Kit (Sigma) as described in the manufacturer's instructions and sent for automated sequencing in forward and reverse directions using the same primers as used for PCR. (Macrogen Inc. Korea)
Data assembly and analysis of population structure
Sequences were visually checked against the electropherograms. Forward and reverse sequences for both mtDNA regions were aligned and DNA contigs constructed using ChromasPro software (Technelysium Pty Ltd, Australia) and the alignment of assembled sequences was carried out in Bioedit (Hall, Reference Hall1999). Levels of mtDNA sequence variation were estimated as nucleotide and haplotype diversity using Arlequin 3.1. The extent of inter and intra-population genetic structuring was assessed by analysis of molecular variance (AMOVA in Arlequin 3.1, with 1000 permutations). Median-joining networks were calculated using ‘Network 4.5’ (Flexus Technology Ltd) software. An unrooted Neighbour-Joining (NJ) tree was constructed using MEGA (version 4) software (Tamura et al. Reference Tamura, Dudley, Nei and Kumar2007). The sequences of each unique haplotype were submitted to GenBank and have been assigned Accession numbers FJ936003, FJ93604, FJ936006 to FJ936014, FJ936016, FJ936018 to FJ936020, FJ936022 to FJ936031, FJ936033 to FJ936051, FJ936054 to FJ936068, FJ936070 to FJ936072, and FJ936076 to FJ936107.
RESULTS
Infection intensity and efficiency of sampling
For the Beetsterzwaag 2004 cohort, the infrapopulations ranged in size from 82 to 558 flukes (mean fluke burden 210). Twenty flukes from each infrapopulation were processed for genetic analysis and a total of 149 contigs of the 1400 bp fragment were obtained.
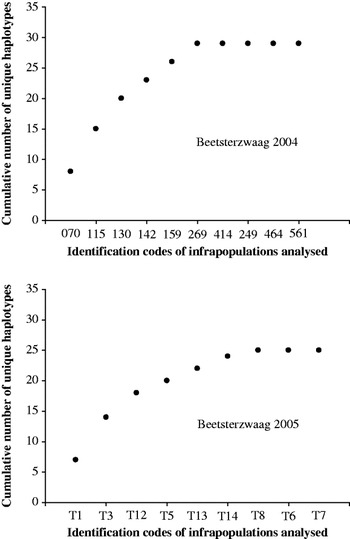
For the Beetsterzwaag 2005 cohort, 10 infrapopulations, ranging in size from 1 to 33 flukes (mean fluke burden 20) were analysed and 96 contigs obtained. Genetic analysis of these 245 flukes yielded 38 distinct mtDNA haplotypes. In order to assess whether the infrapopulations available provided a sample representative of the F. hepatica in Beetsterzwaag, the cumulative number of unique haplotypes found was plotted against the sequentially analysed infrapopulations. Figure 1 shows that the curves derived approached the asymptote after approximately 8 infrapopulations, indicating that sufficient material had been examined to provide a comprehensive assessment of haplotype diversity.
Analysis of the efficiency of sampling. The cumulative number of unique haplotypes found in each successive infrapopulation sampled was plotted to ascertain at what point the curves approached the asymptote.

Genetic structure of fluke infrapopulations in cattle from Beetsterzwaag
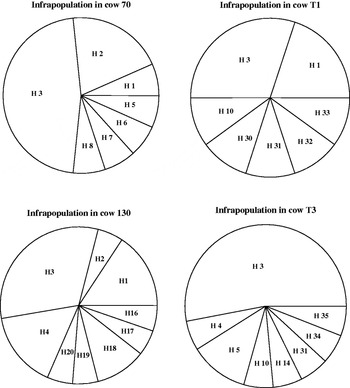
In all instances, distribution of haplotypes conformed to a leptokurtic curve (see Fig. 2 for examples). Although some haplotypes (e.g. haplotypes 3 and 5) were present in most infrapopulations, each cow carried some haplotypes present at much lower frequencies. Analysis of molecular variance (AMOVA) resulted in an overall significant F st of 0·0228. Thus, while more than 97% of the mtDNA haplotypic variability was present within the infrapopulations, the remaining 3% of the genetic variation was inferred to be due to differences between these infrapopulations.
Pie charts showing distribution of haplotypes in typical infrapopulations. Cows 70 (total number of flukes in the liver, N=152) and 130 (N=232) from Beetsterzwaag 2004; cows T1 (N=11) and T3 (N=27) from Beetsterzwaag 2005.

Stability of the Beetsterzwaag metapopulation with time
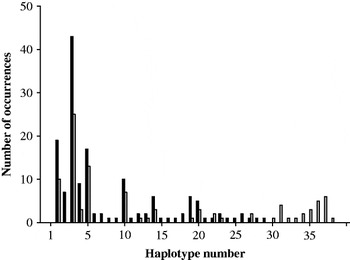
The incidence of individual haplotypes present in the Beetsterzwaag infrapopulations is shown in Fig. 3. Thirteen (44·8%) of the 29 haplotypes present in the 2004 population were still present in the 2005 infrapopulations. These haplotypes included those present at the highest frequency: haplotypes 3, 15, 10 and 4. Sixteen haplotypes present in the 2004 sample were not seen in the 2005 sample which, in turn, contained 9 novel haplotypes (31·0%). A test of sample differentiation, based on haplotype frequencies, gave a P value of 0·0016 – indicating that the fluke population present on this farm had significantly changed over the period of 18 months. The nucleotide diversity and mean number of pairwise differences was calculated for the Beetsterzwaag 2004 and 2005 populations. This gave values of 0·877 and 0·893 for nucleotide diversity and 5·074 and 5·343 for pairwise diversity, respectively, indicating that the degree of diversity was being maintained over the time-period.
Frequency of haplotypes in the Beetsterzwaag samples. Black columns 2004, N=149. Grey columns 2005, N=96.

Genetic structure of the Beetsterzwaag fluke population
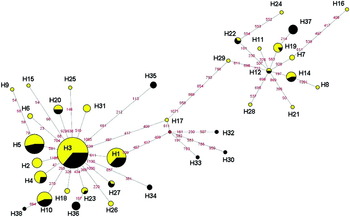
In order to determine the genetic relationships among haplotypes found in the two Beetsterzwaag samples, a Median Joining Network was constructed (Fig. 4). The haplotypes were clearly divided into 2 distinct clades centred on the haplotypes 3 and 12, respectively. These two clades were separated by 15 nucleotide changes. A third clade, centred on a putative ancestral haplotype (not observed in the dataset) was formed by haplotypes 17, 30, 32 and 33. Haplotypes unique to either the 2004 samples or those from 2005 were seen in each clade. Statistical support for 3 clades was provided by the construction of a NJ tree with 500 bootstrap replicates (supplementary material 1), which indicates bootstrap support of >50% for the three putative clades.
Median Joining Network derived from the Beetsterzwaag samples. Haplotype identities are in black text. Circles are proportional in size to the frequency of the haplotype and yellow signifies 2004 samples, black 2005 samples. Distances are approximately proportional to the number of nucleotide changes, the positions of these changes in the edited sequences are indicated by red numerals. The red dot represents a virtual node.

Effect of spatial separation – comparison of the Beetsterzwaag with the Heiloo metapopulations
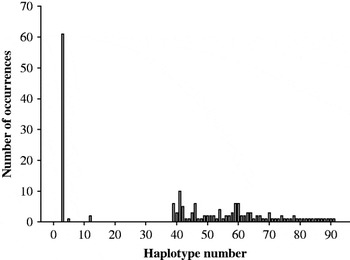
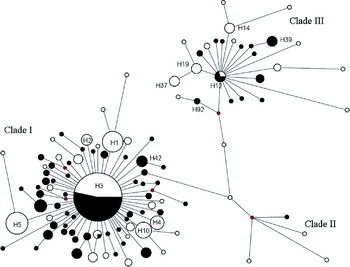
In total, 177 flukes from 10 infrapopulations from Heiloo were analysed genetically. The infrapopulations ranged in size from 35 to 168, with a mean of 153, and 56 haplotypes were observed in these infrapopulations. Fig. 5 shows the incidence of haplotypes present for this metapopulation. Of the 91 unique haplotypes found among a total of 422 flukes analysed from Beetsterzwaag and Heiloo, only haplotypes 3, 5 and 12 were found in both the Beetsterzwaag metapopulation and that from Heiloo. However, haplotype 3 occurred at the highest frequency in all populations and comprised almost a third of the Heiloo population. A test of sample differentiation based on haplotype frequencies gave a P value of <0·001, indicating that the Beetsterzwaag and Heiloo populations were significantly different genetically. Individual infrapopulations from Heiloo were similar in structure to those from Beetsterzwaag in that the frequency of the haplotypes within them was distributed leptokurtically. The nucleotide diversity and mean number of pairwise differences was calculated for the Heiloo population. This calculation gave values of 0·873 and 4·461, respectively, indicating that, although the Heiloo population contained a proportionately greater number of haplotypes, the metapopulation at Heiloo was less divergent than that of Beetsterzwaag. A Median Joining network was constructed for the Beetsterzwaag and Heiloo populations (Fig. 6). This network shows that the haplotypes in the Heiloo population were distributed across the three previously identified clades.
Frequency of haplotypes in the Heiloo sample, N=177.

Median Joining Network using flukes from Beetsterzwaag (white) and Heiloo (black). Size of nodes is proportional to frequency within the dataset and distance between nodes is approximately proportional to the number of nucleotide changes. Red dots indicate virtual nodes. The identities of the more frequent haplotypes are indicated.

DISCUSSION
As reported previously for flukes from Ireland (Walker et al. Reference Walker, Prodöhl, Fletcher, Hanna, Kantzoura, Hoey and Trudgett2007), the infrapopulations present in Dutch cattle showed extensive genetic diversity with 92 haplotypes being observed in a total sample size of 422 F. hepatica adults on the Dutch farms in comparison with 35 out of 154 examined in Ireland. Each infrapopulation contained >8 mitochondrial haplotypes, with their individual frequencies conforming to a leptokurtic distribution. Although on analysis the molecular variance statistics indicated that most of the variance lay within rather than between the infrapopulations, we would interpret these statistics with caution, as the biology of the liver fluke (breeding restricted to limited infrapopulations, polyembryony, potential for parthenogenesis) violates many of the assumptions underlying these analytical tools. This pattern of distribution appears to be typical of infrapopulations sampled from diverse locations (Walker et al. Reference Walker, Prodöhl, Fletcher, Hanna, Kantzoura, Hoey and Trudgett2007) and may be a function of the patterns of cercarial release from intermediate hosts (Walker et. al. Reference Walker, Hoey, Fletcher, Brennan, Fairweather and Trudgett2006). As all the cattle were <1 year old, and had been raised on the same farm, it is suggested that the distribution of the different clonal populations of metacercariae on the pasture is extremely ‘patchy’. The diversity of haplotypes was particularly remarkable as the cows were fluke-free at ‘turn out’ and had only grazed on the pasture for 4 weeks. Although differences in methodology make comparisons with previous studies of F. hepatica or other trematodes challenging, the high level of diversity both within and between infrapopulations in this study is of the same order as that reported recently for populations of Echinococcus granulosus (Eucestoda: Taeniidae) from China (Nakao et al. Reference Nakao, Li, Han, Maa, Xiao, Qiu, Wang, Yanagida, Mamuti, Wene, Moro, Giraudoux, Craig and Ito2010). It will provide a metapopulation likely to be able to respond to changes in environmental conditions arising directly or indirectly from climatic change or anthelmintic usage.
The analysis of the Beetsterzwaag populations showed that there were 3 well-supported clades. The 2 major clades centred on haplotypes 3 and 12 which, from their central nodal position and comparatively high frequencies conformed to the criteria for ancestral haplotypes (Donnelly and Tavaré, Reference Donnelly and Tavare1986). Both clades I and III were similar in their divergence, in that 35 of the 73 daughter populations potentially derived from haplotype 3 differed from it by one nucleotide change. The comparable figures for haplotype 12 and its daughter populations were 13 out of 23. The presence of such star-shaped genealogies may be indicative of a relatively recent population expansion. Haplotypes 3 and 12 are also found in Irish, English and Polish F. hepatica and as such may be common in northern Europe (S. Walker, unpublished data). This information suggests that the colonization of northern Europe by the liver fluke involved at least 2 populations with distinct origins. Within the same infrapopulation, we commonly observed haplotypes from more than one clade, indicating that there is now no spatial separation of the clades at the farm level. Assuming a rate of nucleotide substitution for F. hepatica comparable with that reported for Schistosoma mansoni (see Morgan et al. Reference Morgan, Dejond, Adeoye, Ansa, Barbosa, Brémond, Cesari, Charbonnel, Corrě, Coulibaly, D'Andrea, de Souza, Deonhoff, File, Idris, Incani, Jarne, Karanja, Kazibwe, Kpikpi, Lwambo, Mabaye, Magalhães, Makundi, Moné, Mouahid, Muchemi, Mungai, Séne, Southgate, Tchuenté, Théron, Yousif, Zanotti-Magalhães, Mkoji and Loker2005) of 4% per million years, the separation of the two clades centred on haplotypes 3 and 12 can be calculated to have occurred ∼250 000 years ago. However, our deliberate choice of informative areas of the mitochondrial genome, which consequently show high levels of variability and the possibility that there has been a relatively recent population expansion allowing the fixation of new haplotypes, may bias this calculation towards an over estimate of the age of the clades. It will be interesting to determine whether F. hepatica populations from regions of southern Europe, such as Iberia or the Balkans, which may have provided refugia during the most recent glaciation (Hewitt, Reference Hewitt2000), contain flukes with haplotypes representing the same clades. The large dataset presented in this study will facilitate future studies of the phylogenetics of F. hepatica.
The opportunity to sample the metapopulations present at Beetsterzwaag on 2 occasions has provided an insight into the changes that may occur with regard to the distribution of haplotypes within a population with time. Under the conditions pertaining in northern Europe, a single year will encompass 1 to (possibly) 2 liver fluke life cycles (Boray and Enigk, Reference Boray and Enigk1964). As the cows at Beetsterzwaag were only exposed to the pasture for 4 weeks, it is likely that their infrapopulations represent the diversity present in the population resulting from a single liver fluke life cycle. The data from Beetsterzwaag indicate that during an 18-month period, there was a significant change in the haplotypes making up the cattle infrapopulations. The 2004 cows were ‘sampling’ the pasture in the autumn and the 2005 cows were turned out in the early summer of 2006, making the magnitude of apparent genetic difference in the 2004 and 2005 populations surprising. It is possible that the observed difference in haplotype frequency was due to insufficient sampling but the data presented in Fig. 1 appear to contradict this, suggesting that in as much as the adult flukes present in the definitive hosts represent the metacercarial contamination of the pasture, the change is real. Most of the haplotypes unique to the 2005 cows differed from those seen in 2004 by more than a single nucleotide change, making it unlikely that they had arisen as a result of mutations occurring in the 2004 population. Levels of infection in the spring of 2006 were, on average, only a tenth of those seen in autumn 2004. This may be due to a lower level of contamination of the pasture in early summer compared with autumn (Gaasenbeek et al. Reference Gaasenbeek, Over, Noorman and deLeeuw1992).
In the light of the changes observed at Beetsterzwaag over a relatively short time, it is perhaps not surprising that differences were seen when the Beetsterzwaag populations were compared with the Heiloo population. Both geographical separation and previous selection for anthelmintic resistance in the Heiloo area may have been causative factors. The flukes from Heiloo were slightly less diverse in their range of haplotypes based on pairwise differences when compared with those from Beetsterzwaag. Whilst this may be partly due to the sample from Beetsterwaag containing material from 2 seasons, it may also be a consequence of the anthelmintic regime used at Heiloo in previous years. The haplotypes detected belonged to the same 3 clades as the population from Beetsterzwaag. It may be significant that 2 of the 3 haplotypes common to both Heiloo and Beetsterzwaag were possibly ancestral haplotypes, which would suggest that following the initial colonization of a locality, there may be considerable local structuring of fluke populations. This could occur either as a result of selection for variants best adapted to that environment or by genetic drift. In species which reproduce panmictically and exclusively by sexual means there is a tendency for any nuclear mutations that occur in a population to be lost as a result of subsequent sexual reproduction. In contrast, the flukes forming the infrapopulation in the mammalian definitive host have the potential for self fertilization or asexual reproduction (reviewed by Fletcher et al. Reference Fletcher, Hoey, Orr, Trudgett, Fairweather and Robinson2004), which is followed by asexual polyembryony in the intermediate host. These processes may favour the relatively rapid establishment in the population of neutral or favourable mutations.
The Heiloo fluke population is known to contain TCBZ-resistant individuals: can we infer anything with regard to anthelmintic resistance in the liver fluke from its population structure? The haplotypes found in this population were associated with all three clades, including the potentially ancestral clades centring on haplotypes 3 and 12. These findings indicate that the mitochondrial haplotypes are acting as neutral markers with regard to TCBZ resistance. However, the absence of any evidence for recent ‘bottle-necking’ (Heiloo – 56 haplotypes from a sample of 177 flukes, Beetsterzwaag – 38 haplotypes from a sample of 244 flukes) makes it unlikely that resistance to TBCZ in the liver fluke has arisen as the result of the selection of individuals carrying a variant of a single gene – as may occur with benzimidazole resistance in nematodes (Wolstenholme et al. Reference Wolstenholme, Fairweather, Prichard, Von Samson-Himmelstjerna and Sangster2004) – and the subsequent expansion of the resistant population. The population structure observed in the Heiloo sample is consistent with the selection for the TCBZ-resistant phenotype working on a multigenic system in the nuclear genome to bring about a quantitative change in drug susceptibility.
In conclusion, we have shown that F. hepatica populations in these regions of the Netherlands are genetically diverse. Within a single farm the haplotypes detected in the metapopulation may change significantly over a relatively short time-period and spatially separated localities have significantly different populations. These factors, along with the leptokurtic distribution of haplotypes within infrapopulations, are likely to facilitate the selection of anthelmintic-resistant flukes.
ACKNOWLEDGEMENTS
We would like to acknowledge the cooperation of the farmers from Beetsterzwaag and Heiloo in this study. This project was supported by the DELIVER project (FOOD-CT-200X-023025), part of the Framework VI Programme of the European Union. C. J. was supported by a studentship from the G. and M. Williams Research Fund.