Introduction
Ferriphoxite and carboferriphoxite are closely related new mineral species found in an unusual bat guano assemblage in the Rowley mine in southwestern Arizona, USA. The name ferriphoxite is based on the composition of the structural unit – a linkage of ferric-iron octahedra, hydrogen phosphate tetrahedra and oxalate groups. The same structural unit is found in the associated mineral carboferriphoxite, which contains a dihydrogen carbonate (carbonic acid) group in its interstitial complex and hence has the prefix ‘carbo’ added to its name. Both minerals also contain NH4 and K sites in their interstitial complexes. We do not see a need at this point to add suffixes to either name; however, if analogues with different dominances at the large-cation sites were to be found, K and NH4 suffixes could be added based on the overall dominance of NH4 or K summed over all the large cation sites, in which case ferriphoxite would become ferriphoxite-(NH4) and carboferriphoxite would become carboferriphoxite-(NH4).
The new minerals and their names were approved by the Commission on New Minerals, Nomenclature and Classification of the International Mineralogical Association. Type specimens are deposited in the collections of the Natural History Museum of Los Angeles County, Los Angeles, California, USA. Catalogue number 76303 is the holotype for ferriphoxite (IMA2023-096; Warr symbol: Fphx, Kampf et al., Reference Kampf, Ma, Hawthorne and Marty2024a) and the cotype for carboferriphoxite (IMA2023-097; Warr symbol: Cfphx, Kampf et al., Reference Kampf, Ma, Hawthorne and Marty2024b). Catalogue number 76304 is the holotype for carboferriphoxite and the cotype for ferriphoxite.
Occurrence
Ferriphoxite and carboferriphoxite were collected by one of the authors (JM) on February 1, 2016, on the 125-foot level of the Rowley mine, ∼30 km NNW of Gila Bend (the nearest town to the mine), Maricopa County, Arizona, USA (33°2ʹ57ʹʹN 113°1ʹ49.59ʹʹW). The Rowley mine is on the western slope of the Painted Rock Mountains (in the Painted Rock mining district) and overlooks the Dendora Valley, immediately to the west. It is a former Cu–Pb–Au–Ag–Mo–V–baryte–fluorspar mine that exploited veins presumed to be related to the intrusion of an andesite porphyry dyke into Tertiary volcanic rocks. Although the mine has not been operated for ore since 1923, collectors took notice of the mine as a source of fine wulfenite crystals around 1945. An up-to-date account of the history, geology and mineralogy of the mine was published recently by Wilson (Reference Wilson2020).
The new minerals were found in a hot and humid area of the mine (see Fig. 26 in Wilson, Reference Wilson2020) in an unusual bat guano-related, post-mining assemblage of phases that include a variety of vanadates, phosphates, oxalates and chlorides, some containing (NH4)+. This secondary mineral assemblage is found growing on baryte–quartz-rich matrix and, besides ferriphoxite and carboferriphoxite, includes allantoin (Kampf et al., Reference Kampf, Celestian, Nash and Marty2021a), alunite, ammineite, antipinite, aphthitalite, bassanite, biphosphammite, cerussite, davidbrownite-(NH4) (Kampf et al., Reference Kampf, Cooper, Rossman, Nash, Hawthorne and Marty2019a), dendoraite-(NH4) (Kampf et al., Reference Kampf, Cooper, Celestian, Ma and Marty2022a), ebnerite (Kampf et al., Reference Kampf, Gu, Yang, Ma and Marty2024c), edwindavisite (Yang et al., Reference Yang, Gu, Kampf, Marty, Gibbs and Downs2023), epiebnerite (Kampf et al., Reference Kampf, Gu, Yang, Ma and Marty2024c), fluorite, halite, hydroglauberite, mimetite, mottramite, natrosulfatourea (Kampf et al., Reference Kampf, Celestian, Nash and Marty2021a), newberyite, perite, phoxite (Kampf et al., Reference Kampf, Celestian, Nash and Marty2019b), relianceite-(K) (Kampf et al., Reference Kampf, Cooper, Celestian, Ma and Marty2022a), rowleyite (Kampf et al., Reference Kampf, Cooper, Nash, Cerling, Marty, Hummer, Celestian, Rose and Trebisky2017), salammoniac, struvite, thebaite-(NH4) (Kampf et al., Reference Kampf, Cooper, Celestian, Nash and Marty2021b), thenardite, urea, vanadinite, weddellite, willemite, wulfenite and several other potentially new minerals. Ferriphoxite and carboferriphoxite were found in intimate association with antipinite, aphthitalite, baryte, fluorite, hematite and quartz. The new minerals are the result of the interaction of bat excrement with the existing mineralisation in the mine.
Physical and optical properties
Ferriphoxite
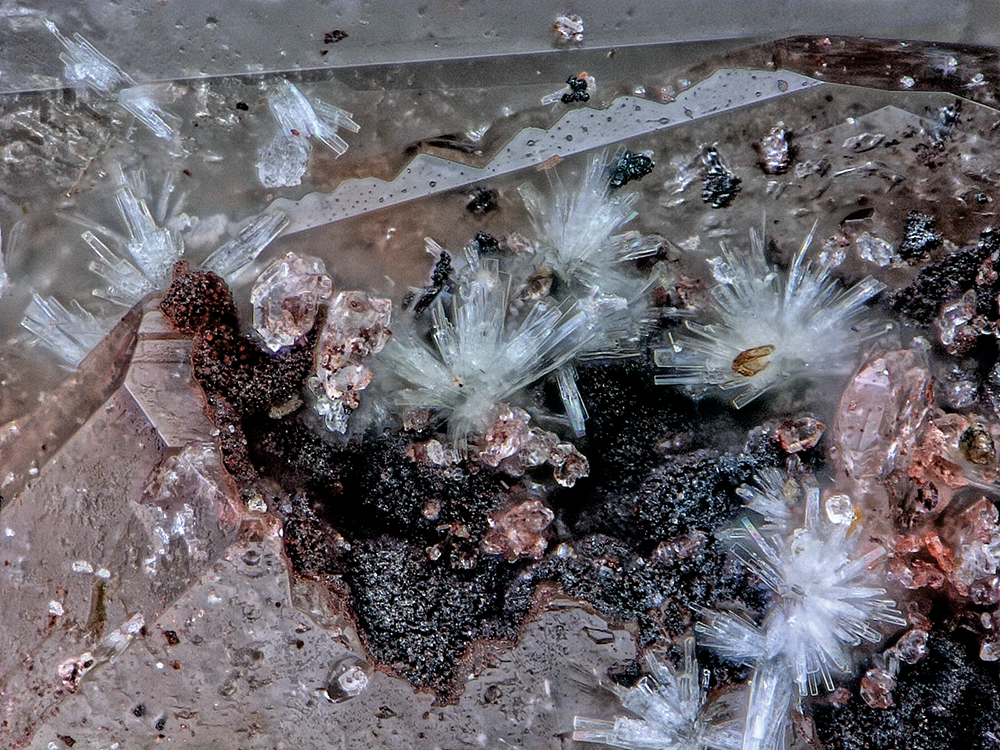
Crystals of ferriphoxite are colourless rectangular blades, up to ∼0.1 mm in length, typically occurring in sprays (Fig. 1). The blades are flattened on {001}, elongated along [010] and exhibit the forms {100}, {010} and {001}. No twinning was observed. Ferriphoxite has a white streak, vitreous lustre, brittle tenacity and splintery fracture. The Mohs hardness is ∼2 based on scratch tests. There are two good cleavages in the [010] zone – probably {100} and {001}. The mineral does not fluoresce in either long- or short-wave ultraviolet illumination. The density measured by flotation in a mixture of methylene-iodide and toluene is 2.14(2) g·cm–3. The calculated density is 2.138 g·cm–3 using the empirical formula and single-crystal unit-cell volume. At room temperature, ferriphoxite is insoluble in H2O, but easily soluble in dilute HCl. Ferriphoxite is optically biaxial (+) with α = 1.524(3), β = 1.560(3) and γ = 1.608(3) (determined in white light). The measured 2V using extinction data analysed with EXCALIBR (Gunter et al., Reference Gunter, Bandli, Bloss, Evans, Su and Weaver2004) is 83.9(4)°; the calculated 2V is 84.1°. There is distinct r < v dispersion. The optical orientation is X = b, Y ≈ c, Z ≈ a* and the mineral is nonpleochroic.
Sprays of ferriphoxite blades with quartz on hematite and baryte on holotype specimen #76303; field of view 0.56 mm across.

Carboferriphoxite
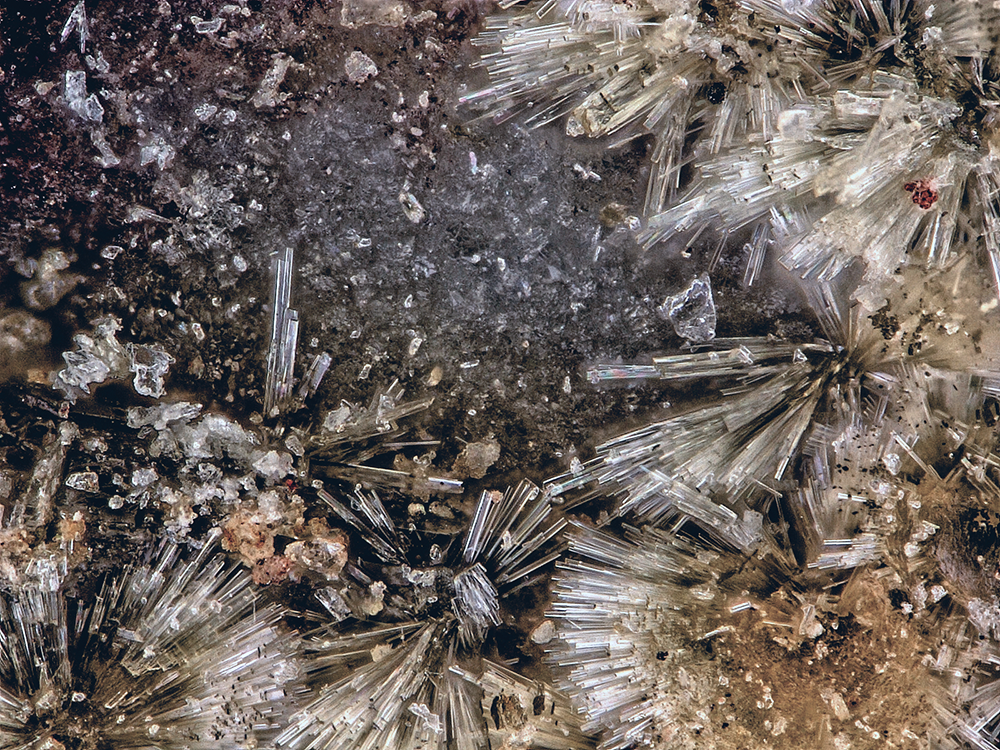
Carboferriphoxite occurs as colourless needles or blades, up to ∼0.2 mm in length, typically forming fan- and bowtie-like sprays (Fig. 2). Crystals are flattened on {010}, elongated along [100], have flat terminations and exhibit the forms {100}, {010} and {001}. No twinning was observed. Carboferriphoxite has a white streak, vitreous lustre, brittle tenacity and splintery fracture. The Mohs hardness is ∼2 based on scratch tests. There are three good cleavages: {100}, {010} and {001}. The mineral does not fluoresce in either long- or short-wave ultraviolet illumination. The density measured by flotation in a mixture of methylene-iodide and toluene is 2.14(2) g·cm–3. The calculated density is 2.122 g·cm–3 using the empirical formula and single-crystal XRD unit-cell volume. At room temperature, the mineral is insoluble in H2O, but easily soluble in dilute HCl. Carboferriphoxite is optically biaxial (+) with α = 1.525(3), β = 1.555(calc) and γ = 1.630(3) (determined in white light). The measured 2V using extinction data analysed with EXCALIBR (Gunter et al., Reference Gunter, Bandli, Bloss, Evans, Su and Weaver2004) is 67(1)°. It proved difficult to measure β, so it has been calculated from α, γ and 2V. It was not possible to observe the interference figure, so dispersion could not be determined. The optical orientation is X ≈ a, Y ≈ b*, Z ≈ c and the mineral is nonpleochroic. Note that a good way to distinguish carboferriphoxite from ferriphoxite is by its distinctly higher birefringence, evidenced by higher order interference colours under crossed polars.
Sprays of carboferriphoxite needles on holotype specimen #76304; FOV 0.68 mm across.

Raman spectroscopy
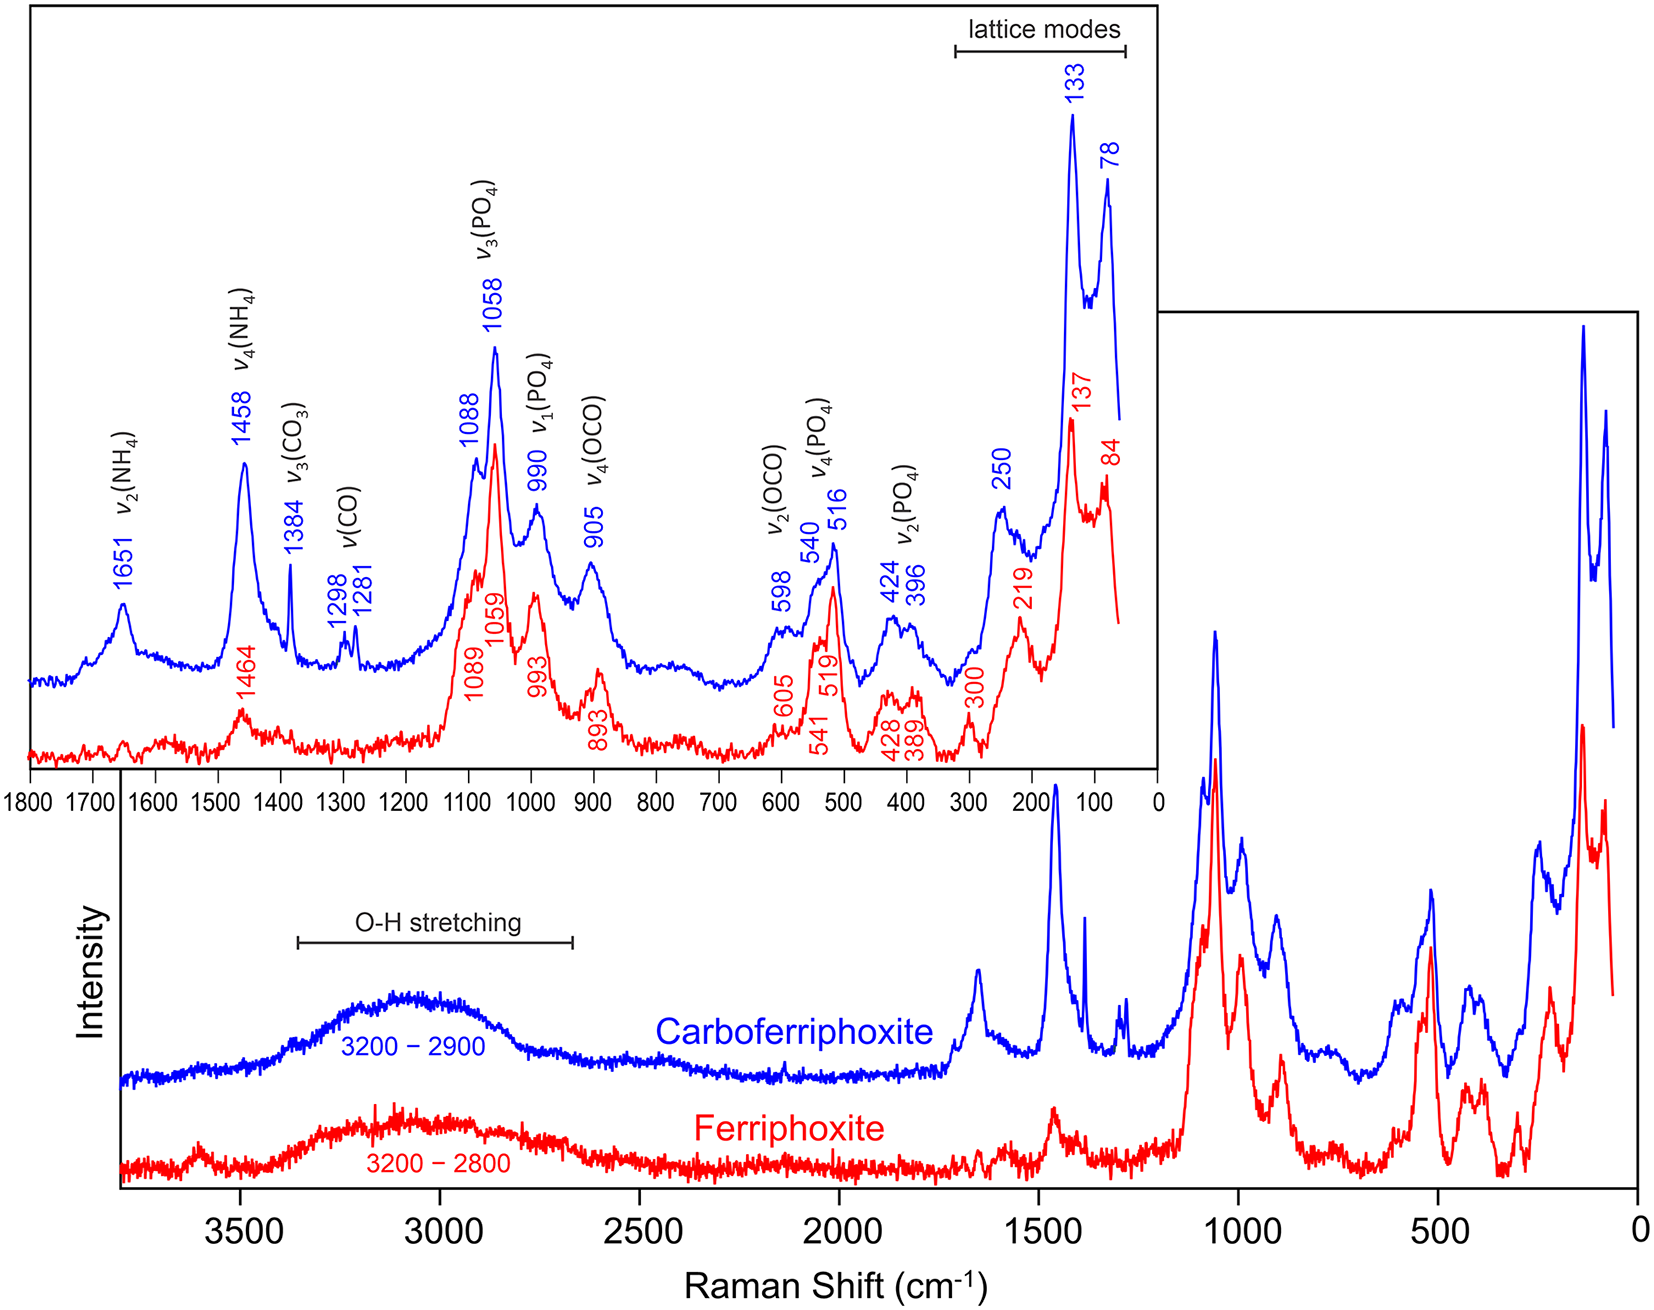
Raman spectroscopy for ferriphoxite and carboferriphoxite was done on a Horiba XploRA PLUS spectrometer. Both minerals are very sensitive to both the 532 and 785 nm lasers. We were able to obtain spectra from 3800 to 60 cm–1 using a 532 nm diode laser at 10% power (2 mW) using a 200 μm slit, an 1800 gr/mm diffraction grating and a 100× (0.9 NA) objective; however, the spectra exhibit significant noise. This, coupled with the complexities of the spectra, made definite interpretations for all bands difficult. The spectra are shown in Fig. 3 and are labelled with tentative mode assignments based on several references including Frost et al. (Reference Frost, Hales and Wain2008a, Reference Frost, Locke and Martens2008b, Reference Frost, Palmer and Pogson2011), Sergeeva et al. (Reference Sergeeva, Zhitova and Bocharov2019), Števko et al. (Reference Števko, Sejkora, Uher, Cámara, Škoda and Vaculovič2018) and Yakovenchuk et al. (Reference Yakovenchuk, Pakhomovsky, Konopleva, Panikorovskii, Bazai, Mikhailova, Bocharov, Ivanyuk and Krivovichev2018).
Raman spectra of ferriphoxite and carboferriphoxite.

Most of the features in the spectra result from phosphate and oxalate groups in the topologically equivalent chains in the structures; hence, the spectra are very similar. A difference of note is the very sharp band at 1384 cm–1 in the carboferriphoxite spectrum, which is not present in the ferriphoxite spectrum. This band is assignable to the ν3(CO3) antisymmetric stretching mode of the dihydrogen carbonate group, which is a component of the interstitial complex only in the carboferriphoxite structure.
Chemical analysis
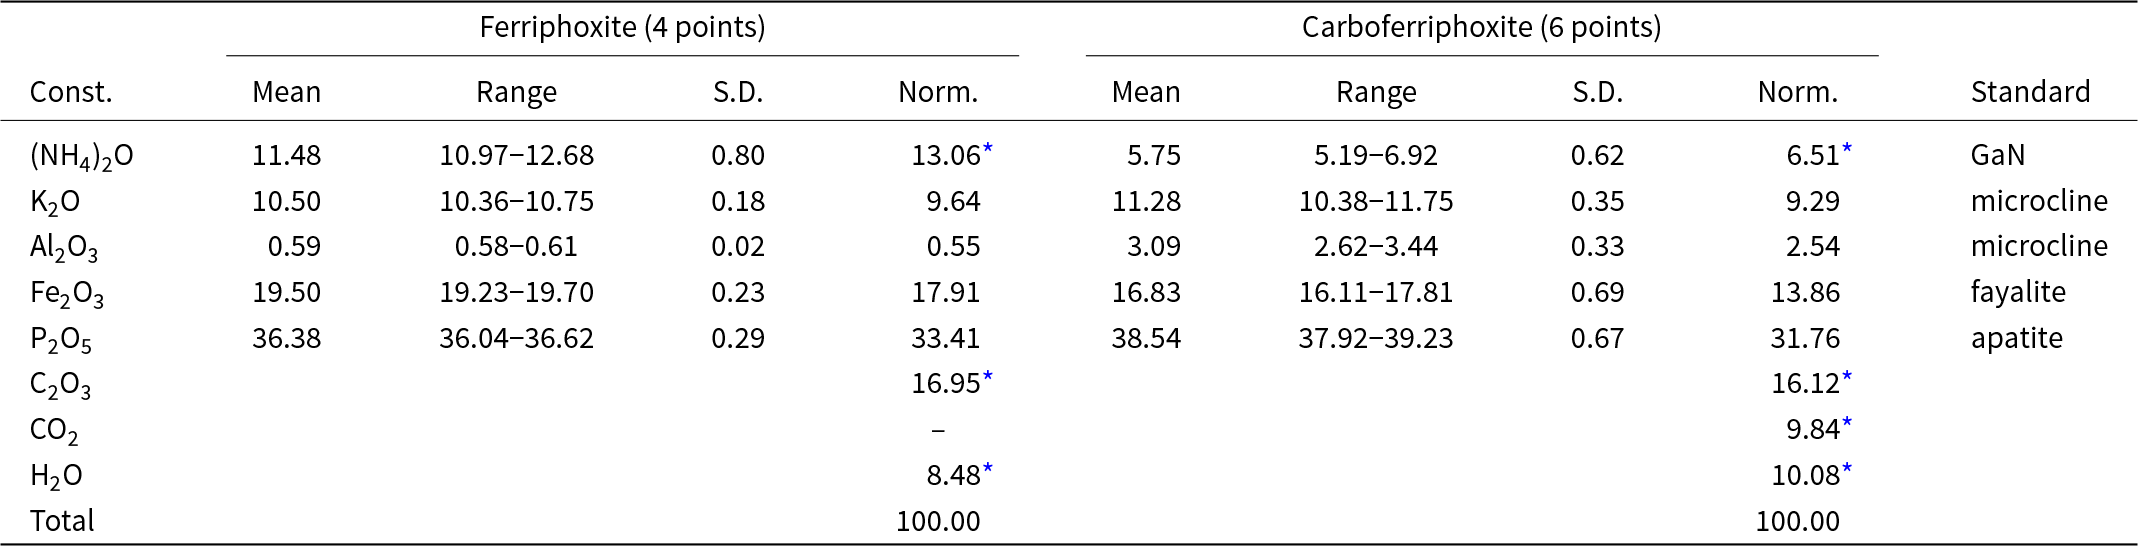
Analyses (4 points for ferriphoxite and 6 points for carboferriphoxite) were done at Caltech on a JEOL JXA-iHP200F field-emission electron microprobe (EPMA) in WDS mode. Analytical conditions were 15 kV accelerating voltage, 10 nA beam current and a focused beam. Because of the small size, thinness and fragility of the crystals, analysis had to be done on unpolished crystal faces. The focused beam was necessary because of the small size of the crystals. Significant beam damage occurred during analyses. Insufficient material is available for CHN analysis, so (NH4)2O, C2O3, CO2 and H2O are calculated based on the structure (O = 13 and P = 2 apfu for ferriphoxite; O = 15 and P = 2 apfu for carboferriphoxite). The loss of volatile constituents resulted in much higher concentrations for the remaining constituents than are to be expected; therefore, the other analysed constituents have been normalised to provide a total of 100% when combined with the calculated constituents. Analytical data are given in Table 1.
Analytical data (wt.%) for ferriphoxite and carboferriphoxite

* Calculated based on the structures (ferriphoxite: O = 13 and P = 2; carboferriphoxite: O = 15 and P = 2).
S.D. – standard deviation.
The empirical formulas for ferriphoxite (for O = 13 apfu) and carboferriphoxite (for O = 15 apfu) are {[(NH4)2.13K0.87]Σ3.00(H2O)}{(Fe3+0.95Al0.05)Σ1.00(HPO4)2(C2O4)} and {[(NH4)1.12K0.88]Σ2.00(H2CO3)}{(Fe3+0.78Al0.22)Σ1.00(HPO4)(H2PO4)(C2O4)}, respectively. The ideal formula for ferriphoxite is [(NH4)2K(H2O)][Fe3+(HPO4)2(C2O4)], which requires (NH4)2O 12.14, K2O 10.98, Fe2O3 18.61, P2O5 33.09, C2O3 16.79, H2O 8.40, total 100 wt.%. The ideal formula for carboferriphoxite is [(NH4)K(H2CO3)][Fe3+(HPO4)(H2PO4)(C2O4)], which requires (NH4)2O 5.71, K2O 10.33, Fe2O3 17.51, P2O5 31.13, C2O3 15.79, CO2 9.65, H2O 9.88, total 100 wt.%.
X-ray crystallography
Powder X-ray studies were done using a Rigaku R-Axis Rapid II curved imaging plate microdiffractometer with monochromatised MoKα radiation. A Gandolfi-like motion on the φ and ω axes was used to randomise the sample. Observed d values and intensities were derived by profile fitting using JADE Pro software (Materials Data, Inc.). The powder data for ferriphoxite and carboferriphoxite are presented in Supplementary Tables 1 and 2, respectively. Unit-cell parameters refined from the powder data using JADE Pro with whole pattern fitting are a = 11.357(17), b = 6.363(17), c = 18.818(17), β = 103.60(5)°, V = 1322(4) Å3 and Z = 4 for ferriphoxite (space group P21/c) and a = 6.422(3), b = 9.394(3), c = 11.889(3)Å, α = 95.950(17), β = 91.852(15), γ = 100.525(17)°, V = 700.4(4)Å3 and Z = 2 for carboferriphoxite (space group P  $\bar 1$).
Single-crystal X-ray studies were done using a Bruker D8 three-circle diffractometer equipped with a rotating anode generator, monochromatised MoKα radiation, multilayer optics and an APEX-II CCD area detector. Empirical absorption corrections (SADABS) were applied and equivalent reflections were merged. The structures were solved using SHELXT (Sheldrick, Reference Sheldrick2015a). Refinement proceeded by full-matrix least-squares on F 2 using SHELXL-2016 (Sheldrick, Reference Sheldrick2015b).
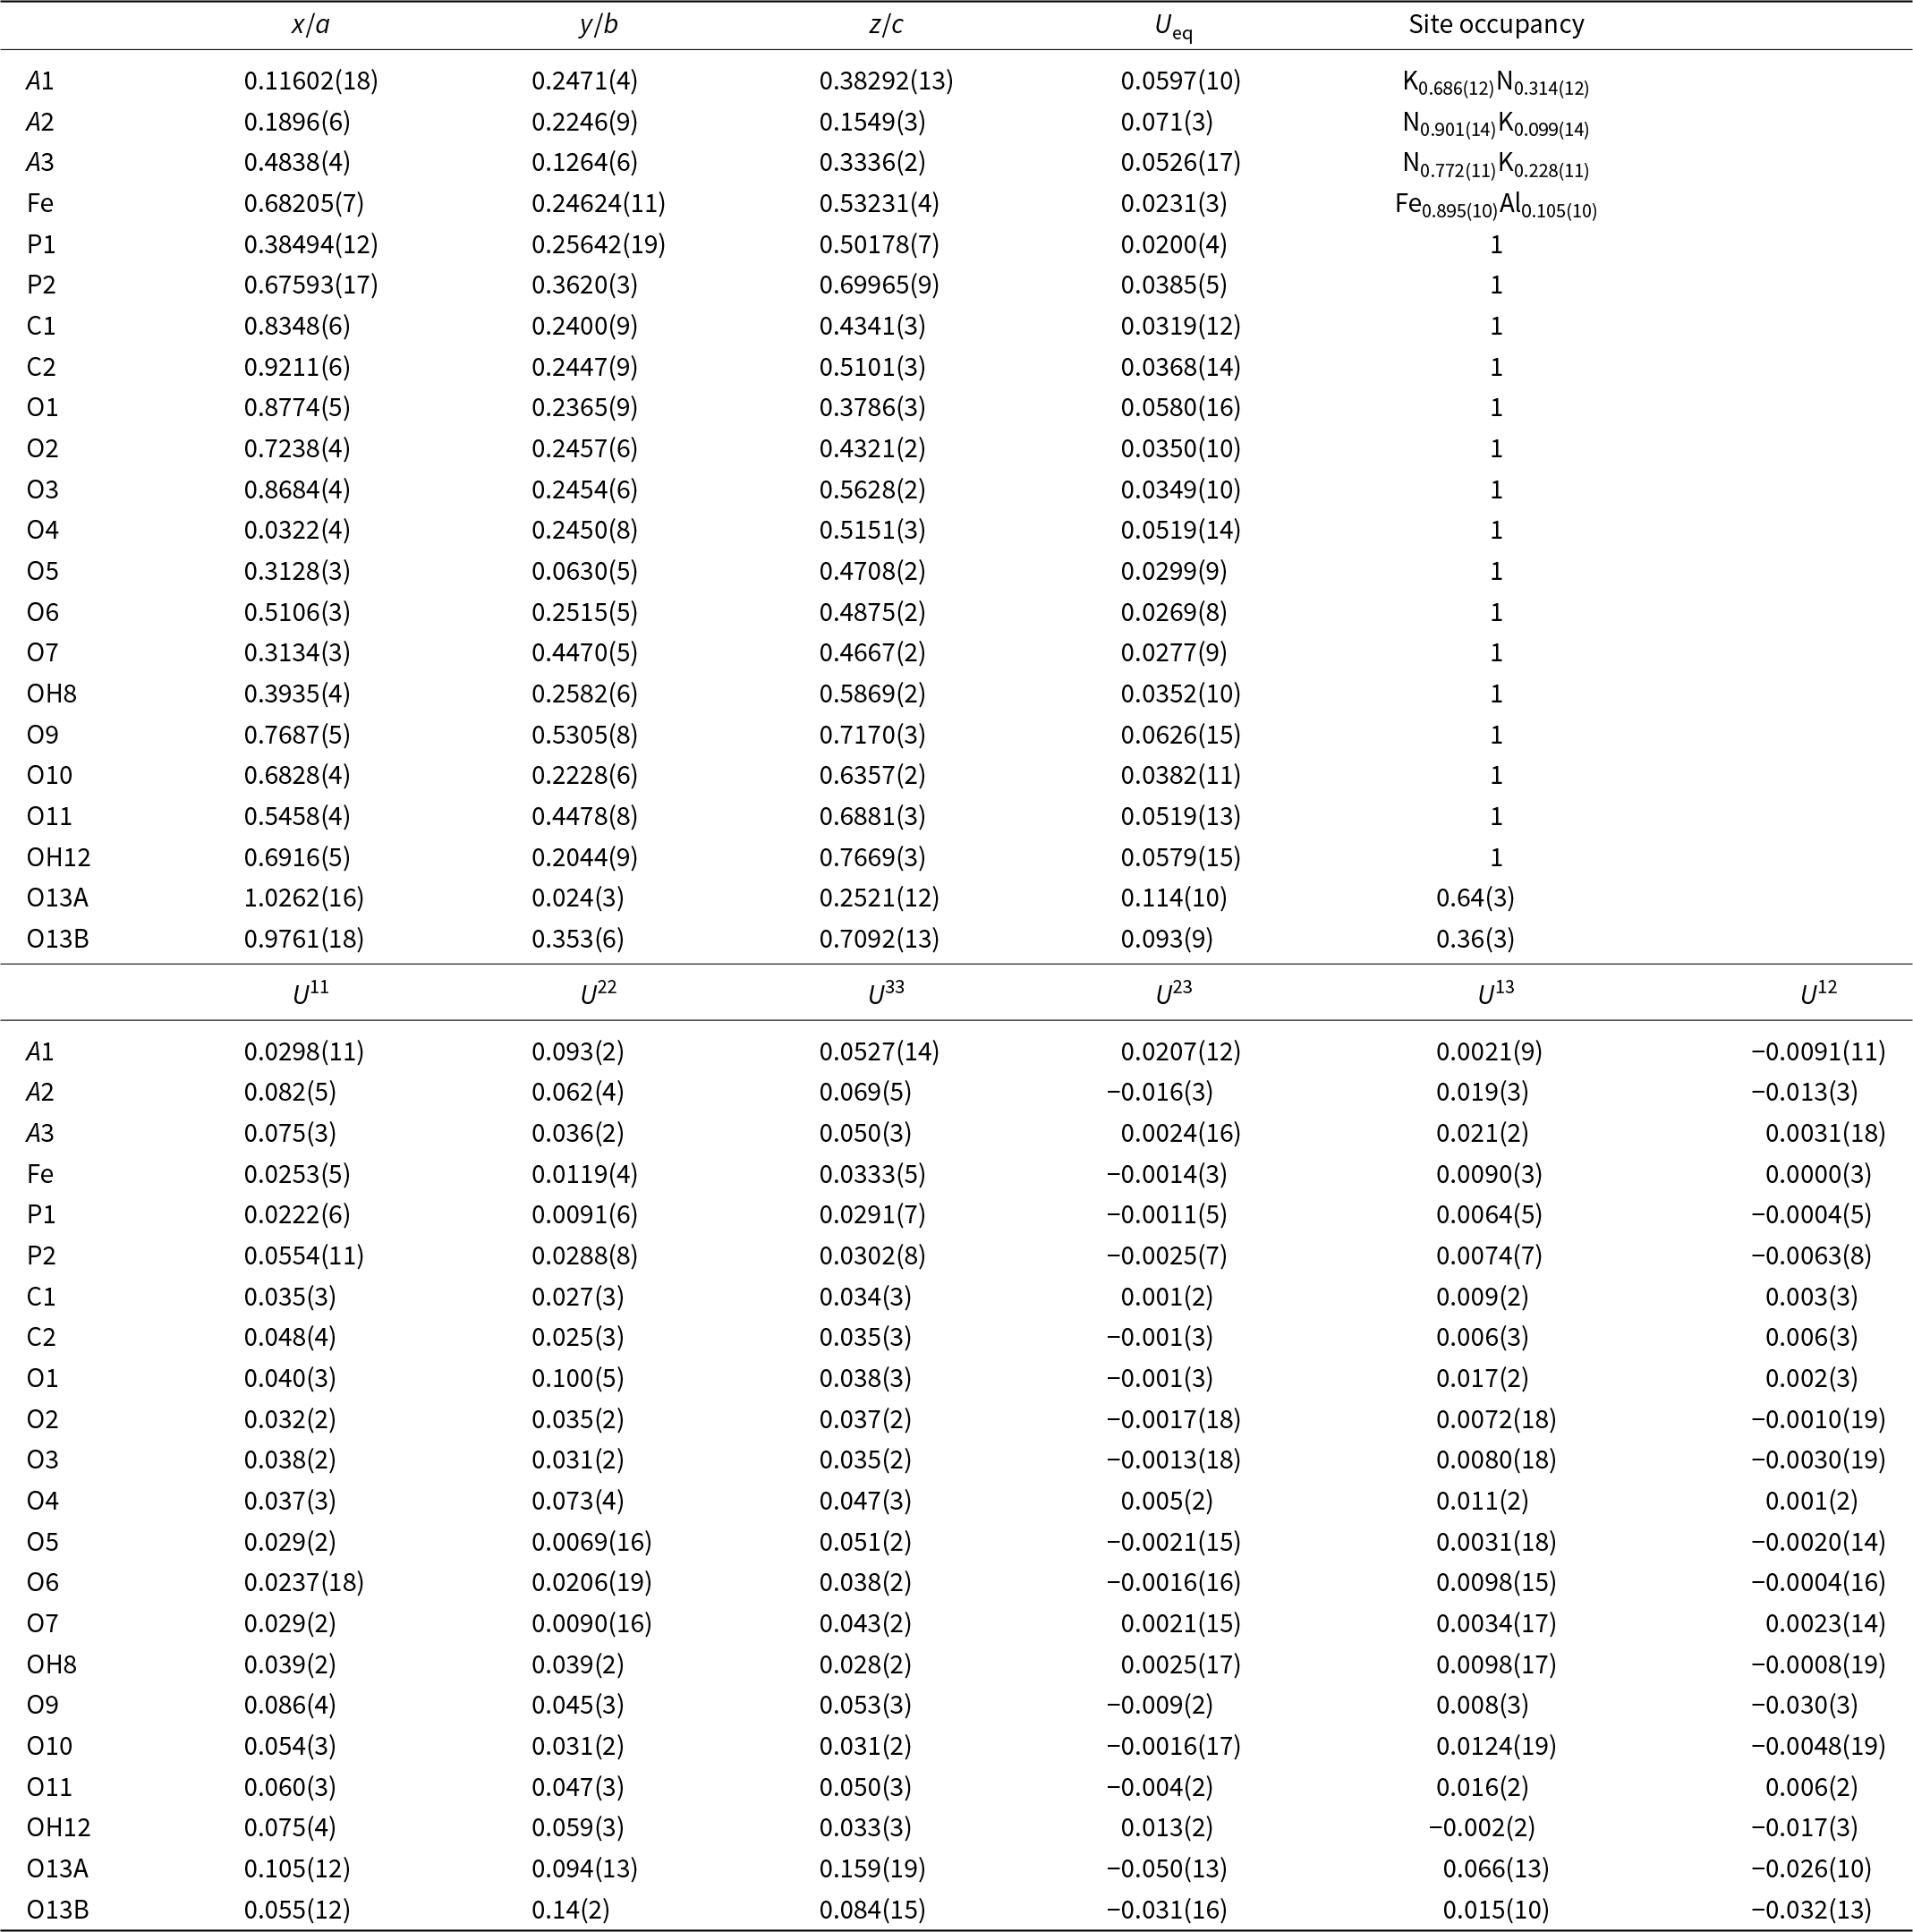
For ferriphoxite, 11507 reflections were integrated using 38 s frames with a 0.2° frame width. Systematically absent reflections are consistent with the space group P21/c. All atoms were refined with anisotropic displacement parameters. H atom sites could not be reliably extracted from the difference-Fourier map. The three large cation sites were modelled with coupled K and N (NH4) scattering factors. One was found to be dominated by K and the other two by N. The Fe site exhibited less scattering than expected for Fe alone, so it was modelled with coupled Fe and Al. One O site corresponding to an H2O group was found to be split into two sites 1.20 Å apart; the joint occupancies were refined to total one O apfu. Two P, two C and the remaining 12 O sites refined well at full occupancies.
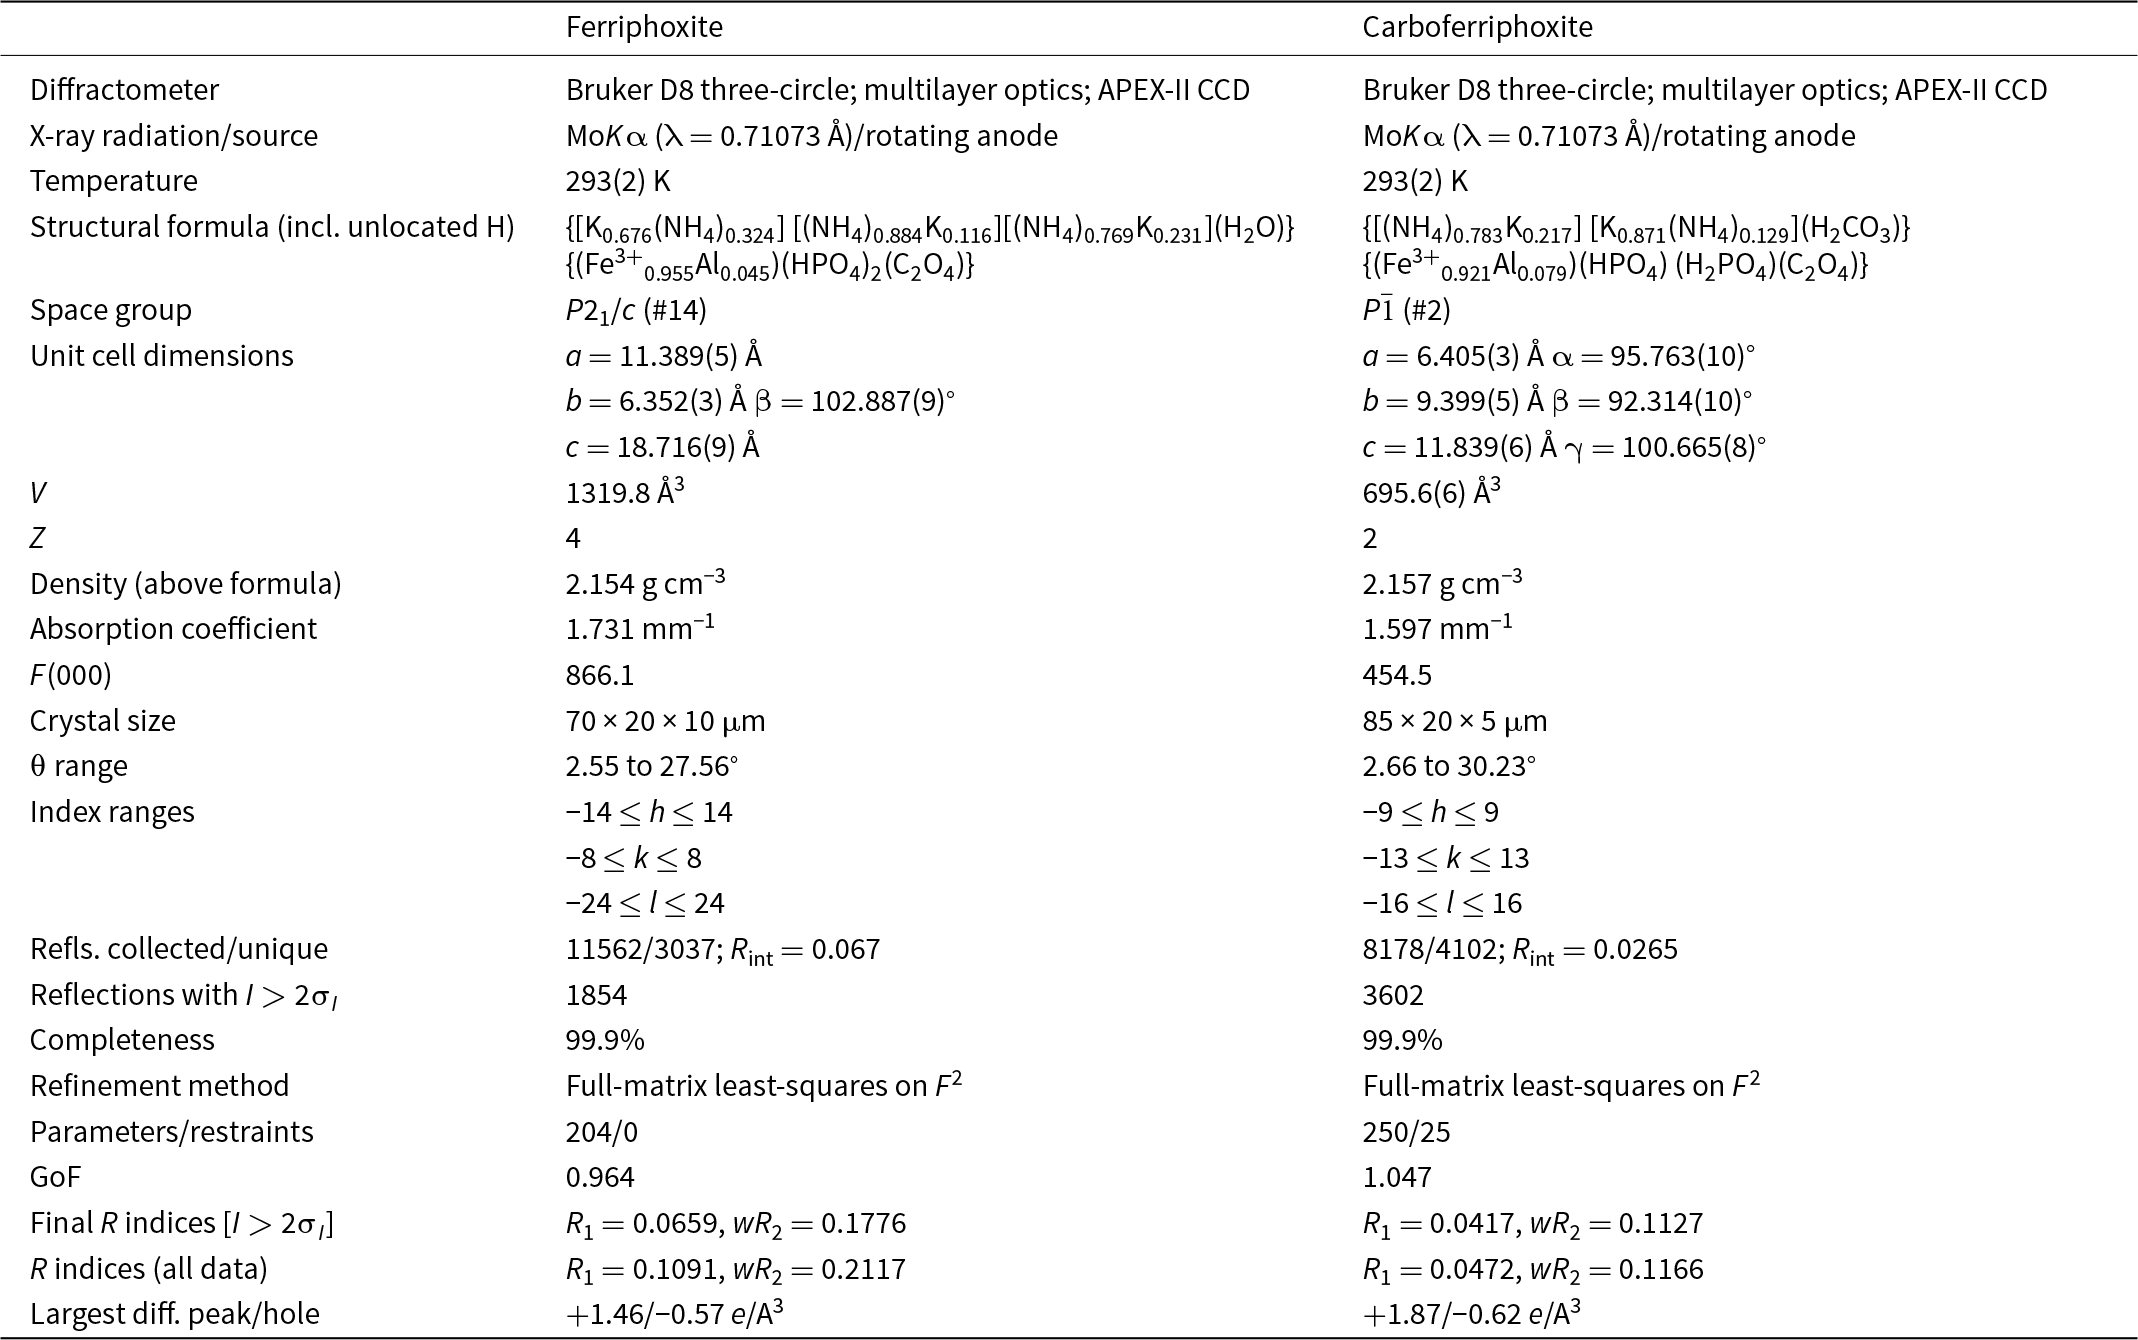
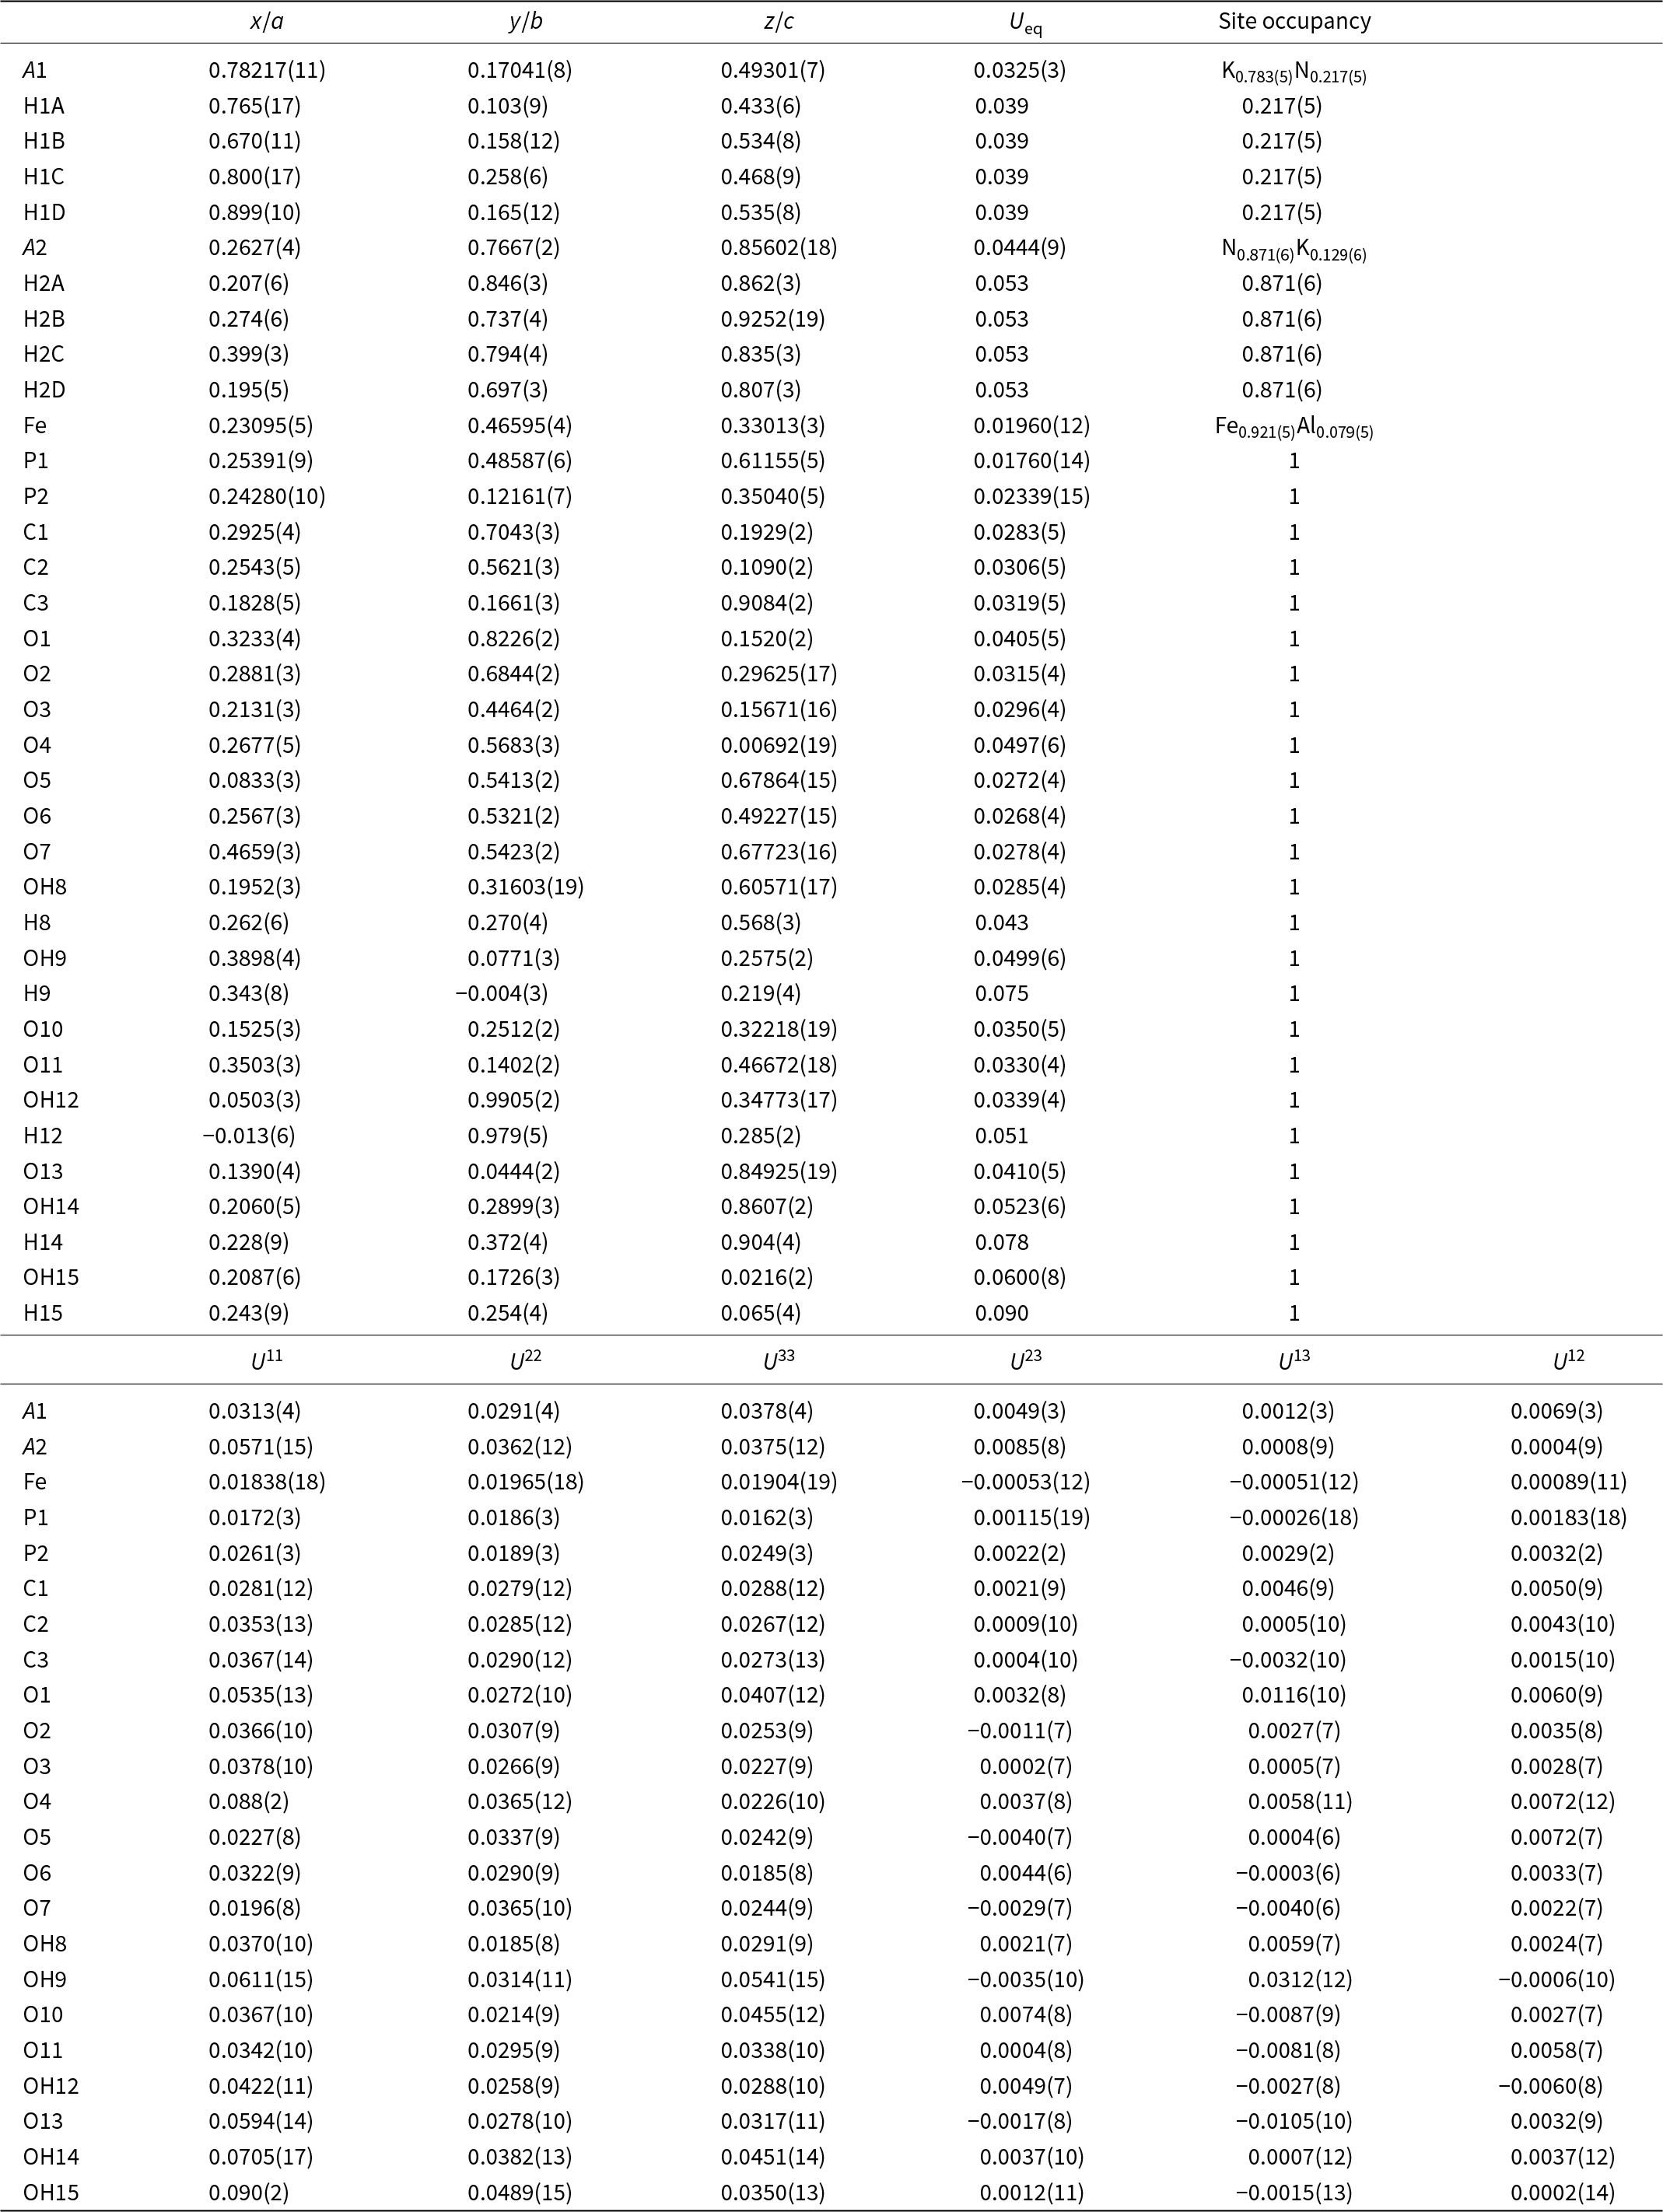
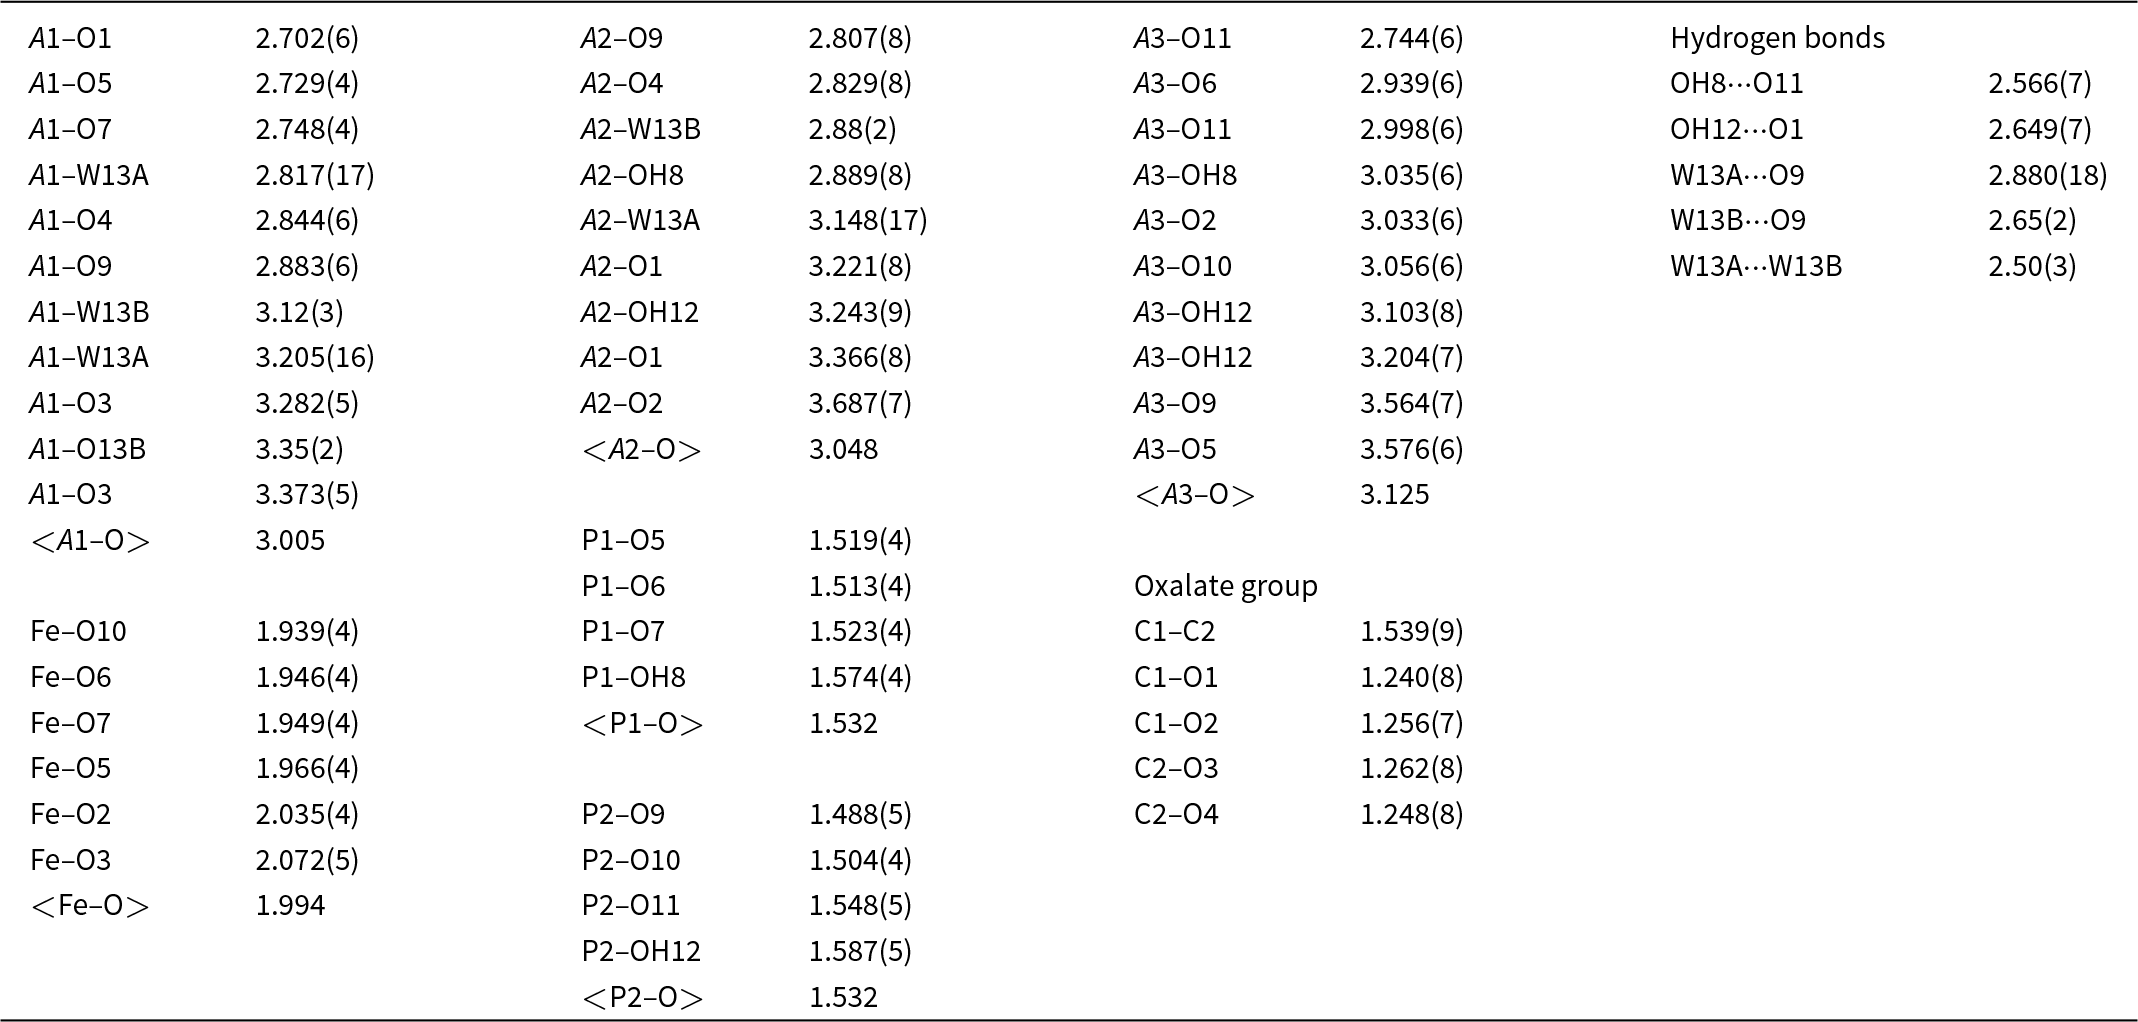
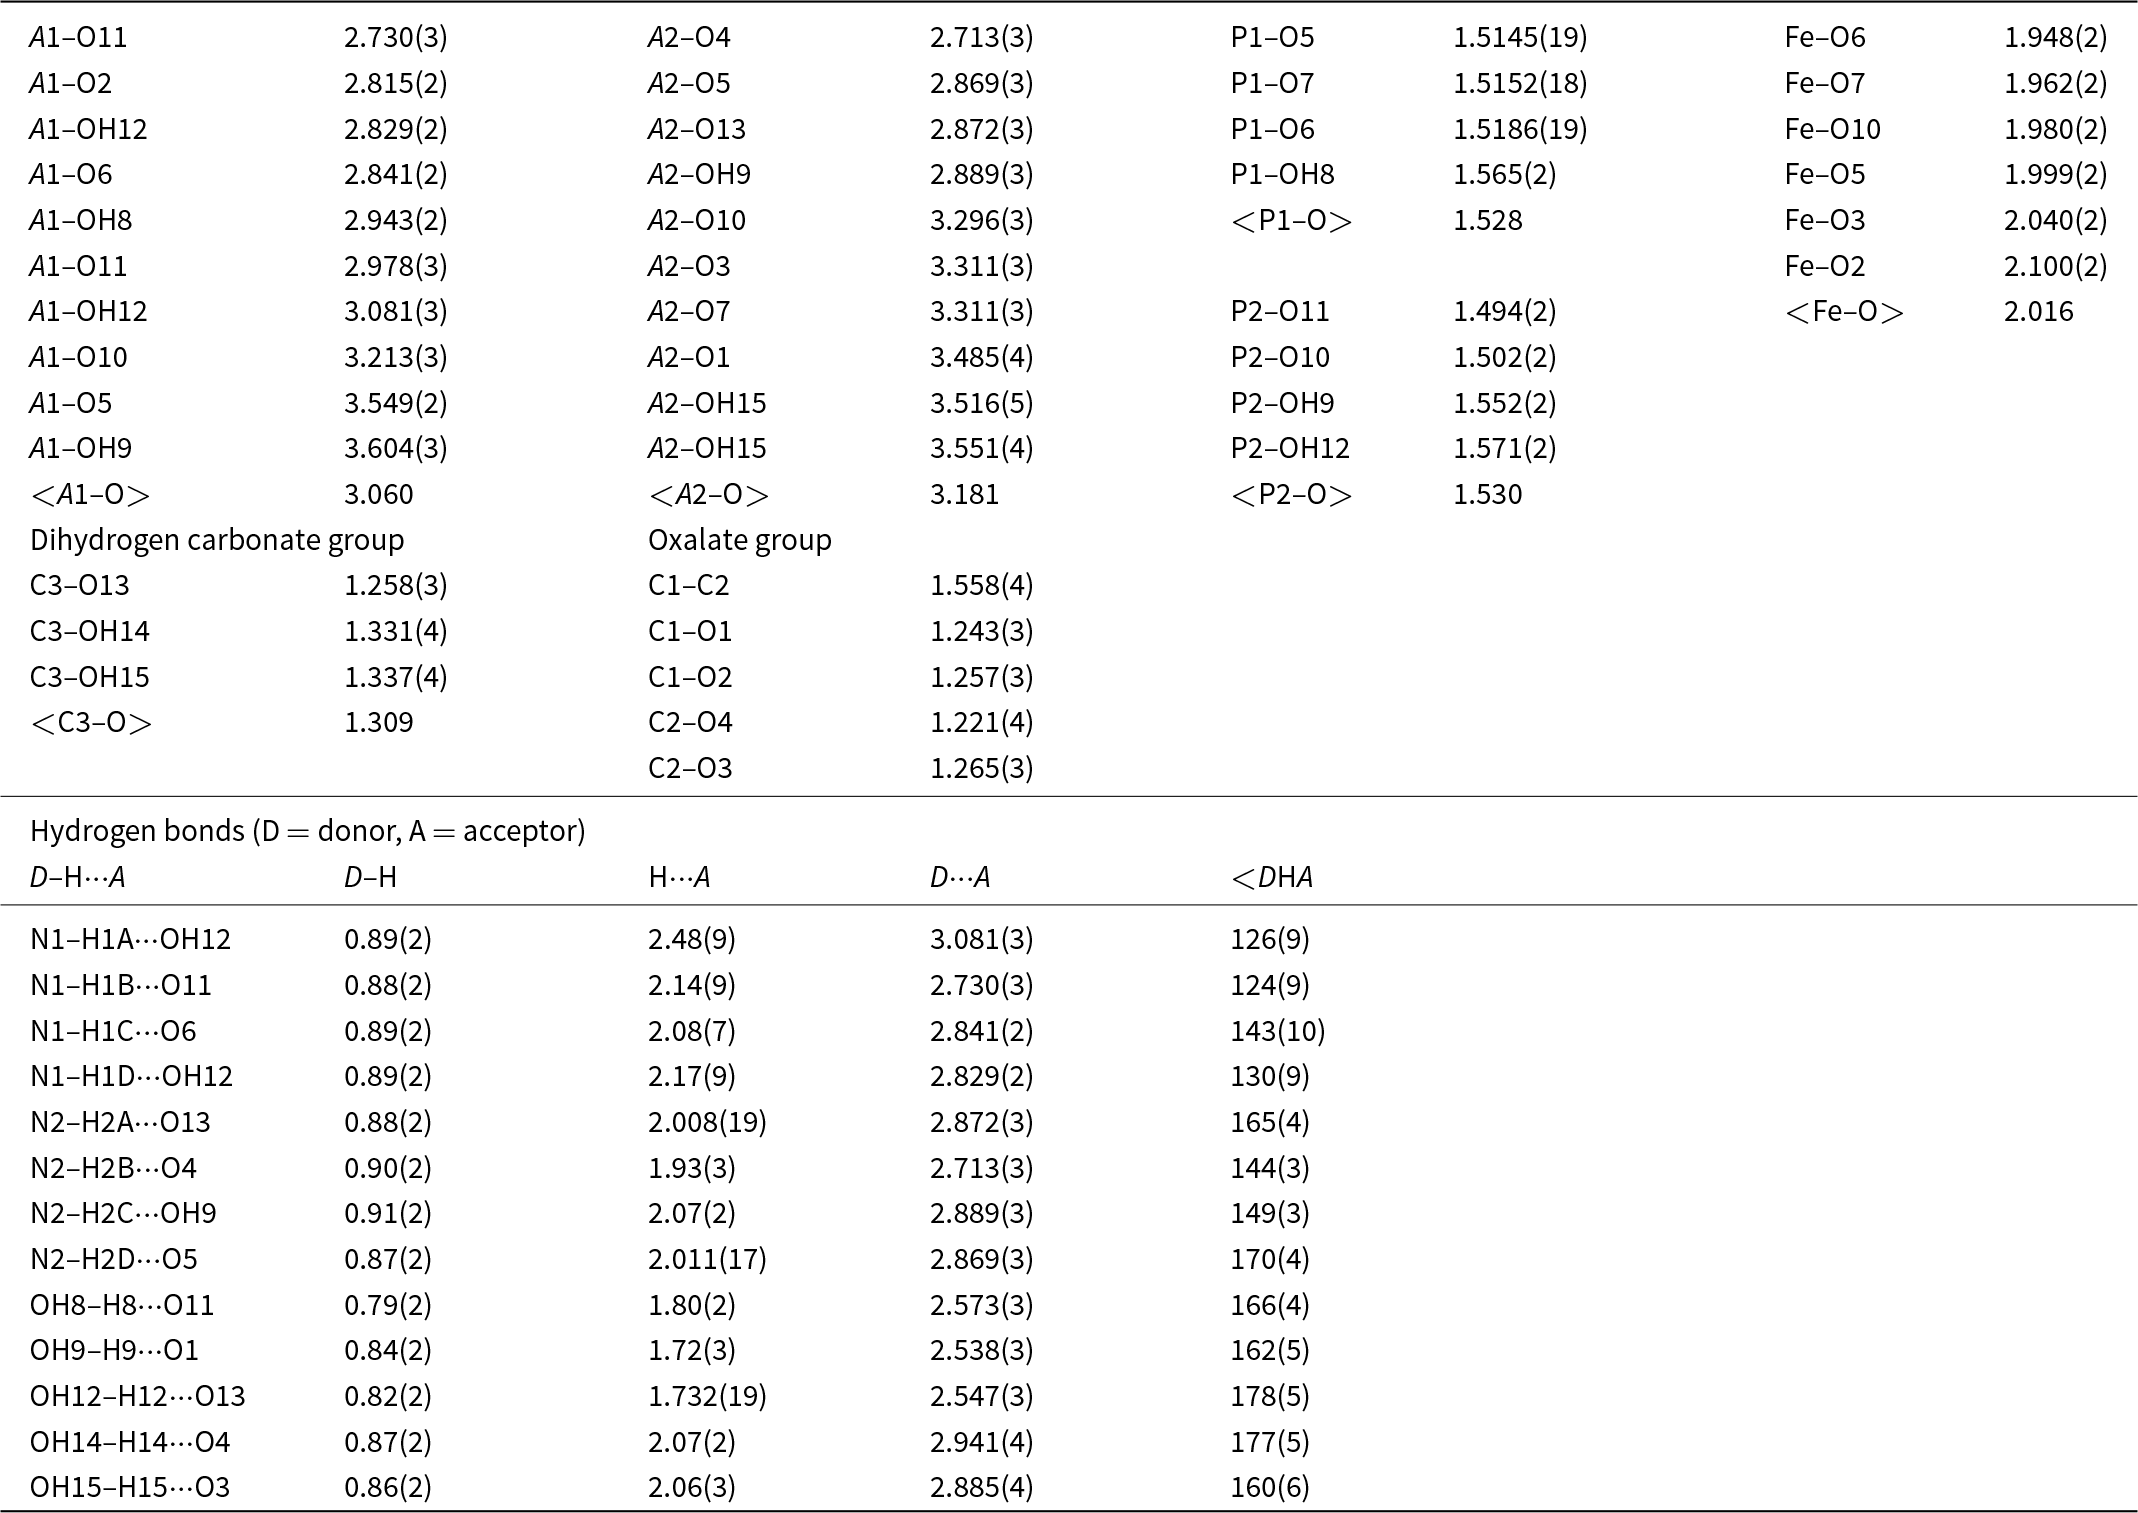
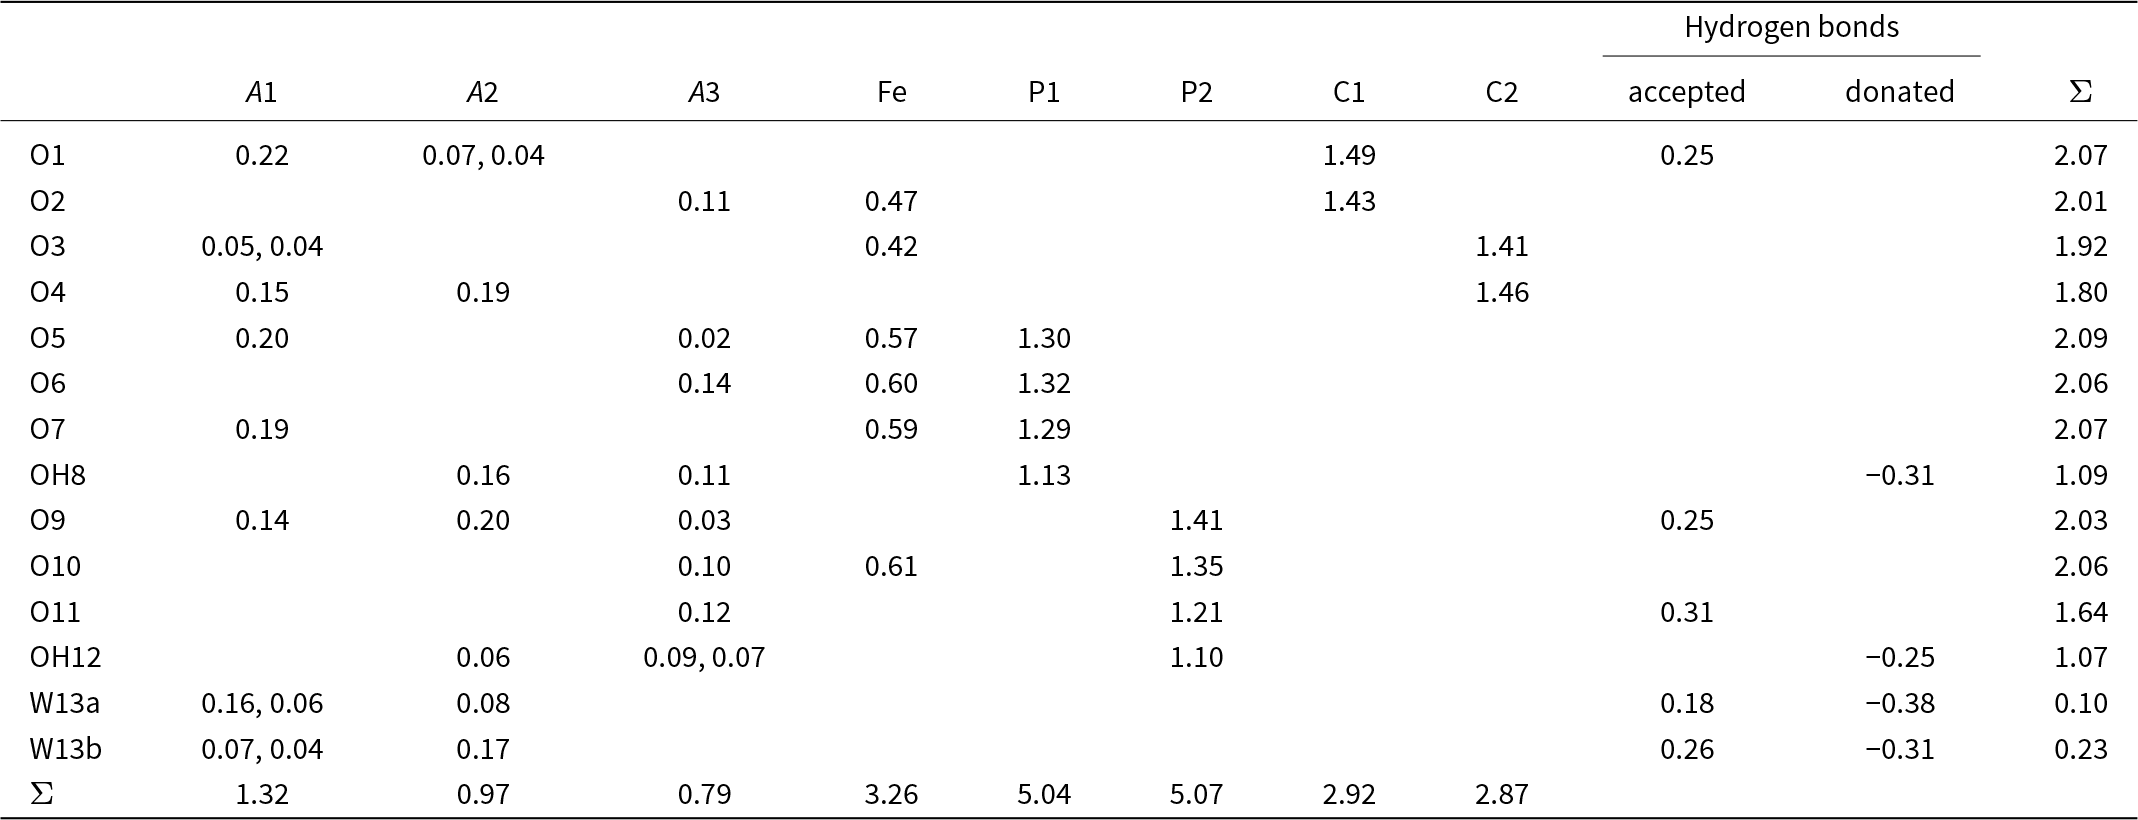
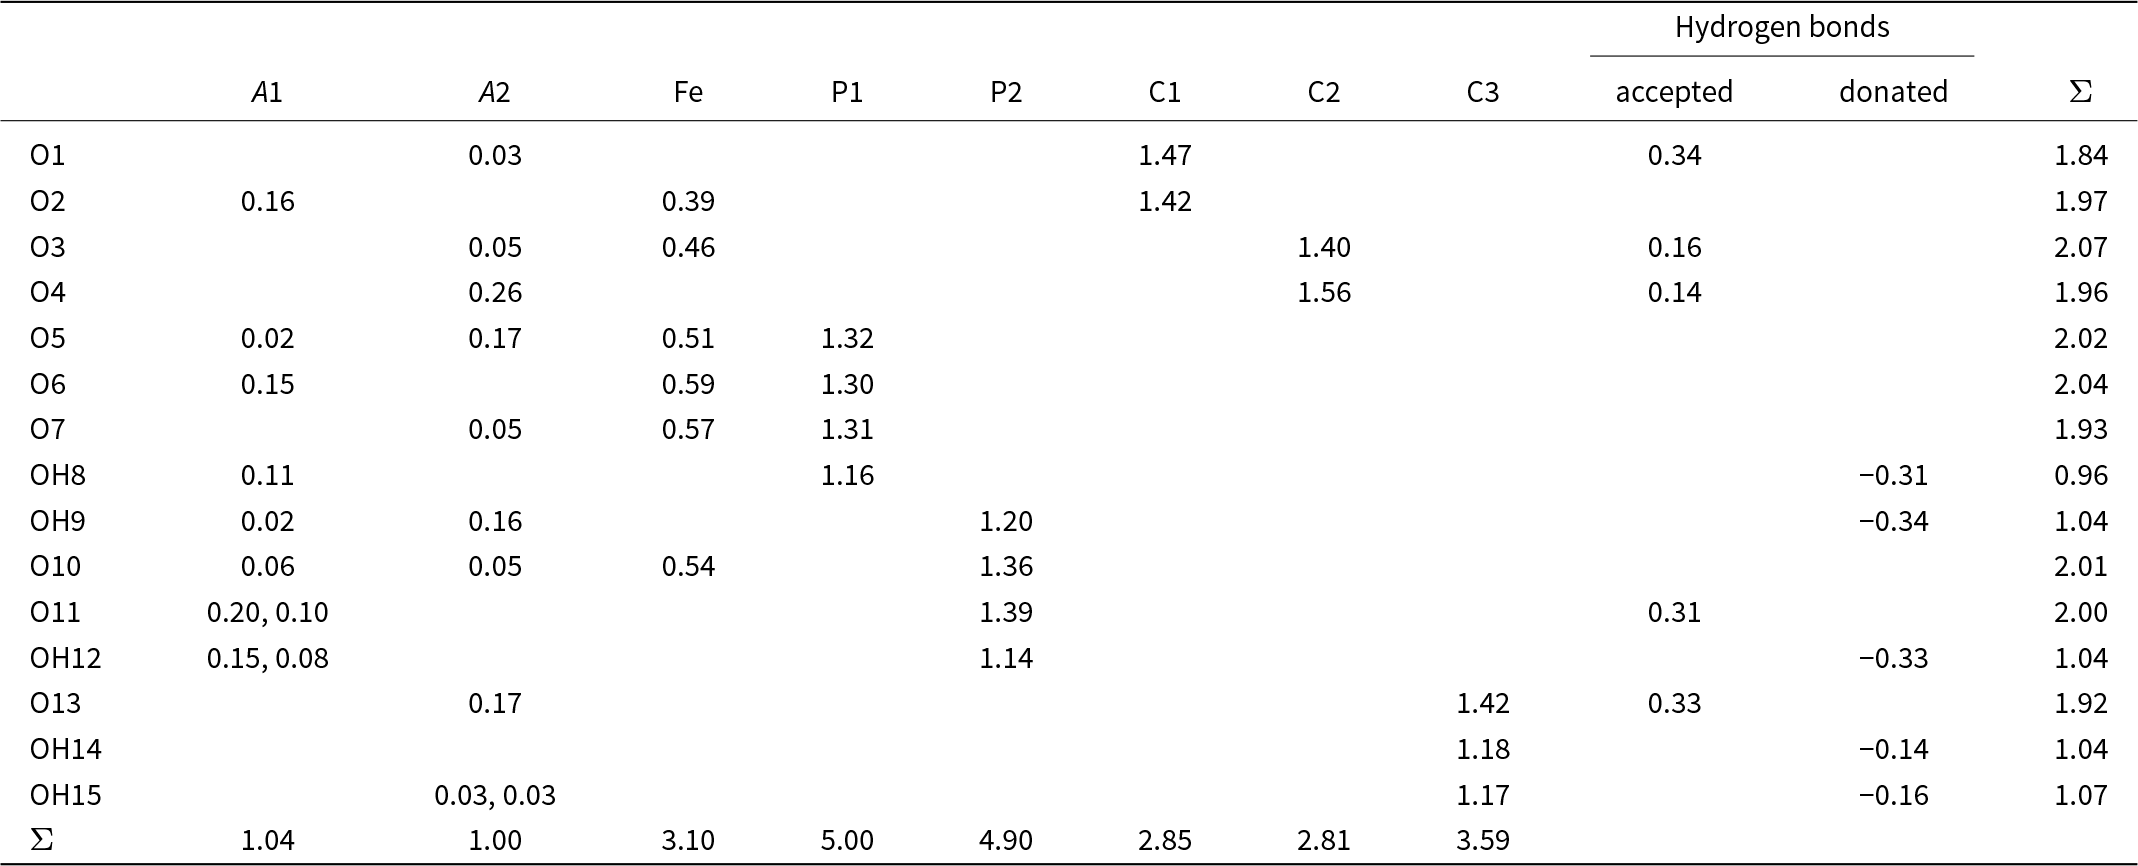
Data collection and refinement details are given in Table 2. Atom coordinates, displacement parameters and site occupancies for ferriphoxite and carboferriphoxite are given in Tables 3 and 4, respectively, selected bond distances and angles for ferriphoxite and carboferriphoxite are given in Tables 5 and 6, respectively, and bond-valence analyses in Tables 7 and 8, respectively. The crystallographic information file has been deposited with the Principal Editor of Mineralogical Magazine and is available as Supplementary material (see below).
Data collection and structure refinement details for ferriphoxite and carboferriphoxite

R int = Σ|F o2-F o2(mean)|/Σ[F o2]. GoF = S = {Σ[w(F o2–F c2)2]/(n–p)}1/2. R 1 = Σ||F o|-|F c||/Σ|F o|. wR 2 = {Σ[w(F o2–F c2)2]/Σ[w(F o2)2]}1/2; w = 1/[σ2(F o2) + (aP)2 + bP] where P is [2F c2 + Max(F o2,0)]/3; for ferriphoxite a is 0.1391 and b is 1.4053 and for carboferriphoxite a is 0.0623 and b is 0.7335.
Atom positions, displacement parameters and site occupancies for ferriphoxite

Atom positions, displacement parameters and site occupancies for carboferriphoxite

Selected bond lengths (Å) for ferriphoxite

Selected bond lengths (Å) and angles (°) for carboferriphoxite

For carboferriphoxite, 8178 reflections were integrated using 32 s frames with a 0.2° frame width. The crystal had a small satellite domain rotated ∼4.5° from primary domain, which led to spot splitting and additional resolved shadow spots. The best refinement was obtained by ignoring the satellite reflections. The two large cation sites were modelled with coupled K and N (NH4) scattering factors. One is dominated by K and the other by N. The Fe site exhibited less scattering than expected for Fe alone, so it was modelled with coupled Fe and Al. Two P, three C and 15 O sites refined well at full occupancies. All H atom sites were extracted from the difference-Fourier map. The OH H sites were refined with O–H distances restrained to 0.82(2) Å and with U isoH = 1.5U eq(OH). The NH4 H sites were refined with O–H distances restrained to 0.90(2) Å, with U isoH = 1.2U eq(N) and with H occupancies equal to the corresponding N occupancy.
Bond valences analysis for ferriphoxite. Values are in valence units (vu)

Bond-valence parameters for NH4+–O are from Garcia-Rodriguez et al. (Reference García-Rodríguez, Á., Piñero and González-Silgo2000); all others are from Gagné and Hawthorne (Reference Gagné and F.C2015). Hydrogen-bond valences are based on O–O bond lengths from Ferraris and Ivaldi (Reference Ferraris and Ivaldi1988). Negative values indicate donated hydrogen-bond valence. Bond-valence values are based on refined occupancies.
Bond valences analysis for carboferriphoxite. Values are in valence units (vu)

NH4+ is treated as a spherical cation and bond-valence parameters for NH4+–O are from Garcia-Rodriguez et al. (Reference García-Rodríguez, Á., Piñero and González-Silgo2000); all others are from Gagné and Hawthorne (Reference Gagné and F.C2015). Hydrogen-bond valences are based on O–O bond lengths from Ferraris and Ivaldi (Reference Ferraris and Ivaldi1988). Negative values indicate donated hydrogen-bond valence. The cation sites were modelled using refined occupancies.
Descriptions of the structures
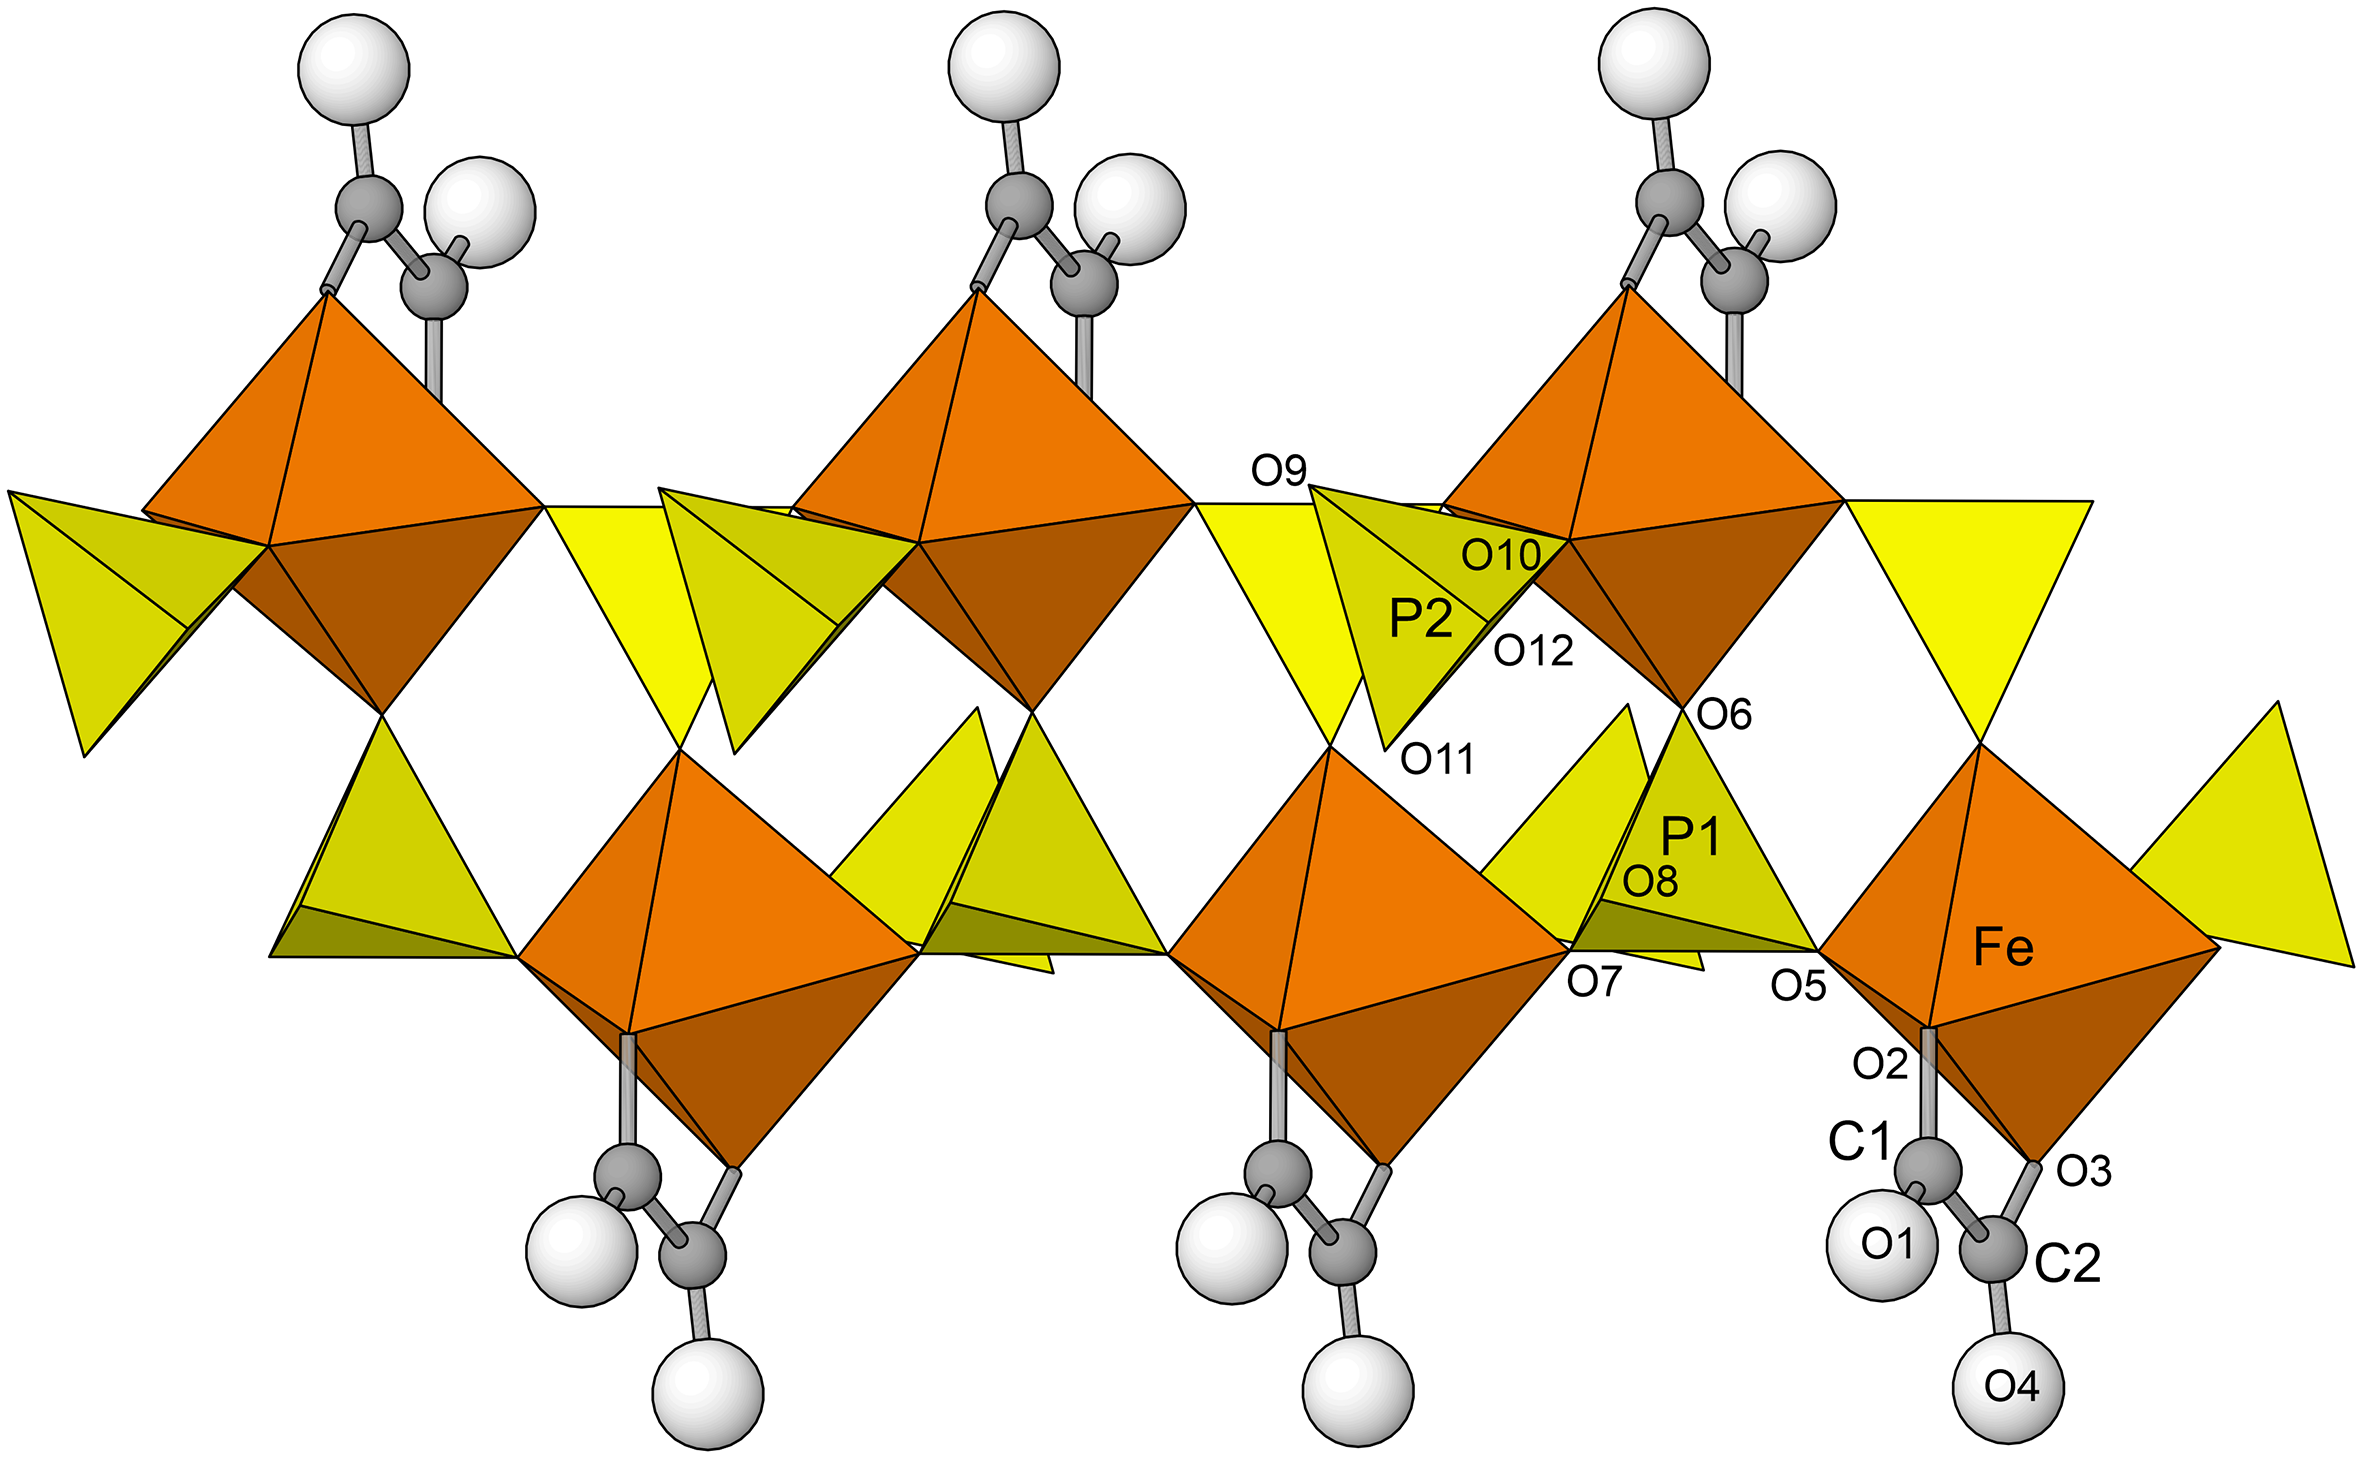
The structural units in the structures of both ferriphoxite and carboferriphoxite are topologically identical double-strand chains of corner-sharing Fe3+O6 octahedra and P1O3OH tetrahedra that are decorated by P2O3OH tetrahedra and C2O4 groups in ferriphoxite and by P2O2(OH)2 tetrahedra and C2O4 groups in carboferriphoxite (Fig. 4). The chain in ferriphoxite with the formula [Fe3+(C2O4)(PO3OH)2]3– and that in carboferriphoxite with the formula [Fe3+(C2O4)(HPO4)(H2PO4)]2– are also topologically identical to the [Al(C2O4)(PO3OH)2]3– chains in thebaite-(NH4) and dendoraite-(NH4), which occur in the same mineral assemblage at the Rowley mine.
The chain along [010] in ferriphoxite and along [100] in carboferriphoxite. Hydrogen atoms for carboferriphoxite are not shown.

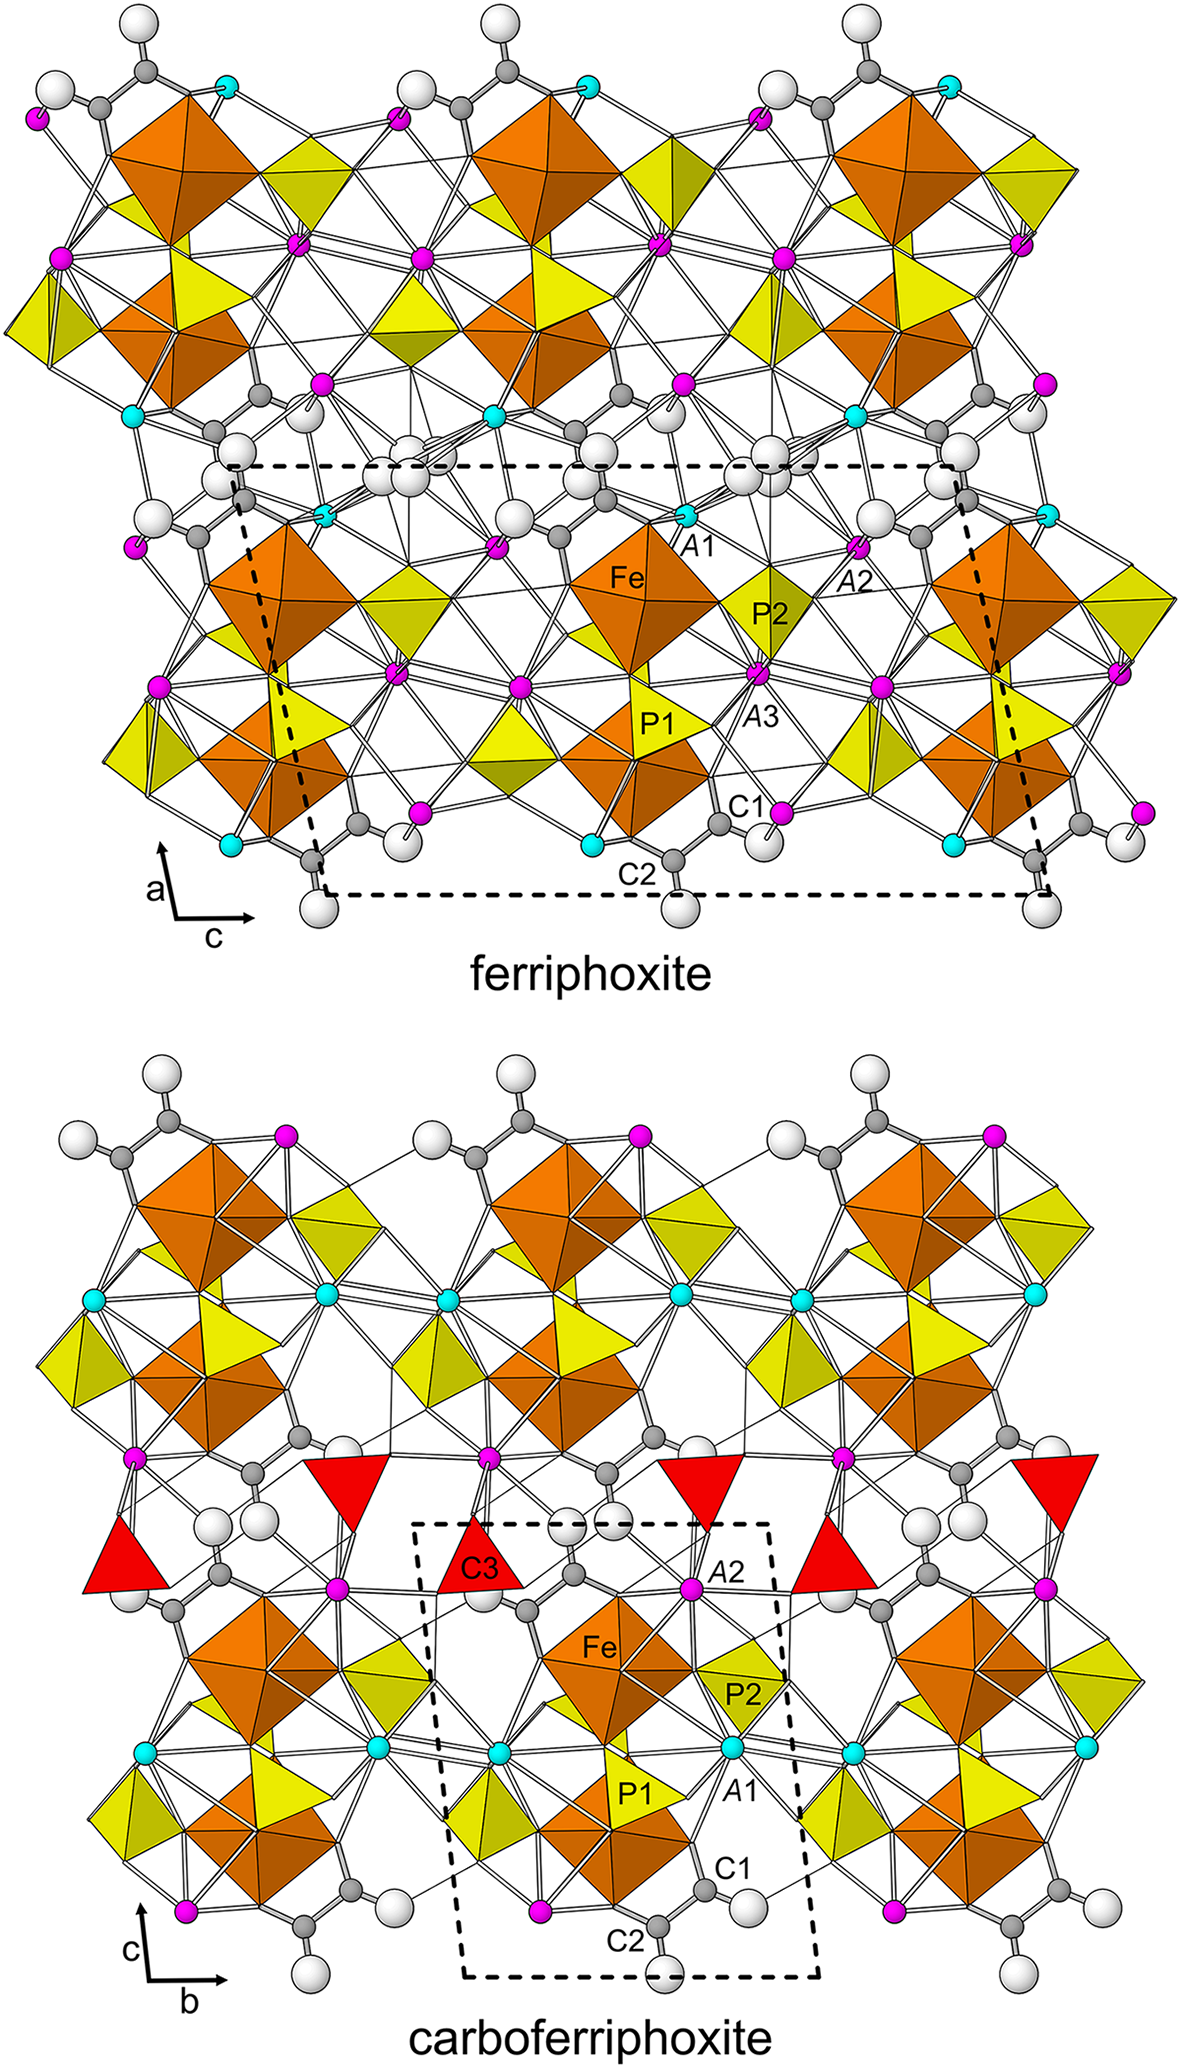
The interstitial complex in the ferriphoxite structure includes three large monovalent cation sites: the nine-coordinated A1 site (K0.686N0.314), the eight-coordinated A2 site (N0.901K0.099) and the ten-coordinated A3 site (N0.772K0.228). Bonds between O atoms in the structural units and K+ and NH4+ cations at the A1, A2 and A3 sites link the structure in three dimensions. A disordered H2O group (W13A and W13B) in the interstitial complex is coordinated to cations at the A1 and A2 sites. The interstitial complex in the carboferriphoxite structure includes two large ten-coordinated monovalent cation sites: A1 (K0.783N0.217) and A2 site (N0.871K0.129). Bonds between O atoms in the structural units and K+ and NH4+ cations in the A1 and A2 sites link the structure in three dimensions. An H2CO3 group in the interstitial complex is coordinated to cations at the A2 site and forms hydrogen bonds to the C2O4 group. Both structures are shown in Fig. 5.
The structures of ferriphoxite and carboferriphoxite. White balls are O atoms. The K-dominant A sites are turquoise and the NH4-dominant A sites are pink. H atoms for carboferriphoxite are not shown. Thin black lines are hydrogen bonds. The unit cell outline is shown with dashed lines. The figures were created using ATOMS, version 6.5 (Shape Software, Kingsport, Tennessee, USA).

Supplementary material
The supplementary material for this article can be found at https://doi.org/10.1180/mgm.2024.56.
Acknowledgements
Two anonymous reviewers are thanked for constructive comments, which improved the manuscript. Mark Cooper is thanked for collecting the structure data. Ed Davis, current contractor of the Rowley mine, is thanked for allowing underground access for the study of the occurrence and the collecting of specimens. The EPMA was carried out at the Caltech GPS Division Analytical Facility, which is supported, in part, by NSF Grant EAR-2117942. This study was funded by the John Jago Trelawney Endowment to the Mineral Sciences Department of the Natural History Museum of Los Angeles County and by a Canada Foundation for Innovation grant to FCH which funded the rotating-anode diffractometer.
Competing interests
The authors declare none.