I. INTRODUCTION
Over the past decade, there has been an increased interest in the fabrication of chemiresistive-type biosensors that have the ability to selectively detect the binding of label-free biomolecules through a mechanism in which device resistivity changes upon bioconjugation.Reference Cui, Wei, Park and Lieber1–Reference Lieber6 Surface functionalized nanowires (NWs) are ideal active elements for such biosensors due to their high surface-to-volume ratio.Reference Shao, Ma and Lee5, Reference Lieber6 In terms of materials systems, silicon (Si) and silicon carbide (SiC) are attractive semiconductors for inclusion in biosensing devices due to their electronic properties,Reference Cui, Wei, Park and Lieber1, Reference Patolsky, Zheng and Lieber2, Reference Lieber6, Reference Yakimova, Petoral, Yazdi, Vahlberg, Lloyd Spetz and Uvdal7 biocompatibility,Reference Cui, Wei, Park and Lieber1–Reference Kim, Junkin, Kim, Kwon, Shin, Wong and Gale4, Reference Petoral, Yazdi, Lloyd Spetz, Yakimova and Uvdal8, Reference Williams, Davydov, Motayed, Sundaresan, Bocchini, Richter, Stan, Steffens, Zangmeister, Schreifels and Rao9 and ability for selective functionalization toward specific analytes.Reference Cui, Wei, Park and Lieber1–Reference Kim, Junkin, Kim, Kwon, Shin, Wong and Gale4, Reference Petoral, Yazdi, Lloyd Spetz, Yakimova and Uvdal8, Reference Williams, Davydov, Motayed, Sundaresan, Bocchini, Richter, Stan, Steffens, Zangmeister, Schreifels and Rao9
For developing semiconductor NW-based devices that directly sense the binding of biomolecules through resistivity changes, an analyte-specific functionalization of the NW surface is necessary. An understanding of the mechanisms by which the functional and analyte molecules bind to the surface is essential for device fabrication and usage. Herein, we have presented a solution-based sequential layer functionalization method for streptavidin (SA) protein immobilization on Si and SiC NWs. This method combines the protocol for SA bioconjugation to SiC planar surfacesReference Williams, Davydov, Motayed, Sundaresan, Bocchini, Richter, Stan, Steffens, Zangmeister, Schreifels and Rao9 with the “in-suspension” biofunctionalization of NWs developed for attaching DNA to gold (Au) NWs.Reference Sioss, Stoermer, Sha and Keating10 An advantage of this technique is the flexibility afforded for instituting parallel protein-specific functionalization of separate NW batches, which enables the assembly of multifunctionalized NW arrays on a single biosensing chip.
Each step of the solution-based functionalization method, which included 3-aminopropyltriethoxysilane (APTES) functionalization, biotinylation, and protein immobilization on the NWs, was confirmed by a suite of surface analysis techniques including x-ray photoelectron spectroscopy (XPS), high-resolution transmission electron microscopy (HRTEM), atomic force microscopy (AFM), and fluorescence microscopy.
II. EXPERIMENTAL
A. NW growth
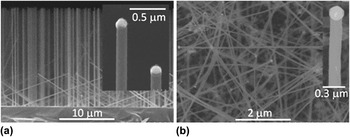
NWs of Si and 3C-polytype SiC were grown on Si(111) and 4H-SiC(0001) substrates respectively by chemical vapor deposition (CVD).Reference Krylyuk, Davydov and Levin11, Reference Krishnan, Venkatesh, Thirumalai, Koshka, Sundaresan, Levin, Davydov and Merrett12 For both materials, a metal catalyst was utilized to facilitate the vapor–liquid–solid growth mechanism. NW dimensions and morphology were characterized using a Hitachi-4700 field emission scanning electron microscope (FESEM) (Fig. 1) and the NW length (diameter) values were for Si—7–20 μm (110–130 nm) and for SiC—5–15 μm (80–200 nm). (Commercial equipment and material suppliers are identified in this article to adequately describe experimental procedures. This does not imply endorsement by NIST.)
(a) Cross-section FESEM image of Si NWs grown on a Si(111) substrate and (b) plan-view FESEM image of 3C-SiC NWs grown on a 4H-SiC(0001) substrate. Corresponding high-magnification images of individual NW tips are shown in the insets [note solidified Au and Ni catalytic metal caps atop Si and SiC NWs in the (a) and (b) insets, respectively].

B. NW functionalization
The as-grown Si and SiC NW samples were ultrasonically agitated in separate vials in 2% APTES solution in toluene for detaching the NWs from the substrates in order to form a suspension. After a 30-min exposure in APTES, the NW suspensions were sedimented by centrifugation for 2 min at 10,000 rpm (4-cm centrifuge rotor radius) and rinsed with toluene. The APTES-functionalized NWs were resuspended in toluene, placed onto 1 × 1 cm Si pieces, and allowed to air-dry. Upon drying, the Si and SiC NWs adhere to the substrate surface by strong electrostatic and van der Waals forces and are resistant to removal except by extreme ultrasonication. The APTES-coated Si and SiC NWs were then analyzed using XPS, HRTEM, and AFM.
C. Protein immobilization
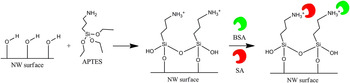
For examining the binding of the SA and the bovine serum albumin (BSA) proteins, the substrates coated with APTES-functionalized NWs were placed in a mixture of 0.058 mg/mL SA-labeled cyanine-3 (SA-cy3) and 0.058 mg/mL BSA-labeled fluorescein isothiocyanate (BSA-FITC) in 0.01 mol/L sodium or potassium phosphate buffer (pH = 7.4) solution for 2 h, followed by a brief sonication, then rinsed with buffer, and dried in a N2 flow (see Scheme 1). Fluorescence microscopy was used to characterize the APTES-functionalized NWs exposed to the SA/BSA mixture. The SA protein was utilized in this study as it is specific for biotin; BSA was used as a control protein for testing nonspecific binding (BSA has no affinity for biotin).
Streptavidin (SA) and Bovine Serum Albumin (BSA) binding to APTES-coated NWs. Note: Amino groups on the NW surface after APTES functionalization exists in a NH3+ and a hydrogen-bonded (NH2---H) form as well as free NH2 groups. Only NH3+ groups are shown in the schematic to emphasize the possibility of electrostatic binding of proteins to the APTES-functionalized NW surface.

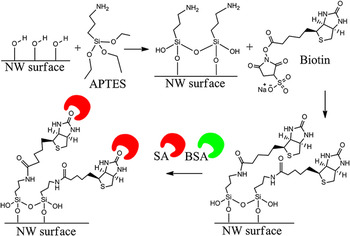
For examining the binding of SA and BSA proteins to the biotinylated NWs, 0.5 mL of biotin, at a concentration of 5 mg/mL in 0.01 mol/L phosphate buffer (pH = 7.4), was added to each of the two vials containing sedimented, APTES-coated Si or SiC NWs (see Scheme 2). The vials were then sonicated to bring the NWs back into suspension followed by a 2-h exposure to the biotin solution. The biotinylated NW suspensions then were centrifuged, followed by removal of residual biotin solution from the vials. After rinsing in phosphate buffer, drops of the biotinylated NW batches were deposited on clean Si substrates and air-dried on a hot plate at 90 °C to facilitate the evaporation of the solvent. XPS, HRTEM, and AFM were used to confirm biotinylation. The substrates with the attached biotinylated NWs were then exposed for 2 h to 0.058 mg/mL of SA only in phosphate buffer solution (for XPS, HRTEM, and AFM) or the SA/BSA mixture described above (for fluorescence microscopy) followed by a brief sonication, rinsed with phosphate buffer, and dried in N2 flow.
Streptavidin (SA) binding and inhibition of Bovine Serum Albumin (BSA) binding to biotinylated NWs. Note: Unlike Scheme 1, the NH3+/NH2---H forms of the APTES amino groups are not included in the schematic to illustrate the mechanism for the specific binding of SA after biotinylation.

Additionally, for examining the nonspecific binding of SA and BSA to as-grown Si and SiC NWs, the as-grown NWs were sonicated off the substrates in vials with toluene and transferred onto clean Si pieces. As-grown NWs that had adhered onto the Si pieces were analyzed using XPS, HRTEM, and AFM. The Si pieces with as-grown NWs were then placed for 2 h in the SA/BSA mixture described above, followed by a brief sonication, rinsed with phosphate buffer, and dried. A fluorescence microscopy analysis was then performed on the as-grown NWs after exposure to the protein mixture.
D. Characterization methods
For the XPS studies, the as-grown and functionalized Si and SiC NWs on the Si substrates were analyzed in a Kratos Analytical Axis Ultra DLD instrument (Kratos Analytical Ltd., Manchester, UK) with a monochromated Al Kα x-ray source at 150 W (10 mA, 15 kV). X-rays were collected at a 0° angle from the surface normal on an area of 300 × 700 μm. Low-resolution survey scans (160 eV pass energy, 0.5 eV step size) and high-resolution narrow scans (40 eV pass energy, 0.1 eV step size) of O 1s, N 1s, C 1s, Si 2p, and S 2p were obtained with the data analyzed using the CasaXPS program.13 The binding energy scale was calibrated to the C 1s, C*–C aliphatic carbon peak at 285.0 eV. Charge neutralization was not necessary during sample analysis due to the calibration to the aliphatic C 1s peak. In addition, SiC NWs were also dispersed on indium foil to circumvent the contributions of the Si peaks from the Si substrate; In 3D high-resolution narrow scans were also obtained in this case.
The Si and SiC NWs were examined by HRTEM to determine the efficacy and the layer thickness after each functionalization step. The morphology and microstructure of the as-grown and coated NWs were characterized at room temperature on a FEI Titan 80-300 TEM (FEI, Hillsboro, OR), equipped with S-TWIN objective lenses, at a 300 kV accelerating voltage. Low-intensity illumination conditions and beam blanking were used to minimize possible radiation damage of the organic layers.
The surface topography and morphology of the as-grown and functionalized Si and SiC NWs were investigated with a Veeco DI Dimension AFM (Veeco Metrology, LLC, Santa Barbara, CA) on a 1 × 1 μm scale in tapping mode. Images were analyzed using WSxM v5.0 software.Reference Horcas, Fernández, Gómez-Rodriguez, Colchero, Gómez-Herrero and Baro14
Fluorescence microscopy of the as-grown, APTES-coated, and biotinylated Si and SiC NWs, after exposure to the SA/BSA mixture, was performed using a Nikon Eclipse TE300 inverted epifluorescence microscope (Nikon Instruments, Inc., Melville, NY) with a Plan Apo 60X (N.A. 1.4) oil immersion objective. SA-cy3 was imaged using a Nikon EF.4 filter cube with an excitation of 515–565 nm at a 1-s exposure time. BSA-FITC was imaged using the Nikon B-2E/C filter cube with an excitation of 465–495 nm at a 9-s exposure time; the relatively long exposure time of 9 s was necessary to enhance the weak fluorescence signal of BSA. A fluorescence intensity analysis of the recorded images was performed using the ImageJ v1.45 software.15
III. RESULTS AND DISCUSSION
A. XPS
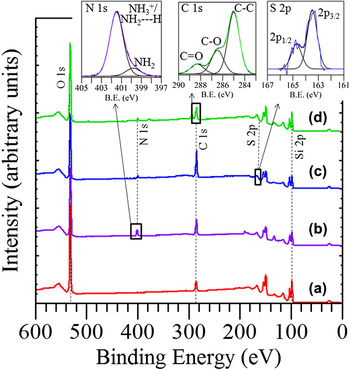
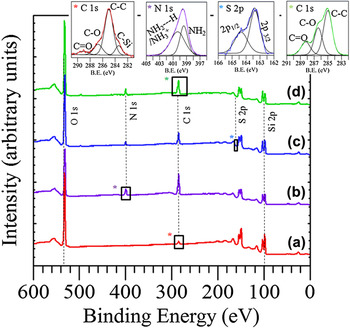
The XPS spectra from the Si NWs after each functionalization step are shown in Figs. 2(a)–2(d). The XPS spectrum of the as-grown Si NWs on Si [Fig. 2(a)] shows elemental silicon, Si 2p 3/2 at 98.1 eV, and two peaks originating from the SiOx native oxide, a Si 2p peak at 103.1 eV and an O 1s peak at 532.5 eV.Reference Wagner, Naumkin, Kraut-Vass, Allison, Powell and Rumble16 Notably, a thin amorphous oxide layer, often in its hydroxylated state, is formed on the Si NW surface upon exposure to lab air.Reference Morita, Ohmi, Hasegawa, Kawakami and Ohwada17, Reference Beaux, Bridges, DeHart, Bitterwolf and McIlroy18 This hydroxyl-terminated oxide shell on the NW is necessary for subsequent APTES hydrolysis and condensation reactionsReference Yakimova, Petoral, Yazdi, Vahlberg, Lloyd Spetz and Uvdal7 (see Schemes 1 and 2). The C 1s peaks at 285.0 and 286.6 eV are indicative of surface contamination with residual hydrocarbons.Reference Wagner, Naumkin, Kraut-Vass, Allison, Powell and Rumble16 Note that the Si substrate also generates a similar XPS spectrum and likely contributes to the spectrum from the randomly distributed Si NWs in Fig. 2(a), as the NWs are not evenly distributed on the Si substrate and there are regions on the substrate which have no NWs.
XPS spectra of Si NWs: (a) as-grown; (b) APTES-coated; (c) biotinylated; and (d) SA immobilized. The upper-left inset shows the N 1s peaks from NH3+/NH2---H (401.5 eV) and NH2 (399.8 eV) after APTES functionalization; the upper-right inset shows the S 2p peaks after biotinylation; and the upper-center inset shows the C 1s signal related to SA conjugation. Note: the S 2p peak is riding on the slope of the Si 2s energy loss peak and is not discernible in the survey scans but becomes clear in the high-resolution narrow scans. Also, trace amounts of Na, P, and K observed in some spectra can be attributed to residual phosphate buffer.

Upon APTES functionalization of the Si NWs, a nitrogen peak appears on the XPS spectrum [Fig. 2(b) and upper-left inset]. This peak confirms APTES conjugation to the NW surface since APTES contains a terminal amino group as indicated in Schemes 1 and 2. The N 1s peak can be deconvoluted into two peaks at 401.5 and 399.8 eV.Reference Arranz, Palacio, Garcia-Fresnadillo, Orellana, Navarro and Munoz19–Reference Bierbaum, Kinzler, Wöll, Grunze, Hähner, Heid and Effenberger21 The peak at 401.5 eV represents a NH3+ group (as in Scheme 1) or a hydrogen-bonded NH2 group (NH2---H) and the peak at 399.8 eV is indicative of a free NH2 (as in Scheme 2).Reference Arranz, Palacio, Garcia-Fresnadillo, Orellana, Navarro and Munoz19–Reference Bierbaum, Kinzler, Wöll, Grunze, Hähner, Heid and Effenberger21 The terminal amino group on the NW surface may exist in all three forms at the pH = 7.4 utilized in this study, as it was also observed by XPS in our previous work utilizing the same pH.Reference Williams, Davydov, Motayed, Sundaresan, Bocchini, Richter, Stan, Steffens, Zangmeister, Schreifels and Rao9
Following biotinylation of the APTES-coated Si NWs, a sulfur 2p doublet appears on the spectrum [S 2p 3/2 at 163.5 eV and S 2p 1/2 at 164.7 eV, Fig. 2(c), and upper-right inset]. The sulfur peak can be attributed to the sulfur atom contained within the tetrahydrothiophene-ring of biotin (see Scheme 2), indicating that biotin is bound to the APTES-functionalized NW surface. Samples analyzed after SA immobilization show C 1s peaks (C*–C at 285.0 eV, C*–O at 286.5 eV, and C* = O at 288.3 eV, see Fig. 2, upper-center inset) consistent with SA immobilizationReference Ruiz-Taylor, Martin and Wagner22 as well as a N 1s peak [see Fig. 2(d)].Reference Ruiz-Taylor, Martin and Wagner22, Reference Yang, Xie, Liu, Yan and Ju23
The XPS spectra from the SiC NWs on Si after each functionalization step are shown in Figs. 3(a)–3(d). The XPS spectrum of the as-grown SiC NWs on a Si substrate [Fig. 3(a) and upper-left C 1s inset] shows a C*–Si peak at 283.4 eV.Reference Wagner, Naumkin, Kraut-Vass, Allison, Powell and Rumble16 The Si 2p region of the spectrum is dominated by the substrate, which is composed of elemental Si with a thin SiOx native oxide layer that hampers distinguishing the Si*–C peak. Additional measurements of the as-grown NWs dispersed on indium foil also show the C*–Si peak at 283.0 eV and the Si 2p Si*–C peak at 100.9 eV that are characteristic of silicon carbide (XPS spectrum not shown). Also present is a small Si*–Ox peak at 103.2 eV due to the native oxide shell on the SiC NW surface (XPS spectrum not shown).Reference Wagner, Naumkin, Kraut-Vass, Allison, Powell and Rumble16, Reference Hijikata, Yaguchi, Yoshikawa and Yoshida24
XPS spectra of SiC NWs: (a) as-grown; (b) APTES-coated; (c) biotinylated; and (d) SA immobilized. The upper-left inset shows the C 1s peaks from the as-grown SiC NWs; the second from left inset shows the N 1s peaks from NH3+/NH2---H and NH2 after APTES functionalization; the next inset shows the S 2p peaks after biotinylation; and the right-most inset shows the C 1s signal related to SA conjugation. Note: same as in the Si NW case, the S 2p peak is riding on the slope of the Si 2s energy loss peak, which becomes clear in the high-resolution narrow scans. Also, trace amounts of Na, P, and K observed in some spectra can be attributed to residual phosphate buffer.

In the C 1s high-resolution scan of the SiC NWs on Si, shown in the top-left inset of Fig. 3, additional peaks are present at 285.0 eV (C*–C), 286.7 eV (C*–O), and 289.1 eV (C* = O).Reference Wagner, Naumkin, Kraut-Vass, Allison, Powell and Rumble16 These peaks are potentially indicative of significant hydrocarbon contamination of the SiC NWs.Reference Wagner, Naumkin, Kraut-Vass, Allison, Powell and Rumble16, Reference Hijikata, Yaguchi, Yoshikawa and Yoshida24, Reference Busiakiewicz, Huczko, Lange, Kowalczyk, Rogala, Kozlowski, Klusek, Olejniczak, Polański and Cudzilo25 Alternately, the C*–O peak could be originating from the potential presence of SiCxOy oxycarbides in the native oxide shell on the SiC NWs,Reference Hornetz, Michel and Halbritter26 as well as the decomposition products of absorbed CO2 on the NW, and/or the oxidation of free graphite possibly present on the SiC NW surface.Reference Hijikata, Yaguchi, Yoshikawa and Yoshida24, Reference Hu, Lu, Tang, Deng, Jiang, Qian, Yu, Zhou, Liu and Wu27, Reference Shen, Chen, Tang, Qian and Zhang28 The C* = O peak could be attributed to absorbed CO2 molecules on the NW surface and/or the oxidation of free carbon atoms on the NW.Reference Hijikata, Yaguchi, Yoshikawa and Yoshida24, Reference Hu, Lu, Tang, Deng, Jiang, Qian, Yu, Zhou, Liu and Wu27, Reference Shen, Chen, Tang, Qian and Zhang28
Upon APTES functionalization of the SiC NWs, a nitrogen peak appears on the XPS spectrum [Fig. 3(b) and left-center inset]. The N 1s peak can be deconvoluted into two, NH3+/NH2—H (400.1 eV) and NH2 (399.3 eV), peaks.Reference Arranz, Palacio, Garcia-Fresnadillo, Orellana, Navarro and Munoz19–Reference Bierbaum, Kinzler, Wöll, Grunze, Hähner, Heid and Effenberger21 Similar to the Si NWs, the N 1s peak confirms APTES functionalization and the existence of the terminal amino group in a protonated/hydrogen-bonded or deprotonated form. Like the Si NW case, successful conjugation of an APTES layer to the SiC surface was likely facilitated by the presence of a hydroxylated native oxide on the SiC surfaceReference Yakimova, Petoral, Yazdi, Vahlberg, Lloyd Spetz and Uvdal7, Reference Amy and Chabal29, Reference Cicero, Gallo and Catellani30 since termination of the SiC and Si surfaces with silanol groups is necessary for the reaction and covalent attachment of APTES molecules (see step 1 in Schemes 1 and 2).
Following biotinylation of the APTES-coated SiC NWs, a sulfur 2p doublet appears on the spectrum [S 2p 3/2 at 163.4 eV and S 2p 1/2 at 164.4 eV, Fig. 3(c) and right-center inset]. Like the Si NWs, the sulfur peak can be attributed to the sulfur atom contained within biotin and indicates that biotin is bound to the APTES-functionalized SiC NW surface. The SiC NWs analyzed after SA immobilization show similar C 1s peaks consistent with SA immobilizationReference Bierbaum, Kinzler, Wöll, Grunze, Hähner, Heid and Effenberger21 as well as the N 1s peak [see Fig. 3(d) and upper-right inset] that was also found on the SA immobilized on Si NWs.Reference Bierbaum, Kinzler, Wöll, Grunze, Hähner, Heid and Effenberger21, Reference Ruiz-Taylor, Martin and Wagner22
B. HRTEM
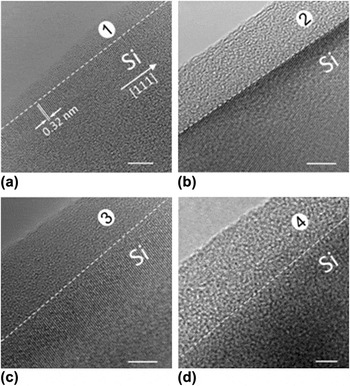
HRTEM was utilized to examine the morphology and thickness of the layers on the Si NW surface upon functionalization. The bright-field HRTEM image of the near-edge region of an as-grown Si NW is shown in Fig. 4(a). The {111} lattice fringes, with a spacing of 0.32 nm, are perpendicular to the NW edge and indicate the <111> growth direction of the NW. The image displays an approximately 3- to 5-nm thick SiOx native amorphous oxide on the NW surface [see region (1), Fig. 4(a)], in agreement with the XPS results.
Bright-field HRTEM images of near-edge regions of: (a) as-grown Si NW with native oxide layer; (b) APTES-coated Si NW; (c) biotinylated Si NW; and (d) fully functionalized Si NW. The 0.32 nm Si {111} lattice fringes in (a–c) indicate the <111> growth direction of the Si NW. White dashed lines help guide the eye and mark the interface between the NW edge and the amorphous outer layers (native SiOx and/or organic layers). Noteworthy, with the organic layer accumulation, the interface between the edge of the NW and the deposited organic layers, as well as the Si lattice fringes, become barely visible. Region (1) in (a) refers to the oxide layer; region (2) in (b) is the oxide/APTES layer; region (3) in (c) represents the oxide/APTES/biotin layer; and region (4) in (d) is the oxide/APTES/biotin/SA layer. The scale bars are 5 nm.

Following the successive attachment of APTES, biotin, and SA to the NW surface, HRTEM images in Figs. 4(b)–4(d), show an accumulation of 10- to 30-nm thick amorphous layers on the NW surface [see regions (2), (3), and (4)].
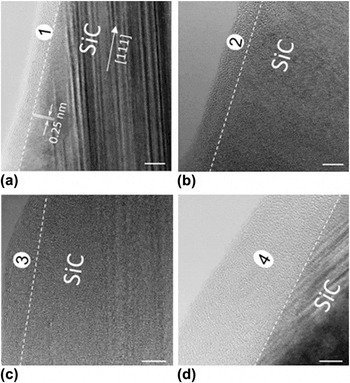
HRTEM data for SiC NWs demonstrate common similarities with the Si NWs regarding the appearance of a 2- to 5-nm thick native oxide layer [Fig. 5(a), region (1)] and biocompatibility toward APTES [Fig. 5(b), region (2)], biotin [Fig. 5(c), region (3)], and SA [Fig. 5(d), region (4)]. The thickness of amorphous-like organic layers usually ranges from about 7 to 20 nm. Compared with the APTES/biotin/SA conjugation to planar SiC surfaces from our previous study,Reference Williams, Davydov, Motayed, Sundaresan, Bocchini, Richter, Stan, Steffens, Zangmeister, Schreifels and Rao9 the accumulation of organic layers on the NW surface is several times thicker (e.g., ≈20 nm on the NW surface versus ≈5 nm on the planar SiC surface) and is less homogeneous. Therefore, further optimization of the bioconjugation steps on nonplanar (3D) surfaces with nanoscale dimensions is necessary for achieving more uniform organic layer depositions with controlled thicknesses for reliable NW-based biosensing platforms.
HRTEM images of near-edge regions of SiC NWs coated with: (a) native oxide layer [region (1)]; (b) APTES [layer (2)]; (c) APTES/biotin [layer (3)]; and (d) APTES/biotin/SA [layer (4)]. White dashed eye-guiding lines mark the interface between the NW edge and the amorphous oxide and organic layers. The 0.25 nm SiC {111} lattice fringes (labeled in a) indicate the <111> growth direction of the 3C-polytype SiC NWs in agreement with our previous results.Reference Krishnan, Venkatesh, Thirumalai, Koshka, Sundaresan, Levin, Davydov and Merrett12 Note the high density of the {111} stacking faults in 3C-SiC that are aligned 20° to the NW axis [clearly visible in (a) and (d) and described in Ref. Reference Krishnan, Venkatesh, Thirumalai, Koshka, Sundaresan, Levin, Davydov and Merrett12]. The scale bars are 5 nm.

C. AFM
Figure 6 shows the AFM images (A1–D1), cross-sectional profiles (A2–D2), and surface profiles (A3–D3) of Si NWs after each functionalization step. The schematic NW hexagonal cross-section corresponding to the typical NW diameter of 125 nm is inscribed inside each of the AFM cross-sectional line profiles in Fig. 6, A2–D2, to facilitate visualization of the APTES, biotin, and SA layer buildup at each functionalization step. First, the AFM scan and line profiles of an as-grown NW reveal faceted sidewalls [cross-sectional profile in Fig. 6, A2] with smooth surfaces [surface profile in Fig. 6, A3]. The cross-sectional profile in Fig. 6, A2 corresponds well to the Si NW shape observed in FESEM [Fig. 1(a)], with a slight overestimation of the NW diameter due to AFM tip convolution. Each successive coating leads to a loss of faceting (Fig. 6, B2–D2), and an increase in surface roughness (Fig. 6, B3–D3) due to the formation of organic molecule conglomerates. SA conjugation results in the formation of the largest composite structures, ≈25 nm in height, on the NW surface [Fig. 6(D3)].
AFM images with corresponding line scans of: (a1–a3) an as-grown Si NW; (b1–b3) an APTES-coated Si NW; (c1–c3) a biotinylated Si NW; and (d1–d3) a SA immobilized Si NW. For (a1–d1) the X–Y length scale bar in (a1) applies to all four images; the vertical bar on the right is the color-coded 200 nm Z-scale. For (a2–d2) the line scans, taken perpendicular to the NW growth axis, show the NW cross-sectional morphologies; the inscribed dash-lined hexagons represent a schematic cross-section of the as-grown Si NW with an average diameter of 125 nm. For (a3–d3) the 300 nm long line scans, taken along the NW growth axis, show typical top surface roughness after each functionalization step.

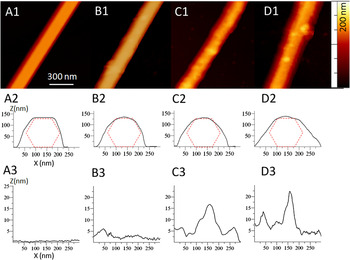
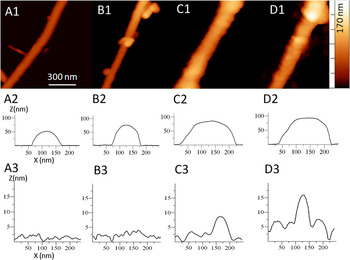
Figure 7 shows the AFM images (A1–D1), cross-sectional profiles (A2–D2), and surface profiles (A3–D3) of a SiC NW before and after functionalization. The AFM scan of an as-grown NW reveal a cylindrical-like shape with ≈100 nm diameter and smooth sidewalls (Fig. 7, A1–A3). Similar to the Si NWs, each functionalization step (APTES, biotin, and SA) results in an increase in the diameter of the NW as the molecules adhere and form layers (Fig. 7, B2–D2). Like the Si NWs, there is an increase in the NW surface roughness with each functionalization step (Fig. 7, B3–D3) due to organic molecule conglomeration. The formation of round-shape features of up to 20 nm in diameter is clearly identifiable in Fig. 7, C1, C3, and D1, D3.
AFM images with corresponding line scans of: (A1–A3) an as-grown SiC NW; (B1–B3) an APTES-coated SiC NW; (C1–C3) a biotinylated SiC NW; and (D1–D3) a SA immobilized SiC NW. For (A1–D1) the X–Y length scale bar in (A1) applies to all four images; the vertical bar on the right is the color-coded 170 nm Z-scale. For (A2–D2) the line scans, taken perpendicular to the NW axis, show the NW cross-sectional morphologies. For (A3–D3) the 300 nm long line scans, taken along the NW growth axis, show typical top surface morphology after each functionalization step.

D. Fluorescence microscopy
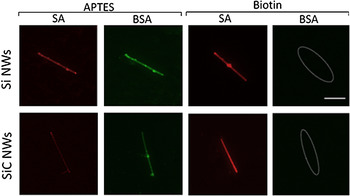
As-grown, APTES-coated, and biotinylated Si and SiC NWs were exposed to a SA/BSA mixture and then analyzed using fluorescence microscopy to assess the efficiency of protein-binding (see Fig. 8).
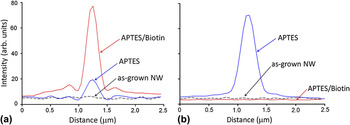
As expected, untreated (as-grown) Si and SiC NWs exposed directly to the SA/BSA protein mixture exhibit no fluorescence under the EF.4 and B-2E/C filter cubes, respectively (images not shown). The native oxides on the Si and SiC NW surfaces likely carry some negative surface charge (in the form of O− species), and therefore repel the BSA and SA protein molecules, which are also negatively charged at the working pH of 7.4.Reference Righetti and Tudor31 This interaction results in little, if any, protein conjugation to the NW surface (fluorescence images not included in Fig. 8, but the noise-level intensity line profiles for the as-grown SiC NWs exposed to SA/BSA are shown in Fig. 9 as dotted lines).
Fluorescence microscopy images of APTES-coated and biotinylated Si and SiC NWs after exposure to the SA/BSA mixture. For the APTES-coated samples (columns 1 and 2), the same NW of each material is imaged for the red (SA) and green (BSA) fluorescence, respectively. Likewise, columns 3 and 4 show the response from the same biotinylated NW of each kind. The dashed ovals in column 4 mark the locations of nonfluorescing NWs, confirming the absence of nonspecific BSA attachment. The 3 μm scale bar in the upper-right square applies to all images.

Fluorescence intensity line profiles for the (a) SA and (b) BSA proteins taken across as-grown, APTES-functionalized, and biotinylated SiC NWs after exposure to the SA/BSA mixture. The line profiles correspond to the NWs shown in the bottom row of Fig. 8 (except for the as-grown NWs).

In contrast, APTES-coated Si and SiC NWs exposed to a SA/BSA mixture demonstrated noticeable conjugation of both proteins as evidenced from columns 1 and 2 in Fig. 8. This nonspecific attachment can be attributed to the electrostatic attraction between the NH3+/NH2—H groups in APTES (the presence of which was confirmed by XPS in Figs. 2 and 3), and the negatively charged SA and BSA molecules (see Scheme 1).Reference Righetti and Tudor31, Reference Wang, Qian, Tan and Ding32
Nonspecific protein attachment is eliminated by completing the surface functionalization protocol with the biotinylation step. As can be seen from Fig. 8, the biotinylated Si and SiC NWs exhibit bright red SA fluorescence (column 3 in Fig. 8) and minimal green BSA fluorescence (column 4 in Fig. 8) indicating significant attachment of SA to the biotinylated NW surfaces but little nonspecific attachment of BSA. This can be attributed to the fact that BSA has no affinity for biotin, while SA exhibits a strong, specific, noncovalent interaction with biotin (see Scheme 2).Reference Williams, Davydov, Motayed, Sundaresan, Bocchini, Richter, Stan, Steffens, Zangmeister, Schreifels and Rao9 The attachment of only SA to the fully processed Si and SiC NWs confirms that the NW surfaces were successfully biotinylated using the solution-based functionalization technique.
IV. CONCLUSIONS
A biofunctionalization method for SA protein conjugation to biotinylated Si and SiC NWs was developed and validated using a suite of surface characterization techniques. The two-step, all solution-based protocol included an initial coating of the NW surfaces with APTES followed by the attachment of biotin. Successful attachment of APTES is likely promoted by the presence of thin native oxide shells on the Si and SiC NWs, inducing chemical reactions between the oxidized/hydroxylated surfaces and the APTES molecules.
Fluorescence microscopy revealed that APTES-coated NW surfaces were prone to nonspecific attachment of proteins due to the electrostatic attraction of SA and BSA molecules to the amine-terminated NW surfaces.Reference Righetti and Tudor31, Reference Wang, Qian, Tan and Ding32 The application of biotin to the APTES-coated NWs inhibited BSA binding while promoting the strong, specific, noncovalent interaction between SA and the biotinylated NW surfaces. The XPS, HRTEM, AFM, and fluorescence microscopy surface characterization techniques revealed that both materials, Si and SiC, display the same tendencies toward functionalization for the described bioconjugation protocol. APTES/biotin functionalized Si and SiC NW surfaces present selective and specific SA conjugation, making both of these semiconductors suitable for NW-based sensing platforms for the multiplexed electrical detection of bioanalytes.
ACKNOWLEDGMENTS
The authors are appreciative of the helpful discussions with Dr. Marlon L. Walker (Material Measurement Laboratory, NIST) and Dr. Rebecca A. Zangmeister (Material Measurement Laboratory, NIST) as well as the assistance of Dr. Anthony G. Birdwell (Sensors & Electronic Devices Directorate, Army Research Laboratory). EHW, MVR, and JAS gratefully acknowledge the financial support of the National Science Foundation (Grant No. ECCS-0901712); VPO gratefully acknowledges the financial support from NIST under contracts SB134110SE0579 and SB134111SE0814. AKM was supported by a contractual appointment to the U.S. Army Research Laboratory Postdoctoral Fellowship Program administered by Oak Ridge Associated Universities.