I. INTRODUCTION
Graphite has many unique properties, such as high electric conductivity, high thermal conductivity, and high resistance to strong acid and alkali. These unique properties lead to their potential applications in different important areas, such as electric materials, electrochemical capacitors,Reference Wang and Yoshio1 adsorbents,Reference Phan, Rio, Faur, Coq, Cloirec and Nguyen2 catalyst support,Reference Jayasri and Narayanan3–Reference Carneiro, Anderson, Rodriguez and Baker5 lithium ion batteries,Reference Lisowska-Oleksiak and Nowak6, Reference Zhang, Hu, Guo, Zheng, Zhong, Song and Wan7 hydrogen storage,Reference Lueking, Yang, Rodriguez and Baker8 microelectronic technologies,Reference Bunch, van der Zande, Verbridge, Frank, Tanenbaum, Parpia, Craighead and McEuen9 field-effect transistors,Reference Wang, Ouyang, Li, Wang, Guo and Dai10 and fuel cells.Reference Niu and Wang11
Carbon nanostructures are of great interest in a variety of research areas. The carbon nanotubes and C60 have been extensively studied from fabrication to application; however, there are few reports on the special morphologies of graphitic carbon (GC) materials. GC nanocapsule is an excellent carbon material with abundant curves and superhigh specific surface area. In this structure, the encapsulated second phase cores are protected by the carbon shells. The nanocapsule and the metal encapsulated inside have numerous potential applications in nanotechnologies such as magnetic data storage and xerography applications.Reference Wu, Zhu, Liu, Xie, Zhang and Hu12–Reference Sergiienko, Shibata, Zentaro, Shindo, Nakamura and Qin16
Graphitization of carbon is a transformation of amorphous carbon (a-C) material into crystallized graphite under high temperature of above 2000 °C. Increasing the pressure or adding catalysts could accelerate the graphitization process and increase the degree of graphitization of carbonReference Zaldivar and Rellick17, Reference Oya and Otani18 at lower temperature. Effective catalysts include metals or their oxides and carbides. It is found that elements such as B, Si, Ni, Co, Fe, Pt, Al, Mg, W, Mo, Cr, Mn, Pr, Ca, Ti, and Zr are effective in catalyzing the graphitization.Reference Iwazaki, Semba, Konishi, Sezai, Murakami, Sugimoto and Takasu19–Reference Oya and Otani23 The transition metals such as Fe, Co, and Ni are the most commonly used catalysts for graphitization. Cobalt is widely used as the graphitization catalyst of carbon.Reference Konno and Sinclair24 Our method makes the best used of the catalytic effect of cobalt based on the nature of the method itself. Ion-exchange resin is chosen as the precursor; cobalt as the graphitization catalyst is exchanged onto the bone of the resin at the atomic level through the ion exchanging process, thus guaranteeing the even dispersion of the catalyst all over the resin. All these will lead to a homogeneous graphitization of the resin. It is a challenge to reduce the graphitization temperature. Engle et al.Reference Engle25 reported the low-temperature graphitization of aluminum-doped cokes at 1700 °C. Yokokawa et al.Reference Yokokawa, Hosokawa and Takegami26 reported the low-temperature catalytic graphitization of hard carbon at 1400 °C. Jackson et al.Reference Jackson and Marjoram27 reported the catalytic graphitization of polyaniline (PAN)-based carbon fibers with electroplated nickel coating at 1100 °C in vacuum. Tzeng et al.Reference Tzeng28 found that the Ni–P-coated PAN-based carbon fibers could be catalytically graphitized at 1400 °C. Fuertes et al. directly synthesized GC nanostructures from saccharides impregnated with metallic salts of Fe and Ni at very low temperature of 900–1000 °C.Reference Sevilla, Sanchís, Valdés-Solís, Morallón and Fuertes29 Fu et al. synthesized GC nanostructures from ion-exchange resin–iron complex with solid-state pyrolysis at 1100 °C under N2 atmosphere.Reference Wang, Tian, Wang, Wang, Zhou and Fu30 Skowrońsk et al.Reference Skowroński, Knofczyński and Inagaki31 reported a method of partial transformation of glass-like carbon into graphite at relatively low temperature of 1000 °C.
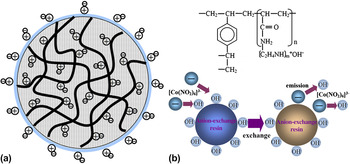
The exploration of energy-saving methods for the mass production of GC nanostructures is significant because of their wide applications. Compared with common polymers as carbon source, the ion-exchange resin has abundant tunnels with tuned functional organic groups that can locally exchange ions to disperse various species with various charges. Therefore, it is possible to control the size of the carbon materials obtained by using ion-exchange resins as carbon source. The enlarged view and structural formula of the ion-exchange resin is shown in Fig. 1.
(a) Structure of acrylic-type anion-exchange resin bead. ⊕ = fixed positively charged exchange site; ⊖ = mobile negatively charged exchangeable anion;  = acrylic chain.
 = hydrate water; (b) chemical structure of a acrylic-type anion-exchange resin and schematic diagram of ion-exchange process.

In this work, a low-cost and easy method to fabricate GC nanostructures is developed by using ion-exchange resins as carbon source; the specific surface area of our graphitized carbon is 120–188 m2/g. By using the present method, the graphitization of carbon can start at the low temperature of 600 °C. Given the lack of a reliable approach for the large-scale production of GC nanostructures, the present method is an important breakthrough and could be readily scaled up for mass production of GC nanostructures.
II. EXPERIMENTAL
A. Synthesis of GC
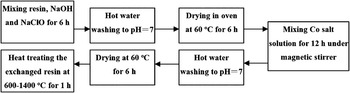
The macroporous acrylic type anion-exchange resin (Shanghai Hualing Co. Ltd., Shanghai, China) was pretreated before use. The inorganic and organic impurities can be removed by 1 M NaOH and 1 M NaClO solution. The treated resin was then washed with hot water of 60 °C to neutralize the pH value. The treatment with NaClO and alkaline solution can accelerate the removal of impurities and improve the exchange capacity. The resin was then dried in oven at 60 °C for 6 h. Sodium hexanitrocobaltate (0.01 mol) (Shanghai Hebao Chemical Co. Ltd., Shanghai, China) was dissolved in 50 mL deionized water and mixed with the resin (10 g) under magnetic stirring for 6 h. The mixture was washed with hot water and dried at 60 °C for 6 h. Finally, the exchanged resin was heat treated in a tube furnace under N2 atmosphere. Cobalt was removed by washing the sample in 1 mol L−1 HCl solution for more than 12 h with magnetic stirring. Afterward, the sample was filtered, washed, and dried. The schematic of the whole process of the graphitization of ion-exchange resin is shown in Fig. 2
Schematic of the synthesis of graphitic carbon (GC).

B. Characterization of GC
The x-ray diffraction (XRD) measurements were carried out in a D/Max-III (Rigaku Co., Tokyo, Japan) using CuK α radiation, operating at 40 kV and 30 mA. The sample and the commercially available silicon powder were grinded with an agate mortar until they could pass a 325 mesh standard sieve.Reference Iwashita, Park, Fujimoto, Shiraishi and Inagaki32 The transmission electron microscopic (TEM) investigations were carried out in a JEOL JEM-2010 (HR; JEOL Ltd., Tokyo, Japan) at 200 kV. In the sample preparation for the TEM, the powder sample was dispersed in ethanol by ultrasonicating for 30 min and then transfered onto a microgrid with a support membrane.
Raman spectroscopy measurements were performed in a Jobin Yvon HR 800 micro-Raman spectrometer (HORIBA Jobin Yvon GmbH, Unterhaching, Germany). The thermogravimetry (TG) and differential scanning calorimetry (DSC) (NETZSCH STA 409, NETZSCH GmbH & Co., Gebrüder-Netzsch-Straße, Germany) measurements were carried out to examine the phase changes. About 20 mg of the dried exchanged resin were heated from room temperature to 1000 °C at a constant heating rate of 10 °C min−1 under N2 atmosphere.
III. RESULTS AND DISCUSSION
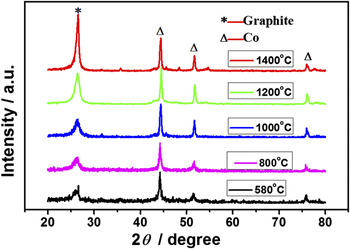
The XRD patterns of the GC samples are shown in Fig. 3. The diffraction peak at 2θ = 26.4° is the characteristic of the graphite (002) interlayer spacing, demonstrating the graphitization of the samples. The distinct diffraction peaks at 2θ = 44.2°, 51.5°, and 75.9° are indexed as the (111), (200), and (220) facets of hexagonal Co phase. Figure 3 shows XRD patterns of the samples from different heat temperatures. There is no graphite peak at the temperature of 500 °C, and the (002) peak began to appear at 580 °C, proving the start of graphitization at such low temperature. With the increase in the heat temperature, the (002) peak became very sharp at 1400 °C. It is found that the 2θ of the graphite (002) peak moves toward higher angle values with the increase in the temperature, indicating the increase in the graphitization of the sample.
X-ray diffraction (XRD) patterns of the samples with different heat treat temperatures (HTTs) with a step width of 8° min−1.

The crystallinity degree of the GC materials was determined by the Rietveld refinement using the XRD data. Diffraction spectra of the GC materials were obtained by the internal standard method using silicon powder as the standard reference. The crystallinity degree of the materials was calculated with the Profit software. The mass composition of the a-C and GC was determined from XRD data that were collected with step-scanning method on a Rigaku D/max-III 2500 V x-ray diffractometer. Qualitative phase analysis of each sample was performed using the Jade 5.0 software and Rietveld quantitative phase analysis using DBW S9807a.Reference Yong, Sakthivel, Moss and Paive-Santos33 The results were R P = 11.29% and R WP = 13.74%.The results demonstrated that x-ray powder diffraction technique combined with the Rietveld refinement method is an accurate and convenient method in determining the amount of GC in the composites.
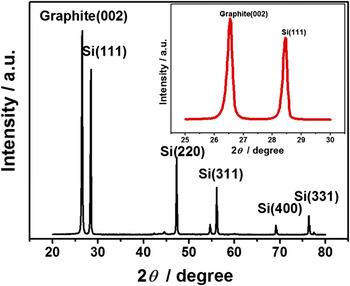
Figure 4 shows the step-scanning XRD pattern of GC; the inset is the narrow angle scan with the 2θ scope from 25 to 30 degree. The diffraction peak at 2θ = 26.38° is the characteristic of the graphite (002) facet, indicating the graphitization of carbon in the sample. The distinct diffraction peak at 2θ = 28.4° is the Si (111) facet. The microstructure parameters d 002 and L c were calculated using the Bragg’s law and Scherrer equationReference Iwashita, Park, Fujimoto, Shiraishi and Inagaki32:


Step-scanning XRD pattern of GC with 20% Si with a step width of 0.02° per step holding 2 s per step. Inset is the narrow angle scan with the 2θ scope from 25° to 30°.

The crystallinity degree of the sample was calculated with the Rietveld methodReference Nong, Yang, Zeng and Liu34:


where R P is the graphic residual variance factor, R wp is the weighted graphic residual variance fitting factor, S is goodness of fit, Y i(obs) is the measured intensity, Y i(calc) is the calculated intensity, W i = 1/Y i(obs), N is the number of corrected parameter, and P is the number of experiments observed.
The content of GC was determined by internal standard method by adding reference material into the GC sample. The relative mass fraction W α of crystalline phase α is given by:


where S α, Z α, M α, V α, and m α are the Rietveld scale factor, the number of formula units per unit cell, the mass of the formula unit, the unit-cell volume, and the mass of each phase α, respectively. S s, Z s, M s, V s, and m s are the Rietveld scale factor, the number of formula units per unit cell, the mass of the formula unit, the unit-cell volume, and the mass of internal standard (Si or Al2O3), respectively. W α is the mass fraction of each phase in mixture, W s is the mass fraction of internal standard, and W β is the mass fraction of amorphous phase or unknown phase.
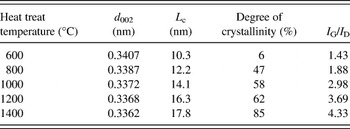
The structural parameters of the GC samples are shown in Table 1. It can be seen that the higher heat treat temperature (HTT) resulted in higher degree of crystallinity. The lattice spacing between the graphite layers d002 and the mean stacking height of the graphitic crystallites, L c. also increase with the increase in the HTT, showing the same tendency with the degree of crystallinity. With our method, high crystallinity degree of 85% can be reached at 0.5–1 h at 1400 °C. In a comparable work, Zhou et al.Reference Zhou, Yu, Peng, Wang, Chen and Kuang35 studied the catalytic graphitization of carbon fibers, the crystallinity degree of 30.1% was reached for carbon fibers without coating treated at 2800 °C, and the crystallinity degree of 76% was obtained with pure Ni treated at 1500 °C. Compared with other methods, the advantages of our method are high crystallinity degree, low temperature, short time, and possibility of mass production.
Structural parameters of the graphitic carbon samples at different heat treat temperatures.

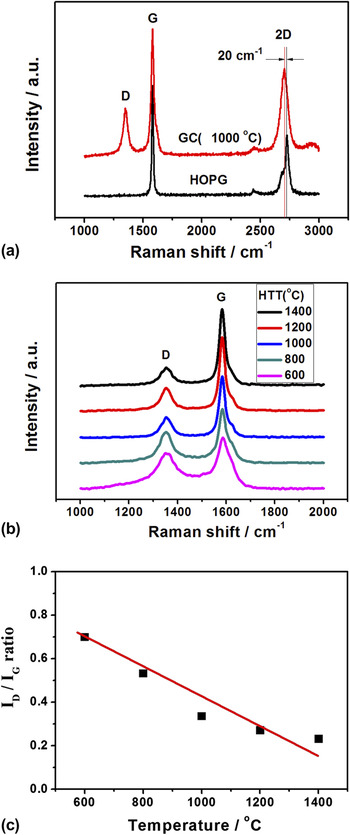
Raman spectroscopy was used to study the graphitization of the sample. Figure 5 shows the typical Raman spectra of the samples. The G line at 1580 cm−1 (GC at 1000 °C) corresponds to the splitting of the E2g stretching mode of graphite and reflects the structural intensity of the sp2-hybridized carbon atom. There is a negative shift compared with that of the highly oriented pyrolytic graphite (HOPG; 1585 cm−1) [Fig. 5(a)]. The 2D line is an overtone of the D band. The D and 2D lines belong to the second-order Raman scattering process in which the D line consists of one elastic and one inelastic scattering, while the 2D line consists of two inelastic scatterings.Reference Park, Reina, Saito, Kong, Dresselhaus and Dresselhaus36 The 2D line of GC at 2705 cm−1 has a negative shift compared to HOPG (2726 cm−1), indicating the formation of thinner graphite layer. The peak value of 2D band is higher than that of G band. The D line at 1354 cm−1 is attributed to the vibrations of carbon atoms with dangling bonds in disordered graphite planes and the defects incorporated into pentagon and heptagon graphite-like structures. The G line is much higher in intensity and narrower in width compared with the D line. The intensity ratio of the D line to G line (I D/I G) is a frequently used parameter to judge the degree of graphitization. Lower I D/I G means higher graphitization. The missing of the D line in the Raman spectrum of HOPG shows that HOPG is a perfect graphite material.
(a) Raman spectra of highly oriented pyrolytic graphite and GC (1000 °C); (b) the Raman spectra of GC prepared at different HTTs; and (c) the relationship between temperature and ratio of I D/I G of the samples.

The Raman spectra of the GC prepared at different HTT in the range of 1000–2000 cm−1 are shown in Fig. 5(b). The intensity ratio of the G line to D line (I D/I G) was 0.23 for GC heat treated at 1400 °C. As shown in Fig. 4(c), the ratios of I D/I G decrease with the increase in the temperature because of the increase in the graphitization. The information from the Raman spectra is in accordance with the calculation of the crystallinity degree by the Rietveld method; the results are shown in Table 1.
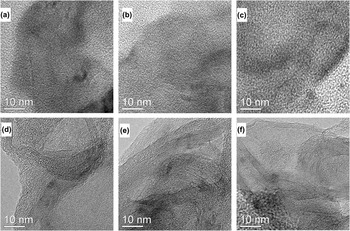
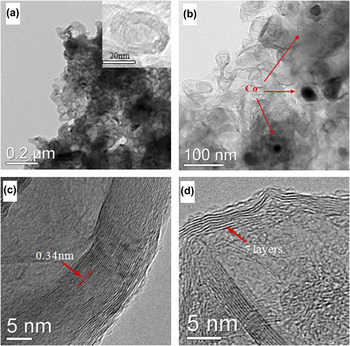
Figure 6 shows the TEM images of the graphitized resin heated at different temperatures. It is clear that the graphitization increases with the temperature. It is hard to find the lattice fringe at temperatures lower than 800 °C. However, the fringe becomes obvious at higher temperatures as shown in Figs. 6(d)–6(f). It has been found that not only the graphitization of the resin can be controlled, but also the structure of the resulted GC can be changed with the treating conditions. Nanocapsules with the diameter of 20–30 nm were formed as shown in Fig. 7. At the same time, very thin graphite sheets were also observed. The change in the structure originated from the difference in the concentration of the Co salt during the pretreatment. The effect of the concentration of the Co salt on the graphitization of the resin was obvious. When the resin was pretreated in a solution containing 1 mmol sodium hexanitrocobaltate per gram resin and heated at 1000 °C, the multilayered GC was formed [Figs. 7(a) and 7(c)]. However, GC with less than 10 layers could be obtained by using a diluted Co salt solution during the pretreatment process. It is clear that only seven layers of graphite were formed by using 0.5 mmol sodium hexanitrocobaltate per gram resin [Figs. 7(b) and 7(d)]. The spacing between the crystal is about 0.34 nm, corresponding to the (002) facet of GC lattice [Fig. 7(c) and 7(d)]. In conclusion, with this method it is possible to produce graphite nanocapsules with controllable graphite layer numbers.
Transmission electron microscopic (TEM) images of the graphitized resin at different temperatures: (a) 500 °C, (b) 600 °C, (c) 800 °C, (d) 1000 °C, (e) 1200 °C, and (f) 1400 °C.

TEM and high-resolution TEM (HRTEM) images of the samples. (a) The nanocapsule structure of the GC heated at 1000 °C, the resin was pretreated in a solution containing 1 mmol sodium hexanitrocobaltate per gram resin for 6 h. The inset is the image of a single nanocapsule; (b) the sheet structure of the GC heated at 1000 °C, the resin was pretreated in a solution containing 0.5 mmol sodium hexanitrocobaltate per gram resin for 1 h and repeated for 5 times; (c) the HRTEM of multilayered GC; and (d) the HRTEM of GC with less than 10 layers.

Figure 8 shows the TG and DSC curves of the ion-exchanged resin in a nitrogen stream at a heating rate of 10 °C min−1. It can be seen that the weight loss of the resin is about 15 wt% from 100 to 400 °C. The weight loss is sharp from 400 to 450 °C. However, the weight loss is only 8% from 450 to 1000 °C. The sharp mass loss between 400 and 450 °C corresponds to the evaporation and decomposition of the resin with the release of CO and CO2. The slow mass loss after 450 °C corresponds to a continuous process of carbonization and graphitization of the melted resin.
Thermogravimetry and differential scanning calorimetry curves of the GC at 10 °C/min, 30–1000 °C in a nitrogen stream. The arrows indicate the Y axis of the curve, the left arrow means the curve is of the left Y axis and the right arrow means the curve is of the right Y axis.

The endothermic peak on DSC curve at around 400–450 °C corresponds to the decomposition of the resin. The exothermic peak closing 600 °C ascribes to the transformation of the a-C to graphite. The exothermic reaction temperature 550–650 °C is higher than the decomposition temperature of precursor, 400–450 °C, without forming any metastable phase cobalt–carbide. The hexagonal close-packed Co to face-centered cubic Co transformation is an athermal transformation involving very little heat release. Otherwise, the results of XRD and TEM are consistent with the graphitization occurring at 600 °C. Konno and SinclairReference Konno and Sinclair37, Reference Konno and Sinclair38 investigated the crystallization behavior of a-C in a-C/Co/a-C trilayer thin films. They reported the catalytic crystallization of a-C into graphite at 500–600 °C, the exothermic reaction at 570–610 °C was due to the crystallization of a-C, and the heat of crystallization as measured by DSC was 19 ± 2 kJ/mol, which is similar to our results. The graphitization of the resin catalyzed by cobalt salt might include following processes depending on the temperature.


Co ions were uniformly exchanged into ion-exchange resins. The attached Co ions on the resin were reduced into Co nanoparticles during the heat treatment. The homogeneously dispersed Co nanoparticles acted as catalyst for the graphitization of the resin at lower temperatures. The GC prepared by the present method can be used as the support of the electrocatalysts to improve the stability and performance in fuel cells and the work is in progress.
IV. CONCLUSIONS
An ion-exchange resin was used as carbon source in the synthesis of GC at low temperatures. Co was selected as the graphitization catalyst. The resin began to be graphitized at a temperature as low as 600 °C. Different GC structures have been found depending on the pretreatment of the resin and heat treatment temperature. In one structure, the GC consisted of graphite sheets of less than 10 layers. In another structure, GC nanocapsules were formed. The GC prepared with this method can be used as a catalyst support for fuel cells and as a carbon material in supercapacitors or lithium ion batteries.
ACKNOWLEDGMENTS
The work was supported by the National Natural Science Foundation of China (21073241, U1034003, 21106190) and the China National 863 Program (2009AA034400). Dr. H. Meng thanks the New Teacher Funding of Sun Yat-sen University (30000-3126170) and the Doctoral Fund of Ministry of Education of China (20100171120022). Mr. Z.X. Yan thanks the support by Yat-sen Innovative Talents Cultivation Program for Excellent Tutors.