Introduction
The focus of this study is on how common spaces are used by residents in assisted living schemes (ALS) for older persons. ALS for older people in Sweden is a form of domestic care in different settings, including housing with domestic services, ‘sheltered housing’ and 24-hour residential care. The aim of the study is to explore the daily use of common spaces, as well as to relate the intended use to the actual use. The study includes ALS for two main categories of residents: those that specialise in residents with cognitive disorders such as dementia and those intended mainly for residents with somatic disorders, referred to here as ‘dementia’ and ‘somatic’ units, respectively.
Several researchers have stressed the importance of studying the daily use of common spaces in relation to the projected functions of elder-care environments (Andersson Reference Andersson2011; Andersson, Lindahl and Malmqvist Reference Andersson, Lindahl and Malmqvist2011; Ice Reference Ice2002; Nord Reference Nord2011a; Zimmerman et al. Reference Zimmerman, Mitchell, Chen, Morgan, Gruber-Baldini, Sloane, Eckert and Munn2007). A growing body of research also concerns the role of common spaces for social interaction in ALS (Frankowski et al. Reference Frankowski, Roth, Eckert and Harris-Wallace2011; Lu et al. Reference Lu, Rodiek, Shepley and Duffy2010; Moore Reference Moore1999; Nord Reference Nord2011b; Yang and Stark Reference Yang and Stark2010; Zavotka and Teaford Reference Zavotka and Teaford1997). Social relationships are essential for a good quality of life (Lee and Ishii-Kuntz Reference Lee and Ishii-Kuntz1987; Moore Reference Moore1999). According to Alexander (Reference Alexander1979: 92), the physical environment ‘allows the patterns of events to happen. In this sense, it plays a fundamental role in making sure that just this pattern of events keeps on repeating over and over again’. Both social expectations and the physical environment itself define the physical environment as a place (Moore Reference Moore1999); in this context the common spaces. Ward et al. (Reference Ward, Snodgrass, Chew and Russell1988: 5) describe place specificity and the fact that ‘people do different things in different places’.
In this study, social interaction is defined as residents spending time in common spaces, as opposed to being alone in their apartments. The social interactions taking place are explored in relation to the degree of presence. The nature of the social interaction is accounted for in relation to common meals and the occurrence of visitors and excursions outside the facility.
The role of staff as social mediators in the daily life of the residents has previously been emphasised as important (Ball et al. Reference Ball, Lepore, Perkins, Hollingsworth and Sweatman2009; Ryvicker Reference Ryvicker2011; Williams and Warren Reference Williams and Warren2009; Zimmerman et al. Reference Zimmerman, Scott, Park, Hall, Wetherby, Gruber-Baldini and Morgan2003). There is also a growing body of research that demonstrates the impact of the physical environment on human health and activities. Literature concerning health-care environments in general (Dijkstra, Piterse and Pruyn Reference Dijkstra, Piterse and Pruyn2006; Lorenz Reference Lorenz2007; Ulrich et al. Reference Ulrich, Zimring, Zhu, DuBose, Seo, Choi, Quan and Joseph2008; van den Berg Reference van den Berg2005) or specifically elder-care environments (Day, Carreon and Stump Reference Day, Carreon and Stump2000; Verbeek et al. Reference Verbeek, van Rossum, Zwakhalen, Kempen and Hamers2009) form a background for the research presented in this paper.
There is a demand for knowledge about ALS from both an economic and a demographic perspective. Demographic trends forecast an increase of the 65+ Swedish population from 19 to 24 per cent between 2012 and 2040. A similar increase is forecasted in many countries worldwide. This poses a social and economic challenge for society as a whole and for the elder-care sector in particular. Furthermore, older persons moving into ALS in Sweden are increasingly old, frail and with high levels of morbidity. Are we indeed designing and building in an effective way for the users today as well as for future users? This question presents issues that are applicable to elder-care environments world-wide and the findings presented here are transferrable to other ALS environments in Sweden as well as in other countries. The study findings have implications for design schemes and organisational models, connoting residential care with private apartments, spaces for common social activities and staff available around the clock (Kalymun Reference Kalymun1991; Paulsson Reference Paulsson2002; Zimmerman and Sloane Reference Zimmerman and Sloane2007).
Assisted living
The 2001 Social Services Act obliges Swedish municipalities to provide support and care for older people (SFS 2001:453). ALS are provided for older people in need of care and assistance in daily life, following an assessment procedure. Rental charges and fees (both for social and medical care) are state subsidised. Municipalities can procure services from private contractors (SFS 1991:900). Today, approximately 20 per cent of ALS is delivered by privately owned providers, compared to 2 per cent in 1990 (Trydegård Reference Trydegård2012). The number of residents in ALS has decreased from 118,600 in 2001 to 89,100 in 2011 (Swedish Institute for Assistive Technology 2012) because more resources are directed to home care services, measures for improved accessibility in the ordinary housing stock have been introduced and health among older people has generally improved. In 2012, approximately 50 per cent of the residents suffered from dementia and other cognitive disorders (National Board of Health and Welfare 2012). This situation increases the workload and the responsibilities of staff and changes the preconditions for the daily use of facilities.
The residents of ALS live in facilities with a number of units, or groups. Each unit consists of 5–20 apartments, ranging from about 25 to 50 square metres (m2). Most apartments are designed for single persons. The individual apartment includes a kitchenette, a living room and a large bathroom. There may be a separate bedroom or an integrated living room and bedroom. The residents also share spaces with ‘functions and equipment for cooking, daily social interaction and dining’ (BBR 2012: 103). Special rules and recommendations for dementia care in ALS point out the need for small-scale and home-friendly schemes (Dementia Association 1992; National Board of Health and Welfare 2010; Prop 1990/91:14). Dementia units therefore often contain approximately five to nine apartments, while somatic units may have more (Almberg and Paulsson Reference Almberg, Paulsson, Preiser, Vischer and White1991; Verbeek et al. Reference Verbeek, van Rossum, Zwakhalen, Kempen and Hamers2009). Each resident has a tenancy agreement for the apartment, which is a private home from a legal point of view (SFS 1970:994). It is also classified as a workplace (Swedish Work Environment Authority 2009).
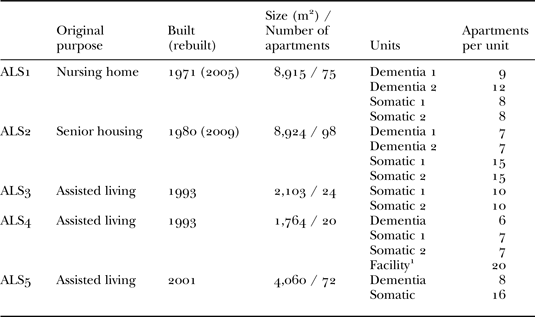
Care provision for older people in Sweden has gone through a continuous development since the 1960s. The overwhelming majority of buildings in ALS today were built by different public organisations, the majority after 1965. Thus, ALS in Sweden display considerable variations in design. In 1992, the responsibility for old, chronically ill and disabled persons was transferred from the county administrations to the municipalities (SFS 1990:1403). This radical change, named the ‘Adel Reform’, also entailed a change of perspective from institution-like to more home-like environments (Prop 1990/91:14). Ordinary housing standards have been applied to ALS, which concomitantly became the form of sheltered housing for older persons provided by the municipalities (BBR 2012). The facilities in this study were built in 1971, 1980, 1993 (two facilities) and 2001, and were chosen to reflect this variation (Table 1).
Facilities included in the observations

Notes: 1. Included the whole facility: one dementia and two somatic units. m2: square metres.
When planning for new ALS, continuously changing legislation governs much of the planning processes. To identify the needs of the clients, it is crucial both to incorporate relevant research and knowledge of the end-users (Blyth and Worthington Reference Blyth and Worthington2001; Lindahl and Ryd Reference Lindahl and Ryd2007). It is also relevant to obtain feedback from the users throughout a building's lifecycle (Alexander Reference Alexander2006; Blakstad Reference Blakstad2001; Leaman Reference Leaman2000).
ALS have the function of a home as well as a care environment (Cutchin, Owen and Chang Reference Cutchin, Owen and Chang2005; SFS 2001:453). Some authors have used ‘hotel’ or ‘resort’ as a metaphor (Andersson Reference Andersson2011; Bland Reference Bland1999; Briller and Calkins Reference Briller and Calkins2000; Keen Reference Keen1989) and the purpose of ALS can be seen as threefold.
Firstly, ALS provide a home or a housing unit. Although ALS display features similar to other elder-care environments, e.g. nursing homes, some differences exist. In the United States of America, both Dobbs (Reference Dobbs2004) and Imamoğlu (Reference Imamoğlu2007) point out that ALS, unlike nursing homes, present common physical features and aesthetic appearance that are more home-like. This comparison is also relevant in the Swedish context. Heywood, Oldman and Means (Reference Heywood, Oldman and Means2002) describe a housing unit as a physical structure while ‘home’ relates to existential and experiential factors. Several authors have shown that the home becomes increasingly important to people as they grow older (Gurney and Means Reference Gurney, Means, Arber and Evandrou1993; Heywood, Oldman and Means Reference Heywood, Oldman and Means2002; Tinker Reference Tinker1987). Lawrence (Reference Lawrence1987: 155) describes home as a ‘shelter and protection for domestic activities’. If the individual apartment constitutes a more private space and represents the home, the bedroom represents the most private ‘inner sanctum’ of the home (Cristoforetti, Gennai and Rodeschini Reference Cristoforetti, Gennai and Rodeschini2011: 229). However, what is private, semi-private or public is not static in ALS. The creation of a private space is not necessarily limited to certain physical spaces. McColgan (Reference McColgan2005) describes how people with dementia create individual private spaces in common places. Private spaces are often reversed into a semi-private or public space when providing care in ALS (Nord Reference Nord2011a; Twigg Reference Twigg2002). This contradicts the meaning of home as a secluded place of privacy.
Secondly, the purpose of ALS is to provide a residential care environment (SOU 2008:113), including assistance in activities of daily life and provision of medical treatment. The conditions under which staff work are increasingly an area of attention due to the changing characteristics of residents. More dependent residents result in a high degree of surveillance and a lower degree of privacy.
Thirdly, ALS provide opportunities and spaces for daily social interaction. The common spaces provide the main arena for this interaction. Lyman and Scott (Reference Lyman and Scott1967) describe four types of human territories: public territories, home territories, interactional territories and body territories. The common spaces could be described as a mixture of all these. The common space, like the home territory, belongs to a group of persons, but is in some aspects also public to others. The interactional territory is where social gatherings may occur, but it also encompasses the body territories of individual persons. Thus, the activities taking place here are both of a more public and of a more private character, i.e. the kind of activities normally taking place in the seclusion of the private home (Lundgren Reference Lundgren2000). If going to sleep in a bed marks the most private activity of daily life, the communal meal in the common dining room marks the most important recurring social event (Frankowski et al. Reference Frankowski, Roth, Eckert and Harris-Wallace2011; Moore Reference Moore1999).
Objectives
The first objective of this paper is to examine the discrepancies between the somatic and dementia units regarding how, and to what extent, the common spaces are used. How the residents' capabilities for independent mobility affect the degree of presence in the common spaces is also discussed, and this is examined in relation to the staff's role in moving the residents around. The second objective is to examine the intended functions of the common spaces in relation to contextual changes over time.
Methods and research design
Methodological considerations
Information about the study was given to the residents individually by the heads of the units and by the ‘contact persons’ (the main connection between the resident and his/her relatives). The relatives were informed by the contact persons or by the heads and by information sheets at the entrance to the respective unit. All information was provided in writing, both to staff and residents, describing the objective of the research, the participants' role, the conditions for their participation and the fact that participation was voluntary. The information made clear that the data would be treated confidentially and only used for research purposes. The residents and staff participated with ‘informed consent’. All residents involved in interviews in this study were living in somatic units. None of them had any diagnosed dementia and they all actively gave their consent to the interviews. The residents could stop the interview on request.
The methods included participant observation, semi-structured group interviews and individual interviews. The research was undertaken between 2009 and 2012 in six units for residents with dementia and in nine units with residents mainly suffering from somatic disorders.
The participant observation study was explorative, allowing a continuous reformulation of the research objectives as the study developed (Dewalt and Dewalt Reference Dewalt and Dewalt2002; Miles and Huberman Reference Miles and Huberman1994). The degree of participation included interaction with the participants, but not in the daily activities (Dewalt and Dewalt Reference Dewalt and Dewalt2002). Participant observation entailed spontaneous conversations with residents and staff.
Field observations encompassed approximately 200 hours at different times of the day and with an average duration of seven hours. In all, 199 residents were directly involved. Annotations, in the form of written notes and simple drawings, were made at five-minute intervals. The field observations were non-structured (Patton Reference Patton2002). Data were recorded concerning the physical settings, the number of residents, staff that were present and the activities taking place in the common spaces that were in any way related to the physical settings. During a second period of field work, structured observations were performed (Bryman Reference Bryman2008) to complete the study where observations regarding specific hours were lacking from the first period. Data concerning the number of residents present in the common spaces were recorded, along with the number of residents present and their mobility status. The presence of the staff was also recorded in detail. Photogrpahs, along with drawings and other building documentation, were also used.
The semi-structured group interviews included five sessions with 24 staff members from all units in the five facilities (ALS1–5). An open-ended interview guide was used, allowing questions to develop in the course of the interview (Bryman Reference Bryman2008; Patton Reference Patton2002). Interviews were scheduled for two hours and were recorded. The groups varied between three and seven persons (24 women and one man). This reflects the overall gender proportions among the staff involved in the study (92 women and five men).
The semi-structured individual interviews included an open-ended interview guide, based on the results from the observations and the group interviews. Each interview was scheduled for one hour. Four relatives, ten residents, three architects and four key stakeholders were interviewed. The ten interviewed residents all lived in the five facilities included in the observations and were chosen according to three criteria in order to broaden the experiential perspectives of the participants. Five men and five women were included. The participants represented varying length of residency (between three months and seven and a half years) and ages (between 73 and 102 years). Finally, different mobility status was a criterion for inclusion.
The purpose of the interviews was to strengthen the validity of the findings by triangulating the findings from the participant observations (Denzin Reference Denzin1978). In all the interviews, notes were formulated with the participants, who were given the opportunity to reformulate the material on an on-going basis.
The facilities in the study
The five ALS facilities are located in Gothenburg, Sweden and are owned, managed and operated by the City of Gothenburg. All the facilities in these studies were originally designed for older people with varying needs. The facilities include units for older persons with dementia or for persons with mainly somatic disorders (Table 1).
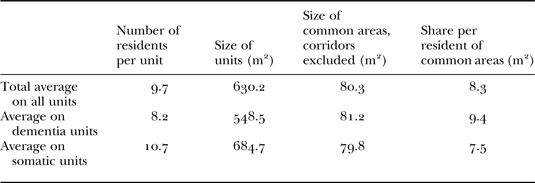
The size of the units varies between 430 and 1,095 m2. On average, the dementia units are smaller and contain fewer residents compared to the somatic units but each resident on the dementia units has a larger share of the common spaces (Table 2).
Size of units and common spaces
Note: m2: square metres.
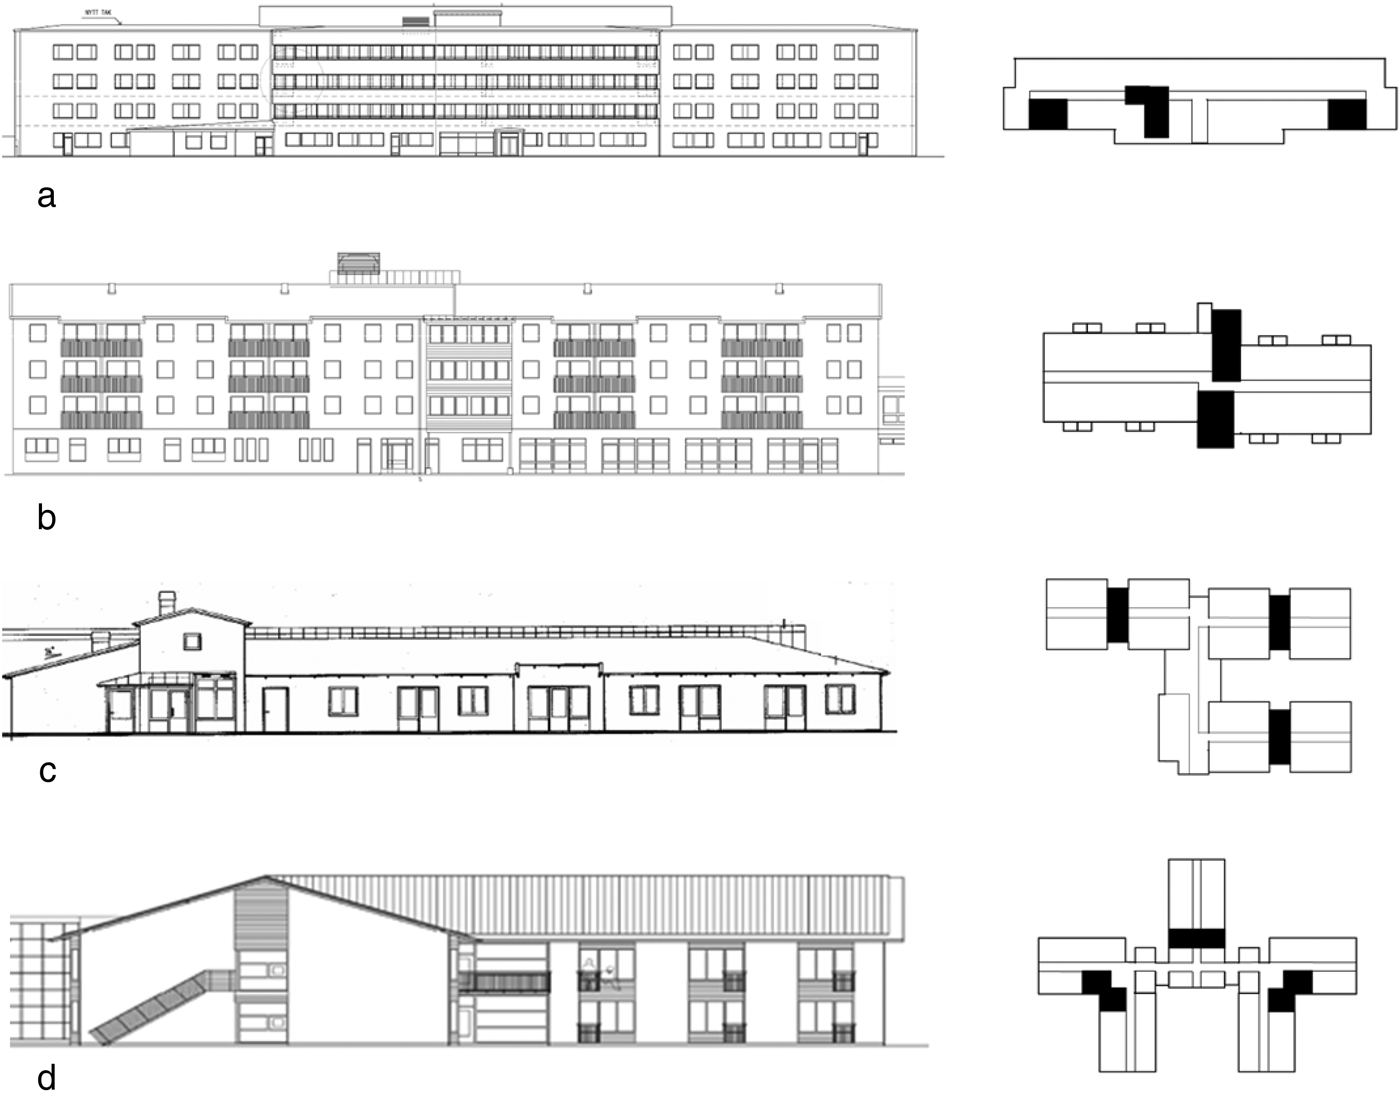
The sample represents four decades of sheltered housing for older people, displaying large differences in the size of the units as well as the common spaces (Tables 1 and 2). The designs of the different ALS, however, display typological similarities. All facilities have communal, horizontal communication areas connecting the rooms or apartments and they are all subdivided in smaller units or groups with 6–16 residents. Each unit contains common spaces for communal activities. ALS1 was built as a nursing home in 1971 as part of a large-scale expansion and modernisation of geriatric nursing homes between 1965 and 1980. New design guidelines were developed in the 1970s promoting units with rooms that were mostly shared by two or more persons. The facilities also contained spaces for physiotherapy, common rooms and spaces for other services (Andersson Reference Andersson2011). Each unit had a common sitting/dining room and kitchen, sanitary utilities and administrative spaces. It now contains 75 single apartments of 36 m2 with large bathrooms and small kitchenettes. ALS2 was built by the municipality as a senior housing facility in 1980 as a result of the new Social Services Act (SFS 1980:620). The facilities were intended for independent senior citizens and were not part of the health-care system. They contained apartments for one or two people and often had common spaces for social interaction. The residents were supposed to have their main meals in a communal restaurant, together with people from the surrounding community (Paulsson Reference Paulsson2002). The layout of the building has been slightly altered but the 98 apartments remain unchanged; they each contain a living room, bathroom, kitchenette and a separate bedroom covering 43 m2, plus a private balcony. The original, small sitting rooms have been enlarged into common spaces at the cost of a few apartments. Beside the housing part, both ALS1 and ALS2 initially had an activity centre with a café and a restaurant, which is now closed in ALS2. ALS3 and ALS4 were built concomitantly with the ‘Adel Reform’ in 1992, which stipulated more ‘home-like’ and small-scale environments in elder-care facilities. They contain 24 and 20 apartments, respectively (38 and 40 m2). AL5 was built in the 2000s and represents the most up-to-date ALS. This facility contains 72 apartments of only 27 m2. Figure 1 shows four of the facilities included in the observations.
Elevations and schematic plans of four of the five facilities included in the observation study. The plans show communication areas and common spaces (marked in black). (a) ALS1 was built in 1971 in a hospital-like architecture and rebuilt in 2005 (White Architects 1970 and Krook & Tjäder Architects 2004). (b) ALS2 was built in 1980 as a senior housing facility in the form of a block of flats and rebuilt in 2009 (Kullenberg Architects 1979 and Lundberg Architects 2009). The common spaces contain a multi-purpose space with kitchen and sitting room functions and a separate sitting room, 141 square metres. (c) ALS4 from 1993 (Lundberg Architects 1992) represents a small-scale architecture, inspired by row houses. All apartments have their own small garden. (d) ALS5 was built in 2001 (Arkotek Architects 2001) with small apartments in a more large-scale architecture. The common spaces in (a), (c) and (d) contain multi-purpose common spaces with integrated kitchens, dining rooms and sitting rooms. The drawings are not to scale.
The common spaces present very different layouts. The reasons for this are that the facilities were built for other purposes and during different periods (Table 1), but also that the functions were changed when the facilities were rebuilt, which is illustrated in Figure 1a. All units have ‘multi-purpose spaces’ (Yang and Stark Reference Yang and Stark2010), for common activities, with integrated kitchen and dining spaces, while five of them have separate sitting rooms.
The observations were made during the winter, which may have influenced the degree of presence in the indoor common spaces as well as the number of visitors and resident excursions outside the ALS. It can be argued, though, that this makes the winter the most appropriate time of the year to study the use of indoor spaces, since outdoor activities are less of an option.
Two limitations of the study relate to the main theme of mobility. Firstly, the problem of volition; we cannot know to what extent residents with low mobility status and high dependence spend time in the common spaces of their own free will, making them dependent on how the staff recognises and responds to volitional behaviour (Raber et al. Reference Raber, Teitelman, Watts and Kielhofner2010). Secondly, we cannot know to what extent the mobility of those who chose not to use the common spaces or participate in communal meals affected their choices.
Results and analysis
Somatic versus dementia units
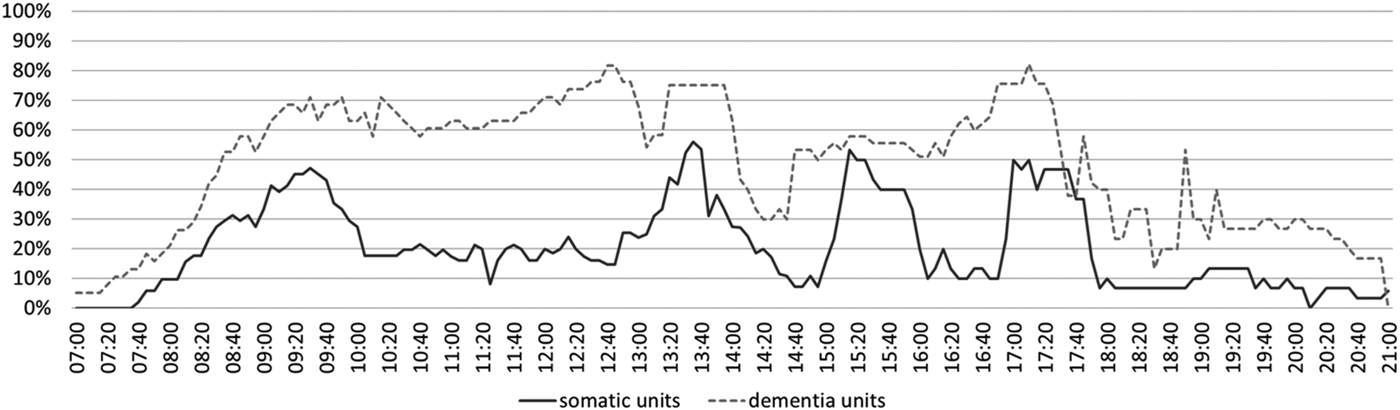
The common spaces are used more during meals on both the somatic and dementia units. The degree of use is measured by the average number of persons present (presence). A higher average presence is indicated on the dementia units, compared to the somatic units, both during and between meals (Figure 2).
The diagram shows the average presence of residents in the common spaces as a percentage of the total number of residents per unit. All observations between 07:00 and 21:00 are included. It shows the peaks during meals: breakfast (08:00–09:45), lunch (12:30–14:30), coffee and snacks (15:00–16:00) and supper (17:00–18:30). It also shows higher presence on the dementia units.
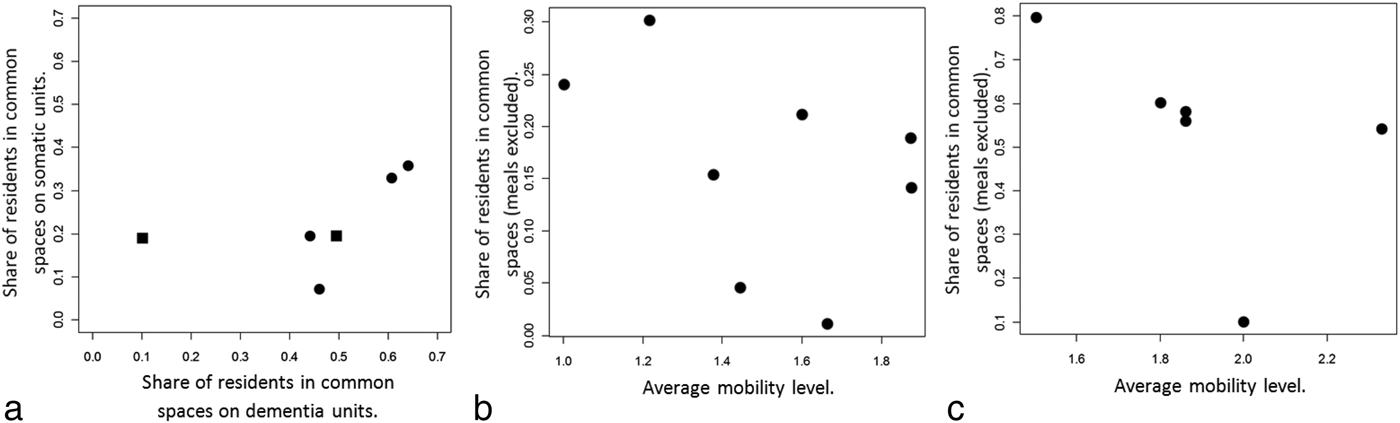
The higher presence on the dementia units is further validated by using a paired t-test (Fisher Box Reference Fisher Box1987). Four facilities, where comparable data are available, were compared during six periods; one somatic and one dementia unit were compared in each period. The results indicate a significantly higher degree of use on the dementia units. The mean value presence on the somatic units was 0.24 compared to 0.54 on the dementia units (Figure 3).
(a) Paired t-test: each circle or quadrant (circles: 07:00–13:00; squares: 15:00–21:00) represents the residents' average presence on a somatic and a dementia unit in the same facility. Mean value on somatic units: 0.24. Mean value presence on dementia units: 0.54. (b, c) Pearson's product-moment correlation: the circles represent eight somatic (b) and six dementia (c) units. An average share of all residents living on the unit, who were present in the common spaces between 07:00 and 21:00, is here related to the average mobility level (see Table 3) of the residents on each unit. Note that the scales differ between the diagrams.
Mobility

Notes: 1. The resident can walk by him- or herself, with or without walking aids. 2. The resident is dependent on a standard-sized wheelchair for transportation and can, by means of the wheelchair, move about independently within limited areas. 3. The resident is completely dependent on aid from the staff and, at the least, dependent on a large wheelchair for transportation.
The results show no significant correlation between the average presence and the average mobility of the residents. There is no significant correlation between good average mobility and high average presence when using Pearson's product-moment correlation (Rider Reference Rider1932) to compare eight somatic units and six dementia units, meals excluded (Figure 3). The proportion of residents who can walk independently does not differ significantly between the somatic and dementia units on average, nor does the proportion of residents who need some kind of wheelchair (Table 3). There are, however, twice as many residents on the dementia units that are completely dependent on help for their transportation.
The group interviews validate the higher presence on the dementia units. There is also a strong consensus among the staff that it is preferable to have the residents located in the common spaces on the dementia units. The reasons they express for this are to provide a social context for the residents and at the same time to obtain control over them. The group interviews also show that residents with non-diagnosed dementia on somatic units tend to stay longer in the common spaces:
On the dementia units, the residents use the sitting room more because they need to have visual contact with the staff. No one is in their apartment. If they don't see the staff they get agitated. (Carer on dementia unit)
Yes, you have control. Those who are ‘lucid’ are mostly in their rooms. Those who are not so clear watch TV in the sitting room. (Carer on somatic unit)
On the dementia units they have lost their functions and cannot cope on their own in the apartments. (Carer on dementia unit)
Those who can manage by themselves are in their apartments. But also on the somatic units we have residents with dementia [undiagnosed] who remain in the sitting room when the others leave. (Carer on somatic unit)
They are always with us in the sitting room; it is almost more like their home on the dementia unit. On the somatic [units] they go to their rooms. They don't feel comfy sitting out there. They go to their rooms, so there is a difference. (Carer on dementia unit)
The interviewed residents all lived on somatic units which makes a comparison with dementia units problematic. The individual interviews, however, support the idea of meals being the prime reason for coming together and that those who can choose tend to stay in their own apartments:
I seldom watch TV in the sitting room. Most residents have their own TV set in the apartment. We have coffee together every day. (Male resident, 73 years)
I'm not very interested in socialising with the others. Most people have their own TV set. (Male resident, 85 years)
All residents join at the meals, but afterwards they go to their own apartments. They all keep a distance. (Female resident, 87 years)
People don't socialise much here. All are very sick and deaf. I would like to socialise more but there is no one here. (Female resident, 92 years)
At the same time, all ten residents stressed the importance of the common spaces for social activities. They also pointed to the staff as social facilitators in the use of the common spaces. The dependence on the staff is discernible, both in relation to their social function and to their medical and service functions:
It is important to be able to meet others in the common spaces. It strengthens the social contacts. But after the meals everybody goes to their apartments. You rarely see anyone. The staff are very helpful. (Male resident, 73 years)
I think it is good to have social activities in the common spaces, otherwise you become a recluse. You get to meet people. I'm perhaps not fond of all staff members, but the staff are very important. It is nice when they sit down and talk. I wish they had more time. (Female resident, 87 years)
I have all my meals in the dining room and take part in bingo and exercises. To talk to other people is important, socially. (Female resident, 83 years)
It is important to gather together at meals. It is nice to know that we will have coffee and a chat at 11:00. It is socially important, very important. The other day I saw a lady choking. A staff member managed to get a chunk of meat out of her throat. It was a wonderful act! She saved the lady's life, but no one thanked her. She did it so fast. To me it was like a revelation, it was a great thing to do. (Male resident, 92 years)
It is important to be able to meet others in the common spaces. The staff are terribly important. Without them we would die! (Male resident, 102 years)
The relatives, architects and other key stakeholders represent a small sample of 11 individuals with different perspectives relating to ALS:
She [mother] tried to socialise but it was pointless since all the others were so tired and sick. She had more contact with the staff. I think she had hoped for more social interaction in the ALS. (Male with mother on a somatic unit)
He takes all his meals in the dining room and participates in all the social activities. Besides that, he spends all his time in his apartment or on the common terrace. (Female with father on a somatic unit)
No one uses the sitting room, except at meals. But sometimes the residents who are dependent on wheelchairs are placed in front of the TV set. Some of those who can walk by themselves walk around in the common spaces or sit there. (Female with mother on a dementia unit)
The common spaces are used very differently. They can be depressing; often you find very few people sitting there. I have always found them particularly difficult to design. They are so little used; it is difficult to create a social context. Most people are in their rooms [apartments]. The old and sick are wheeled out to watch TV but often they are too sick to even register what is happening. In dementia units they are more important. (Male architect)
I don't think you should exaggerate the importance of the common spaces. When I have visited an ALS the common spaces have been empty. The apartments are the most important. I think the common spaces are more important on the dementia units. (Male planner with strategic functions in planning elder-care facilities)
Being together is important, but the common spaces are often empty of people. We should make it possible for the residents to socialise with whom they like, not with the other residents just because they are neighbours. If you don't like your fellow residents [in dementia units] you get aggressive. The collective activities are based on outdated ideals from a rural society; we start from the wrong place and in the wrong time when we build AL facilities. (Female planner with strategic functions in elder-care planning)
Other than meals, few scheduled or planned activities took place in the common spaces. On the majority of the units, both dementia and somatic, the television was constantly on. On one dementia unit, however, the staff engaged the residents in reading aloud, parlour games and baking, and on one somatic unit the staff played cards and memory games with the residents. Other staff groups, e.g. physiotherapists, medical nurses and librarians, visited the units during week-day observations. There were also some social activities taking place in the assembly rooms, e.g. music performances or religious services. On these occasions, the staff made an effort in persuading the residents to participate. The group interviews also reveal the desire to engage the residents on the somatic units in social activities, as these comments from carers on somatic units show:
We bake, we have a computer for the staff in the sitting room and we watch movies. Sometimes they sit on the sofa waiting for their meals.
At the 12 o'clock snacks we try to have conversations, but it is not easy. It is hard to find topics to talk about.
I know it's like that in other places [other ALS facilities]. It's a pity when the TV rooms [sitting rooms] are so pretty. To get them to sit there, you have to lure them out.
In summary, the degree of use of common spaces differs between the somatic and dementia units, and the discrepancies are similar in both the group and individual interviews. The observations show a higher presence on the dementia units compared to the somatic, and also a more continuous use between meals. This result suggests that the residents on somatic units spend more time in their apartments, a finding that is confirmed through the group interviews, with the staff expressing a strong desire to relocate the residents to common spaces on the dementia units. Previous research has put forward other explanations for the higher presence. Residents suffering from various dementia conditions often display a wandering behaviour (Albert Reference Albert1992; Lai and Arthur Reference Lai and Arthur2003; Snyder et al. Reference Snyder, Rupprecht, Pyrek, Brekhus and Moss1978). Algase et al. (Reference Algase, Beattie, Antonakos, Beel-Bates and Lan2010) suggest that residents who wander go to the dining rooms in search of food. People with dementia also tend to request more attention from staff and seek the company of other people (Sloane et al. Reference Sloane, Mitchell, Weisman, Zimmerman, Foley, Lynn, Calkins, Lawton, Teresi, Grant, Lindeman and Montgomery2001). Furthermore, both Barnes (Reference Barnes2006) and Zimmerman et al. (Reference Zimmerman, Mitchell, Chen, Morgan, Gruber-Baldini, Sloane, Eckert and Munn2007) show that residents with cognitive impairments, or higher dependency, are more likely to frequent common spaces. It is also well known that residents with Alzheimer's disease suffer from visuospatial disturbances and disorientation (Kaskie and Storandt Reference Kaskie and Storandt1995; Morris Reference Morris1996).
The individual interviews suggest that the main reason for congregating is linked to communal meals. Residents, relatives, architects and other key stakeholders all agree that most residents who can choose for themselves prefer to spend time in their own apartments. The interviews also suggest that the physical and mental status of the majority of the residents in many cases makes it difficult to find a social venue for those who would have liked to socialise more.
The higher presence on the dementia units implies a concern among the staff to safeguard the residents by maintaining control. It also suggests a concern to provide a social context for those who cannot provide one for themselves. This suggests a possible incompatibility between the staff's desire to provide a social context for the residents and the competence of the residents (Lawton and Nahemow Reference Lawton, Nahemow, Eisdorfer and Lawton1973). On the somatic units where residents spend more time in the apartments, the staff have more respect for the intimacy of the residents. One conclusion to be drawn is that the staff assume a great responsibility for the residents on the dementia units and that their routines, to a greater extent, determine how the common spaces are used. A number of studies report similar conclusions (McColgan Reference McColgan2005; Nord Reference Nord2011a; Ryvicker Reference Ryvicker2011; Williams and Warren Reference Williams and Warren2009). Furthermore, no significant correlation was found between the average physical level of independent mobility and the average presence in the common spaces.
The studies present two other important findings concerning social interaction. The first shows that few visits or other external contacts occurred between 07:00 and 21:00; only on 12 occasions on the somatic units and eight on the dementia units. The majority (18) occurred between 12:00 and 18:00 on weekdays. Only on three of these occasions were the common spaces used. In addition, very few residents visited each other in their apartments.
The other finding shows that the residents very seldom left the facilities, for excursions, visits, shopping, etc. Residents left the facilities on seven occasions, two of which were with relatives. These findings indicate that the common spaces are the main arenas for social interaction with the staff and the other residents on the units. Their social importance is also highlighted by the staff in the interviews.
Intended versus actual use
The lack of space for devices to aid mobility indicates that the units were originally designed to house a different category of users. Spaces for storing mobility devices such as wheelchairs and Zimmer frames were lacking. It is clear that the residents have a lower degree of mobility than what was expected when the plans for constructing the units were drawn up. In one dementia unit, a large part of the sitting room was used by the staff for administrative and clerical work due to a general lack of space. In another renovated facility, where two units were merged into one, more common space was realised. The effectiveness and efficiency of these spaces can, however, be questioned, since as noted above, they are scarcely used by the residents. This solution complicates the visual control that staff have over the spaces. Furthermore, an L-shaped area presents bad daylight conditions with indirect light via a deep balcony. The original design and the building structures of ALS1 and ALS2 place a limit on what could be achieved through renovation (Figure 1).
Space shortage results in spatial conflict between a residential and a workplace perspective. The staff unanimously pointed out problems with space shortage in relation to the increasing use of mobility devices and a lot of effort is devoted to moving residents with low mobility to common spaces:
Kitchen and dining spaces are small and wheelchairs take too much space. There has to be room for us [the staff] to help the residents eat, for instance! (Carer on dementia unit)
The sitting room is large, but when there are activities [e.g. meals] it still gets crowded. I think it is made for people who can walk by themselves, not for wheelchair users. There is no room for them. (Carer on somatic unit)
The shortage of space is apparent because of the wheelchairs. (Carer on dementia unit)
When people talk about wheelchairs, they have younger people in mind, who get in and out of cars. The ones we use here are much bigger. (Carer on somatic unit)
The big wheelchairs are in the way when other wheelchairs pass, which can lead to conflict. (Carer on dementia unit)
However, the individual interviews with residents show a different perception of the space shortage. Nine out of ten residents state that the common spaces are large and functional and all four relatives agree. This suggests that the space shortage is mostly related to the workplace perspective.
Discussion
This study shows that common spaces were used more, as well as more continuously over the day, on dementia units, suggesting that the residents on somatic units spend more time alone in their apartments. It is, furthermore, indicated that residents with no mobility restrictions do not necessarily frequent the common spaces. The results show that a lot of staff effort is given to moving residents in wheelchairs and finding space for them in the communal areas, suggesting that the staff have both a social and an organisational incentive to move the residents to the common spaces to provide a social context as well as maintaining control. The staff experience and undertake considerable responsibility for the wellbeing of the residents and they have a comprehensive role in determining how, and to what extent, residents use the common spaces. The group interviews also confirm that staff on dementia units tend to locate the residents in the common spaces more often than on the somatic units, implying that they have more influence on the location of residents with cognitive and mobility limitations.
The study suggests that the residents are older and more dependent than in the past and that the facilities were not designed for their needs. This trend has important consequences for daily life in the units and the use of the common spaces. The increasing number of mobility devices block up common spaces, as well the available space within the apartments, thereby causing user conflict on several levels.
The first conflict is between the abundance of assistive technology and the intention to provide a home-like environment. The subsequent space shortage illustrates the discrepancy between the intended target group and the actual users. Space shortage is a fact also in the apartments, where space for assistive equipment is lacking and the corridors are often used.
The second conflict is between, on the one hand, the requirements placed on the working environment, e.g. the use of technical devices or the use of the common kitchens for food preparation, etc. and, on the other hand, the residents' need for residential space. This illustrates the dichotomous function of the ALS as home and workplace and the diverging residential and workplace perspectives. It is also notable that nine out of ten residents find that the spaces, both in their apartments and in the common spaces, are large enough. This suggests that this issue is closely related to the workplace perspective.
The third conflict concerns the discrepancy between the staff's strong desire to provide a social context for the residents and the capabilities of the residents. The staff's ambitions concerning the use of the common spaces are subverted by the current situation, which demonstrates the discrepancy between the intended function and actual use of space. Most residents who can choose prefer to spend their time alone in their apartments and they do not use common spaces between meals. At the same time, they agree that common spaces are important for social interaction. For some residents, this could mean that they would like to use the common spaces more often. It also suggests that the qualitative aspects of the use of space are important.
The fourth conflict concerns the physical organisation of the units. This conflict can, in turn, be expressed as one between, on the one hand, the conceptualisation and design phase and, on the other hand, their daily use. An illustration of this conflict is when organisational change results in a part of the sitting room used by staff for administrative work and where two units were merged into one, resulting in redundant spaces for common activities.
A fifth conflict concerns the disagreement between an intended home-like environment and the need for organisation of common spaces that is generally agreeable to most residents. On the one hand, the staff can have knowledge and experience about creating a home-environment for the specific residents and about their own work environment. On the other hand, the architects and planners, involved in designing the environments, have to create robust facilities for a general public over a period of time. This is, of course, particularly problematic as the target group is continuously changing. However, the limited number of architects and planners included in the study makes it difficult to compare the views of them and of the other participants.
The results also show that the residents on average had very few visitors and other external contacts on the units, and that they seldom left the facilities. Furthermore, residents seldom visited each other in their apartments. This further strengthens the hypothesis that the common spaces, to a great extent, constitute the venue for communal social interaction between the residents and between the residents and the staff. The importance of the common spaces for social interaction is also emphasised in the interviews. Other activities, such as the use of telephone, internet or television, are not accounted for here.
Common spaces were also used on relatively few occasions as a venue for social interaction by the residents and their relatives. The extent to which this was a choice of the residents or their relatives is not evident. This highlights the functional demarcation between the apartments and the common spaces. The visit thus represents a personal and private action preferably occurring in the privacy of the apartment, or ‘at home’, and implies a limitation in the use of the common spaces.
Conclusion
Most professionals involved with elder-care have been aware of the shortcomings of ALS environments for a long time. New ideas concerning assistance and care have emerged continuously, both from research and practice. Building design strategies to meet these new ideas has not developed at the same pace. The target group of ALS is likely to change in the future, as it has up to now. New as well as rebuilt, or renovated, facilities will be used for many years, while user requirements are developing continuously. Short-term organisational changes may change the preconditions for daily use. However, short-term changes may also create conflict between the intended functions of common spaces and their actual use, e.g. when three units are reorganised into two.
Long-term guidelines for planning and designing ALS that take into account continuously changing conditions are demanded by service providers, architects and planners. This paper contributes to developing more evidence-based knowledge about ALS conditions and illustrates the dynamic development of sheltered housing concepts for the older population. It also contributes to the discussion of the communal functions of ALS in relating the Swedish context to the international body of research.
The findings are relevant to the planning of ALS facilities. Common spaces have a central role in daily life on the units, revolving around communal meals. This also suggests that special attention needs to be paid when planning spaces for food preparation and dining. Common spaces are more often used on dementia units, accentuating the special needs among these users. Special attention has to be given to the use of assistive technology when planning for ALS; this concerns the use of space in both apartments and common spaces. Foreseeable conflicts between residential and workplace aspects should be avoided, necessitating a proper assessment of all the required functions of an ALS unit in relation to their impact on daily use.
Acknowledgements
This study was financed in equal measure by Chalmers University of Technology, Department of Architecture and the City of Gothenburg.