Introduction
The genus Vexillata is a trichostrongyloid nematode parasite of the superfamily Geomyidae and only one species, V. noviberae, has been reported as parasitic in lagomorphs (Sylvilagus spp.: Leporidae) (Durette-Desset & Digiani, Reference Durette-Desset and Digiani2005; Digiani et al., Reference Digiani, Kinsella and Durette-Desset2007). These nematodes inhabit the small intestine of their hosts in the Nearctic and northern Neotropical regions, with direct life cycles (Durette-Desset, Reference Durette-Desset, Baker and Muller1985; Sukhdeo et al., Reference Sukhdeo, Sukhdeo, Black and Vrijenhoek1997; Anderson, Reference Anderson2000). Recently, Escalante et al. (Reference Escalante, Martínez-Salazar, Falcón-Ordaz, Linaje and Guerrero2011) analysed the known localities of Vexillata and its host species (exclusively in Geomyidae and Heteromyidae) to perform a panbiogeographic analysis. This method of evolutionary biogeography is employed to identify spatial homology, suggesting a common history between different taxa (Morrone, Reference Morrone2001). Escalante et al. (Reference Escalante, Martínez-Salazar, Falcón-Ordaz, Linaje and Guerrero2011) postulated the existence of a generalized track supported by one species and its host (V. tejerai and Heteromys anomalus), explained that its geographical expansion could be related to the vagility of its host (Heteromys), and suggested the need for more studies regarding their distribution data.
The geographical distribution and environmental conditions of hosts (definitive or intermediate) are fundamental information that is needed in order to select and restrict the environmental conditions in studies of species distribution models (SDMs), as well as to understand how one species of parasite can complete its life cycle in natural populations, and how the parasites are distributed spatially among available hosts (Masuoka et al., Reference Masuoka, Burke, Colaccico, Razuri, Hill and Murrell2009; Haverkost et al., Reference Haverkost, Gardner and Peterson2010; Waltari & Perkins, Reference Waltari, Perkins, Morand and Krasnov2010). SDMs – also named ecological niche models – are used in many biogeographical studies, because they can be interpreted as potential distribution areas of taxa. To generate SDMs, some conditions are required: (1) the presence of data of the species of interest recorded or known (e.g. usually data points of localities or data recovered from online databases of museum specimens); (2) digital layers of environmental and climatological variables associated with spatial characteristics of the occurrence data (Elith & Leathwick, Reference Elith and Leathwick2009); and (3) a modelling algorithm (Phillips et al., Reference Phillips, Anderson and Schapire2006). There are different algorithms used to model SDMs; however, an algorithm of maximum entropy (MaxEnt; Phillips et al., Reference Phillips, Anderson and Schapire2006; Phillips & Dudík, Reference Phillips and Dudík2008) represents an accurate method widely used in the literature because of its performance with a low quantity of data to predict the geographic distribution (see Elith et al., Reference Elith, Kearney and Phillips2010).
The uses of SDMs include the parasitology field, as these host–parasite systems are sophisticated evolutionary models that can become a potential source of information for many areas of study, such as distribution modelling (e.g. Peterson et al., Reference Peterson, Sánchez-Cordero, Beard and Ramsey2002; Guo-Jing et al., Reference Guo-Jing, Vounatsou, Xiao-Nong, Utzinger and Tanner2005; Cruz-Reyes & Pickering-Lopez, Reference Cruz-Reyes and Pickering-Lopez2006; Masuoka et al., Reference Masuoka, Burke, Colaccico, Razuri, Hill and Murrell2009; Haverkost et al., Reference Haverkost, Gardner and Peterson2010). Given the strong physiological dependence in these systems to complete their life cycles – at least in one host (e.g. definitive, intermediate, vectors, etc.) – they are ideal to study SDMs as an evolutionary system (Guo-Jing et al., Reference Guo-Jing, Vounatsou, Xiao-Nong, Utzinger and Tanner2005; Masuoka et al., Reference Masuoka, Burke, Colaccico, Razuri, Hill and Murrell2009; Kulkarni et al., Reference Kulkarni, Desrochers and Kerr2010).
The modelling of host–parasite systems has been used to predict the potential range expansion of invasive species (Fitzpatrick et al., Reference Fitzpatrick, Dunn and Sanders2008) and to examine and analyse the distributions of parasites with complex life cycles (Peterson et al., Reference Peterson, Sánchez-Cordero, Beard and Ramsey2002; Cruz-Reyes & Pickering-Lopez, Reference Cruz-Reyes and Pickering-Lopez2006). It can also be used to assess the potential distribution of populations at risk and for the control of diseases that cause human morbidity (Guo-Jing et al., Reference Guo-Jing, Vounatsou, Xiao-Nong, Utzinger and Tanner2005), or to predict emerging diseases (zoonosis) based on the potential range of parasites and vectors (e.g. Peterson et al., Reference Peterson, Sánchez-Cordero, Beard and Ramsey2002, Reference Peterson, Bauer and Mills2004, Reference Peterson, Lash, Carroll and Johnson2006; Peterson & Shaw, Reference Peterson and Shaw2003; Guo-Jing et al., Reference Guo-Jing, Vounatsou, Xiao-Nong, Utzinger and Tanner2005; Moffett et al., Reference Moffett, Shackelford and Sarkar2007; Swenson, Reference Swenson2008; Masuoka et al., Reference Masuoka, Burke, Colaccico, Razuri, Hill and Murrell2009; Kulkarni et al., Reference Kulkarni, Desrochers and Kerr2010). For mammalian–helminth systems, Masuoka et al. (Reference Masuoka, Burke, Colaccico, Razuri, Hill and Murrell2009) modelled the potential distribution of some species of a sylvatic nematode, which has a host range of mammals in North America. Also, Haverkost et al. (Reference Haverkost, Gardner and Peterson2010) modelled the distribution of a cestode parasite, with several mammals, based only on the occurrence data of the parasites, given that the geographic range of the intermediate host (or hosts) is not well known. Moreover, Fuentes et al. (Reference Fuentes, Sainz-Elipe and Sáez-Durán2007, Reference Fuentes, Sainz-Elipe, Sáez-Durán and Galán-Puchades2009) explored the role of small mammals as biological indicators in the post-regeneration process of Mediterranean forest ecosystems using Geographic Information Systems (GIS). To the best of our knowledge, there are no other studies that have used SDMs and GIS models in mammalian–helminth systems.
Peterson (Reference Peterson2006) mentioned two approaches for analysing the modelling of transmission diseases, inductive and deductive. These approaches have been extrapolated to SDMs in host–parasite systems in wildlife. In the first approach, part of the parasite's life cycle is used to predict the geographical distribution of the whole system (e.g. using data points of several definitive or intermediate hosts, or selecting part of the life stage of development when not all stages of the life cycle are known or confirmed) (Haverkost et al., Reference Haverkost, Gardner and Peterson2010). The second approach analyses the host–parasite range distributions of each host in the life cycle separately, and it works principally in systems with strong host specificity without occasional transmission (Hafner et al., Reference Hafner, Demastes, Spradling, Reed and Page2003).
Here, we perform SDMs of Vexillata and its hosts in order to explore potential distributional areas, to confirm the geographic pattern of the genera and its hosts, and to give some recommendations for the conservation of the mammalian–helminth system.
Materials and methods
Study area and data collection
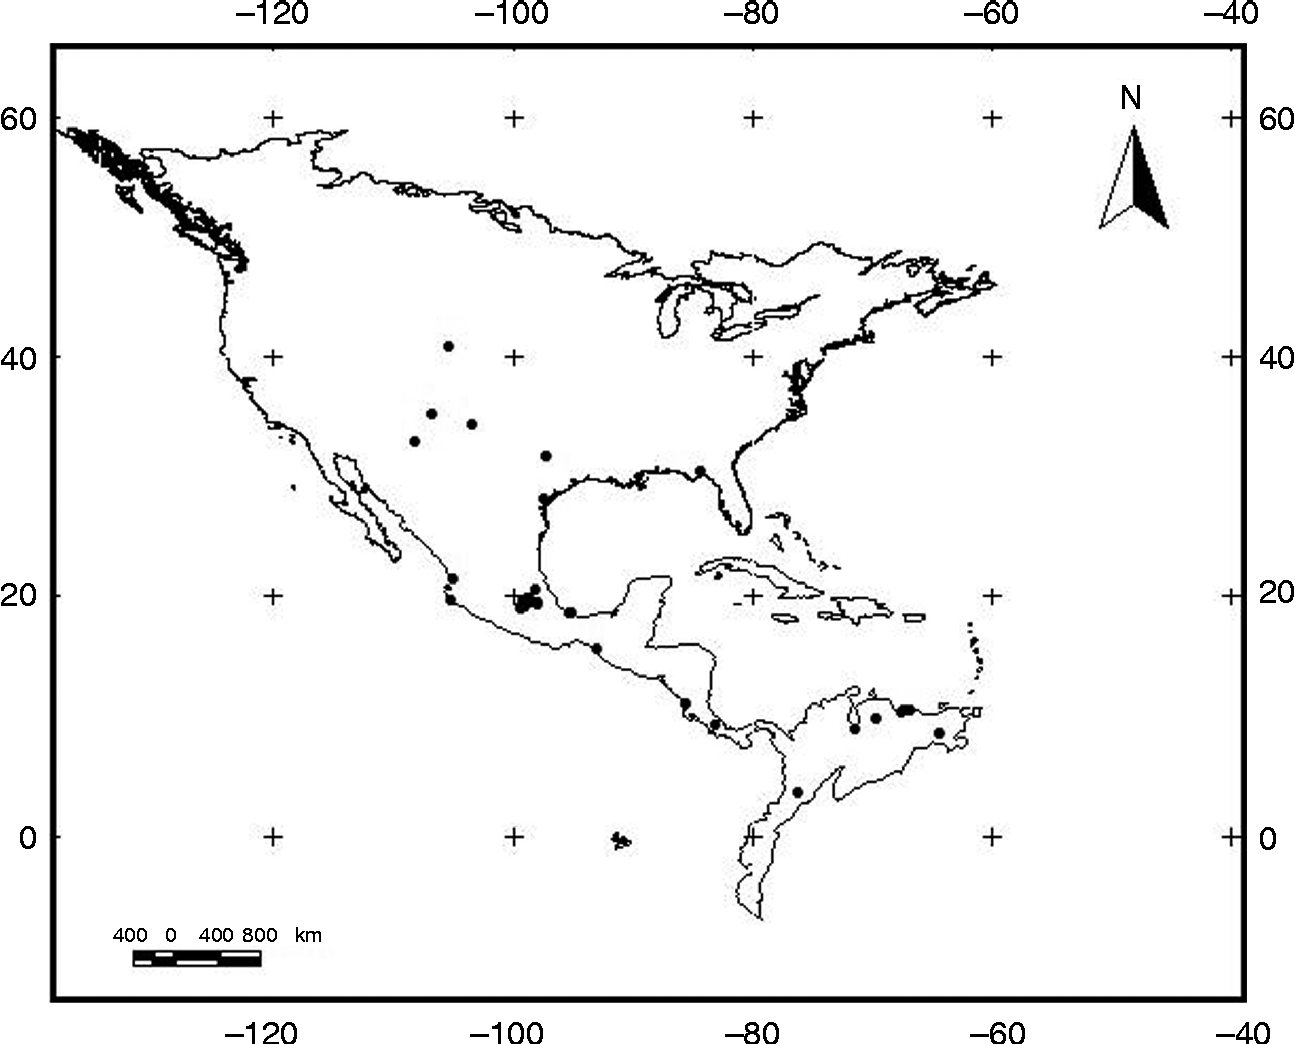
We compiled a database of 14 species of Vexillata (see Escalante et al., Reference Escalante, Martínez-Salazar, Falcón-Ordaz, Linaje and Guerrero2011), including the geographic coordinates of their localities. Of the species, five have only one presence record (V. brooksi, V. chabaudi, V. chitwoodi, V. geomyos and V. scorzai), three species have two records (V. dessetae, V. legalle and Vexillata sp.), one species has three (V. armandae), one species has four (V. liomyos), two species have six (V. tejerai and V. vexillata) and one species has seven records (V. convoluta). We have no records for V. noviberae. Because of the low number of localities for species of Vexillata, we merged all records in a database for the genus, resulting in 33 localities (fig. 1). In addition, we obtained the model for V. tejerai (with six records).
Distribution of species of Vexillata (black dots) in America.

We also compiled a database of the 16 hosts of Vexillata of the order Rodentia (see Escalante et al., Reference Escalante, Martínez-Salazar, Falcón-Ordaz, Linaje and Guerrero2011): Chaetodipus hispidus with 428 localities; Cratogeomys fulvescens, 7; C. merriami, 128; C. thylorinus, 97; Geomys attwateri, 35; G. pinetis, 36; Heteromys anomalus, 52; H. australis 9; H. desmarestianus, 277; H. irroratus, 1685; H. pictus, 1869; H. salvini, 79; Perognathus flavus, 693; Thomomys bottae, 483; T. talpoides, 697; and T. umbrinus, 521.
We chose a study area approximately between 60°N latitude and 7°S latitude in America (fig. 1). Because there is no biogeographical regionalization of the whole of America, we chose the boundaries of this area including the following ecoregions: temperate grasslands, savannas and shrub lands, temperate coniferous forest, deserts and xeric shrub lands, and temperate broadleaf and mixed forests (http://www.worldwildlife.org/science/ecoregions/item1847.html; Olson et al., Reference Olson, Dinerstein, Wikramanayake, Burgess, Powell, Underwood, D'Amico, Itoua, Strand, Morrison, Loucks, Allnutt, Ricketts, Kura, Wettengel and Kassem2001). The southern boundaries are delimited by the provinces of the Caribbean subregion and the North Andean Paramo province of the South American transition zone (Morrone, Reference Morrone2006).
Data analysis
Species distributional models were obtained using a maximum entropy algorithm included in MaxEnt (Phillips et al., Reference Phillips, Anderson and Schapire2006; Phillips & Dudìk, Reference Phillips and Dudík2008). This method has been shown to provide accurate predictions of the probabilistic expectation of finding a surrogate in a cell (Elith et al., Reference Elith, Graham, Anderson, Dudík, Ferrier, Guisan, Hijmans, Huettmann, Leathwick, Lehmann, Li, Lohmann, Loiselle, Manion, Moritz, Nakamura, Nakazawa, Overton, Peterson, Phillips, Richardson, Scachetti-Pereira, Schapire, Soberón, Williams, Wisz and Zimmermann2006; Phillips & Dudìk, Reference Phillips and Dudík2008). The algorithm initiates with a uniform distribution probability, and, iteratively, alternates variable weights to maximize the possibility of reaching the optimal distributional probability. The algorithm will converge at some point, so the results obtained are deterministic (Phillips et al., Reference Phillips, Anderson and Schapire2006).
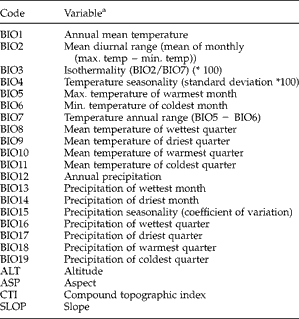
To construct the SDMs, 23 environmental data layers were used (table 1). Topographic layers were obtained from HYDRO1k (http://edc.usgs.gov/products/elevation/gtopo30/hydro/namerica.html), while the climatic data layers were derived from the WorldClim database (http://www.worldclim.org/; Hijmans et al., Reference Hijmans, Cameron, Parra, Jones and Jarvis2005). These variables, together with occurrence data, were used to obtain distributional models, using 25% of the localities to validate the model internally (except for V. tejerai). The algorithm uses a series of rules to calculate probabilities. For the present analysis, all rules were used, so the program selects the adequate one depending on the amount of available data. The rules used are: (a) lineal: uses the variable by itself; (b) quadratic: uses the square of the variable; (c) product: uses the product of two variables; (d) threshold: uses a binary transformation (0, 1) of a continuous variable using a threshold; and (e) hinge: like lineal, but constant under the threshold. The algorithm determines which rule to use as follows: lineal if there are < 10 points; lineal + quadratic if there are 10–14 points; lineal + quadratic + hinge if there are 15–79 points; and all of the rules if there are >80 points.
Environmental layers used in the species distribution models (SDM) of Vexillata and its rodent hosts in America.
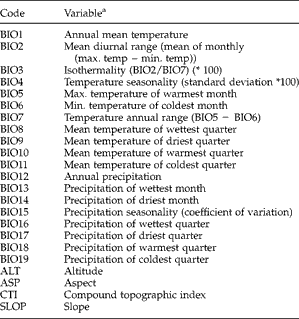
a Temperatures are in °C, precipitation in millimetres, slope in metres. All with a pixel size of 0.01° (1 kilometre resolution).
Models were obtained in logistic output format. Model success was evaluated using two criteria: the threshold-independent area under the curve (AUC) > 0.7, and P< 0.05 for at least one binomial test, as recommended by Pawar et al. (Reference Pawar, Koo, Kelley, Ahmed, Chaudhuri and Sarkar2007).
Models were obtained in ASCII format, and exported directly to a GIS (ArcView v. 3.1). The models were refined to obtain actual distributional models or geographical distributions by removing areas that are unlikely to contain a species in spite of their environmental suitability. In this analysis, the refinement process used was the threshold of 0.5 probability for hosts, considering it as a stringent threshold (Waltari & Guralnick, 2009) that can recover more probable areas of presence. In the case of Vexillata, and because we considered that there are no localities with geo-reference errors, we used the minimum training presence value as threshold (0.156) (Giovanelli et al., Reference Giovanelli, Ferreira de Siqueira, Haddad and Alexandrino2010). The same threshold was chosen for V. tejerai, with a value of 0.479.
Results
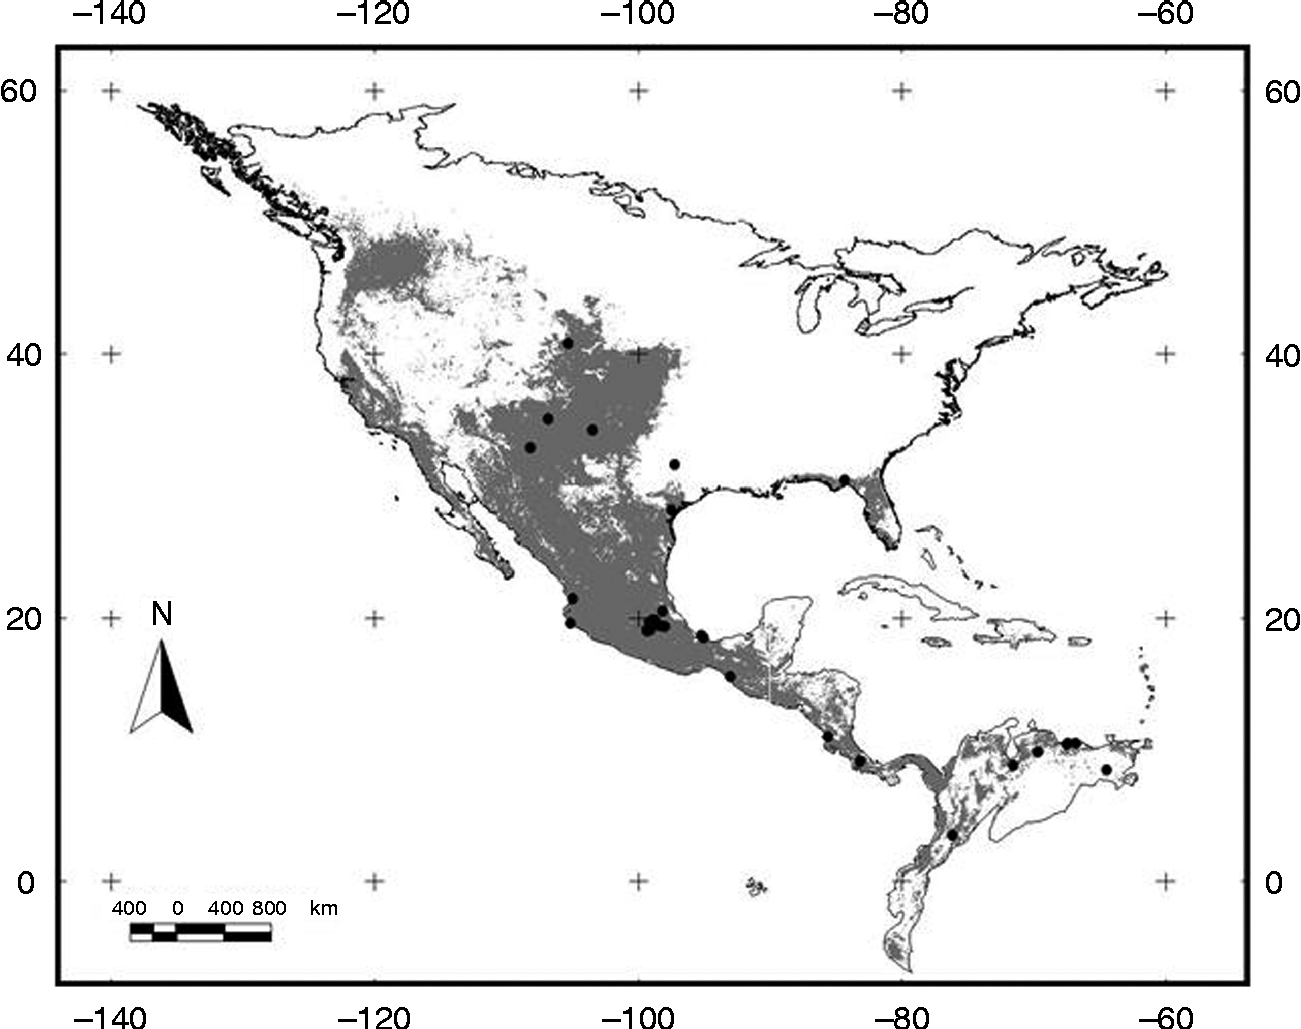
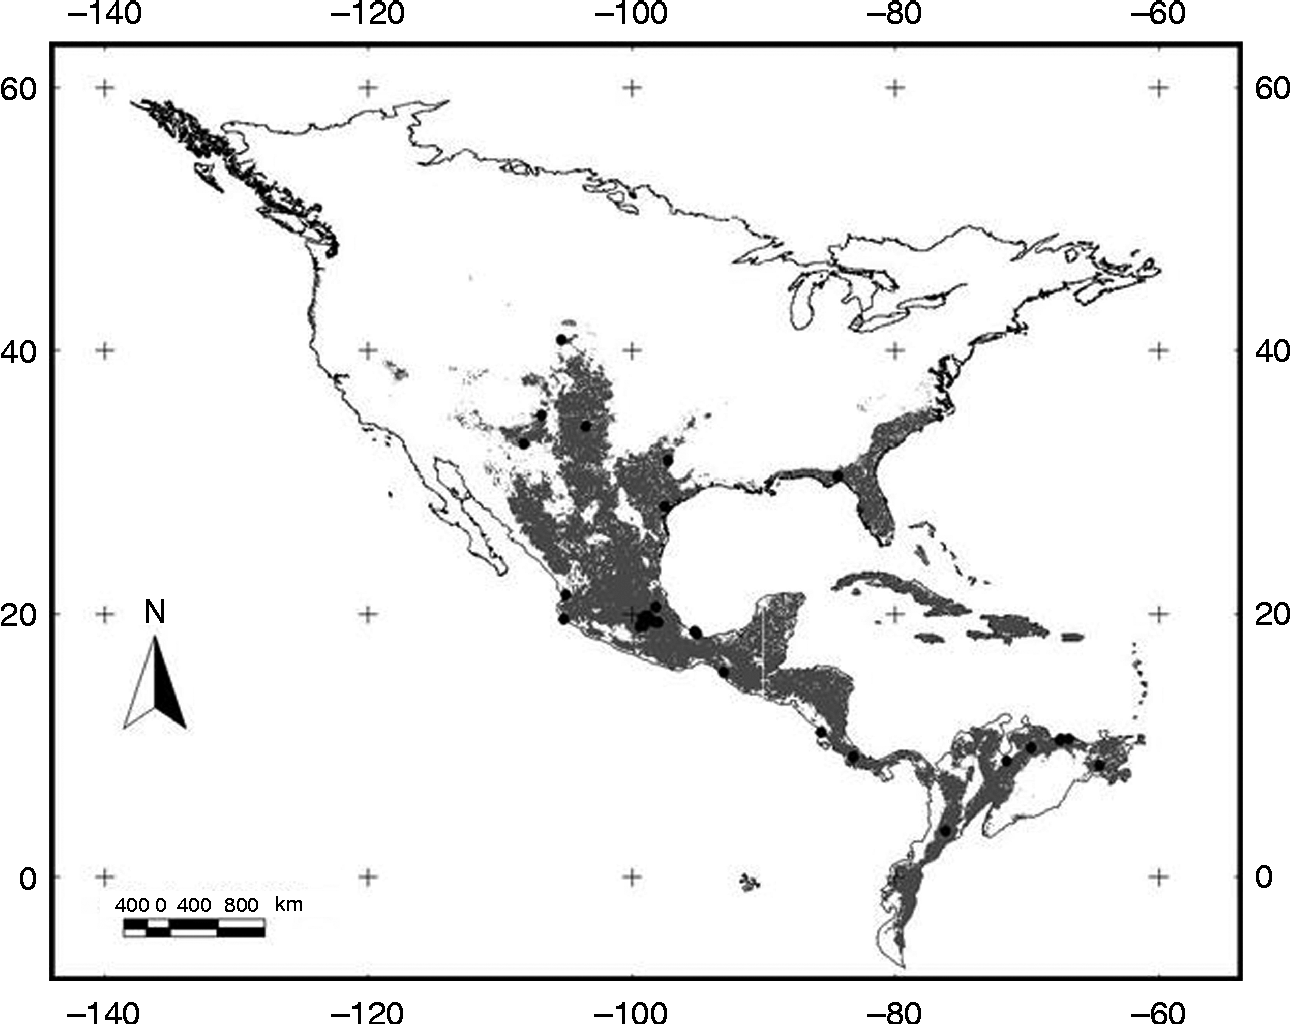
We obtained one model for the genus Vexillata, 16 models for the hosts and one model for V. tejerai, and the predicted geographic distributions produced by MaxEnt (figs 2 and 3).
Overlapped species distribution models (SDMs) of the 16 hosts of Vexillata (grey background) in America.
Potential distribution of Vexillata spp. (grey background) in America.
Hosts of Vexillata are potentially distributed across almost all of our study area from the latitude of 50°N, except for some areas of the western and eastern USA, the Antilles and the Yucatán Peninsula. Vexillata is found in the central USA, excluding the Baja California Peninsula but including the Antilles and the Yucatán Peninsula.
The model for Vexillata had an AUC value of 0.95, and the environmental layers that contributed the most were temperature seasonality (BIO4, 42.6%), isothermality (BIO3, 13.9%) and altitude (ALT, 10.4%). For eight species of mammals (Cratogeomys fulvescens, C. merriami, C. thylorinus, Heteromys anomalus, H. australis, H. desmarestianus, H. irroratus and H. salvini), temperature seasonality (BIO4) was the environmental layer with the highest contribution to the models, followed by isothermality (BIO3; for Thomomys bottae and T. umbrinus), annual mean temperature (BIO1; for Chaetodipus hispidus and Geomys attwateri) and precipitation of the warmest quarter (BIO18; for G. pinetis and T. talpoides). Mean diurnal range (BIO2) had a high contribution only for Perognathus flavus, and precipitation seasonality (BIO15) for H. pictus. Altitude (ALT) was the second variable with the highest contribution to four species of mammals (Cratogeomys fulvescens, C. merriami, G. pinetis and P. flavus); and isothermality (BIO3) was the second most important for H. pictus and T. talpoides.
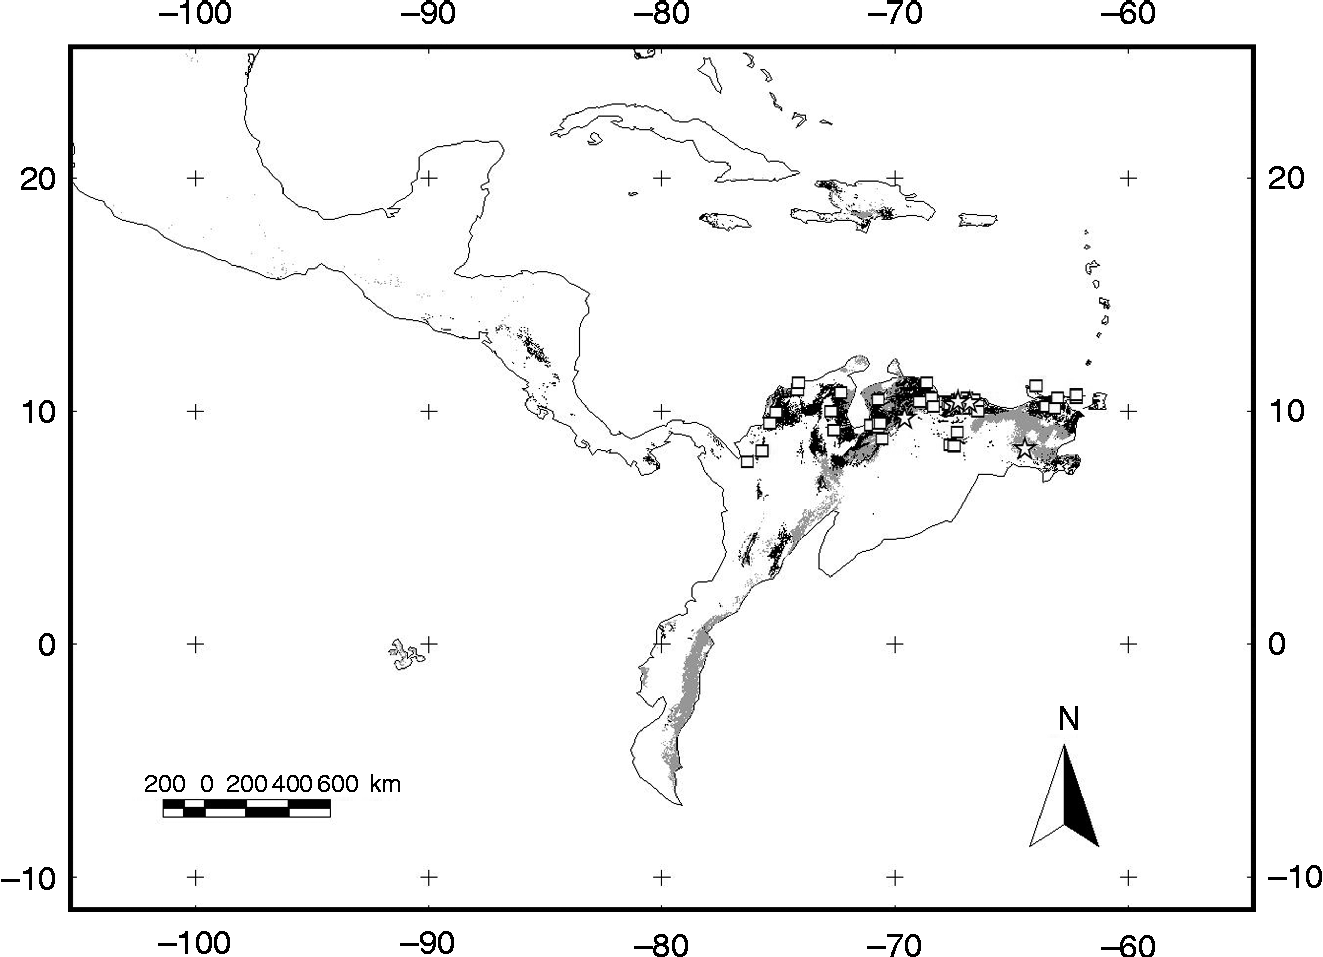
Models obtained for V. tejerai and H. anomalus are predicted to be primarily in the northern part of South America with some prediction in Central America and the Antilles (fig. 4). The model for V. tejerai had an AUC of 0.994; this model showed that temperature seasonality contributed with 75.2%, and for its host, H. anomalus, it was also the most explicative, with 66.6%. The second variable that contributed the most for the predicted distribution of V. tejerai was precipitation of the coldest quarter (BIO19), and for its host was precipitation of the wettest month (BIO13) followed by BIO19.
Species distribution models (SDMs) of Vexillata tejerai (grey background, stars) and Heteromys anomalus (black background, open squares) in Central and South America.
Discussion
SDMs for terrestrial animals and plants are common, while models for marine, freshwater and soil-based organisms are scarce (Elith & Leathwick, Reference Elith and Leathwick2009), as also occurs with mammalian–helminth systems. It has been demonstrated that SDMs have shown a high capacity to predict details of geographic distributions of various parasites that infect humans as well as other hosts in natural populations (Peterson et al., Reference Peterson, Sánchez-Cordero, Beard and Ramsey2002; Cruz-Reyes & Pickering-Lopez, Reference Cruz-Reyes and Pickering-Lopez2006; Moffett et al., Reference Moffett, Shackelford and Sarkar2007; Masuoka et al., Reference Masuoka, Burke, Colaccico, Razuri, Hill and Murrell2009; Kulkarni et al., Reference Kulkarni, Desrochers and Kerr2010).
SDMs are important to obtain parasite distributions where currently there are few records of its species, and can serve as an indirect measurement of the mobility of taxa (Masuoka et al., Reference Masuoka, Burke, Colaccico, Razuri, Hill and Murrell2009). Parasites are restricted by the environment and depend on the mobility of their hosts; in the case of parasites with direct life cycles (e.g. that require only one host to complete their life cycle), this mobility is correlated with the external environment (including the seasonality) and the patterns of transmission (see Poulin & Morand, Reference Poulin and Morand2004).
Mobility in the free-living forms depends more on external conditions, as for particular stages of development of nematodes with direct life cycles. For example, some cases could be ‘relatively sessile’, if conditions are inadequate for survival, or be encysted, waiting for the best conditions to revive and continue their life cycle. Under poor conditions, for soil nematodes in their larval stages of development, non-feeding larvae can survive without moisture and food (Anderson, Reference Anderson2000). Also, parasites are rarely capable of crossing large oceanic distances by themselves to colonize related hosts in distant areas (Rohde & Hayward, Reference Rhode and Hayward2000).
Species of the genus Vexillata have a direct life cycle, and they depend on environmental conditions for their mobility (see ‘Heligmosoids’ in Anderson, Reference Anderson2000). Their transmission patterns depend on the geography of their hosts, as shown by Escalante et al. (Reference Escalante, Martínez-Salazar, Falcón-Ordaz, Linaje and Guerrero2011). How can we model the distributional area of parasites with a direct life cycle? To find a solution, we can predict the geographical distribution of the host using environmental conditions, and, then, restrict these conditions according to the parasite's life cycle and survival in natural populations.
This mammalian–parasite model is particular, as it is almost impossible to model the micro-environmental conditions of the small intestine of the mammalian hosts. Nevertheless, in consequence, we can approach a solution through the use of known environmental variables relevant to the distribution of the hosts. However, it must be remembered that the geographical distribution of host organisms can be affected by conditions other than environmental suitability (Decker et al., Reference Decker, Duszynski and Patrick2001; Masuoka et al., Reference Masuoka, Burke, Colaccico, Razuri, Hill and Murrell2009; Haverkost et al., Reference Haverkost, Gardner and Peterson2010; Waltari & Perkins, Reference Waltari, Perkins, Morand and Krasnov2010), including geographical barriers and interactions with other species.
In our case, temperature seasonality (expressed as standard deviation × 100) was the main variable in almost all models used to predict the distribution of Vexillata and its hosts. These results may not be uncommon for helminth parasites in general; for example, Decker et al. (Reference Decker, Duszynski and Patrick2001) conducted a study over 10 years in length, sampling heteromyid parasites in a desert area, and found that during the winter rainy season the prevalence of nematodes decreased while that of the rodents increased.
SDMs use the environmental characteristics of a species from known data sets and predict the environmental suitability of areas lacking records of the species in question. Because of the close relationship of Vexillata and its hosts, we expected similar models; however, some differences can be recognized between the models of hosts and Vexillata (figs 2 and 3). For example, the Yucatán Peninsula is not a potential area for the hosts but it is predicted for Vexillata; it could be suggested that the parasite can potentially extend to new ranges and infect new host species distributed there, such as the possibility of infection of Heteromys spp. within its unexplored distribution in the same geographical area.
The external environment plays an important role in the distributional patterns of host and parasite (co-evolutionary dynamics); in the possible scenario of switching to a new host, this could occur in a specific place when suitable ecological conditions are optimal (see Combes, Reference Combes2005). Based on our data, Vexillata could be predicted to undergo host-switching in the Yucatán Peninsula, to other Rodentia or Leporidae distributed there, such as Heteromys gaumeri, Orthogeomys hispidus yucatanensis or Sylvilagus floridanus yucatanicus (Hall, Reference Hall1981; Wilson & Reeder, Reference Wilson and Reeder2005). This hypothesis could be supported by the spectrum of hosts and range of distribution of the parasite in different genera of Rodentia (Escalante et al., Reference Escalante, Martínez-Salazar, Falcón-Ordaz, Linaje and Guerrero2011) and Leporidae (Sylvilagus) – unknown localities in Kansas and Florida (Durette-Desset & Digiani, Reference Durette-Desset and Digiani2005) excluded here.
Another alternative to the possible presence of Vexillata in the Yucatán Peninsula based on the result of the SDMs and on the little information available in respect of the environmental conditions for closed life cycles in other systems of the superfamily Trichostrongyloidea (Durette-Desset, Reference Durette-Desset, Baker and Muller1985; Sukhdeo et al., Reference Sukhdeo, Sukhdeo, Black and Vrijenhoek1997): it is known that H. desmarestianus (host of several species of Vexillata, see Escalante et al., Reference Escalante, Martínez-Salazar, Falcón-Ordaz, Linaje and Guerrero2011) builds nests in the burrows of gophers (Villa & Cervantes, Reference Villa and Cervantes2003), where the tunnel air temperature is between 25 and 27°C (Sosa, Reference Sosa and de1981). The temperature needed for proper egg incubation of other related nematodes (Heligmosoids) is 28°C in vitro (Anderson, Reference Anderson2000); so, if the environmental conditions are favourable in these microhabitats, they could promote infection and host-switching to other Rodentia hosts, hosts unexplored for Vexillata. The evolutionary history of the host mammals of Vexillata spp. could help us understand the pattern of infection and transmission to new hosts.
Conversely, in the Baja California Peninsula and the state of California (figs 2 and 3), species of the genera Thomomys (in particular T. umbrinus) are predicted to be distributed in this area, but Vexillata is not. However, according to Escalante et al. (Reference Escalante, Martínez-Salazar, Falcón-Ordaz, Linaje and Guerrero2011), this host system has not yet been collected in the Baja California Peninsula.
The predicted distributions of V. tejerai and H. anomalus show relevant overlap, even when the model of V. tejerai was performed only with six localities and the model of H. anomalus with only 38 (fig. 4). They share almost the same geographic areas in the north of the South American continent, in northern Venezuela and north-western Colombia, including the Maracaibo, Venezuelan Coasts, Venezuelan Llanos, Cauca (into the Caribbean subregion) and North Andean Paramo provinces (in the South American Transition Zone; Morrone, Reference Morrone2001). Although there are some predicted areas in Antilles and Central America (belonging to the Caribbean subregion, too), they can be considered as overprediction, because there are no known records of either of these species in these areas. Our results confirm the pattern found in the Parsimony Analysis of Endemicity (PAE) cladogram by Escalante et al. (Reference Escalante, Martínez-Salazar, Falcón-Ordaz, Linaje and Guerrero2011), and probably constitute an area of endemism.
SDMs can be used to select and prioritize new sampling regions for the Vexillata–mammal system in areas with discrepancy, in order to reject or corroborate predicted distributions. An important aspect to consider in host–parasite systems is related to landscape and climate changes (e.g. warmer temperatures, changes in rain patterns, increased frequency of extreme weather events). These changes could affect the prediction of niche modelling, as well as causing susceptibility to infection across the host ranges and directly limiting the real parasite distribution (Fayer, Reference Fayer2000; Deter et al., Reference Deter, Charbonnel, Cosson, Morand and Krasnov2010).
Despite their importance in ecosystems, the integration of natural environmental management and conservation is still limited in parasite species; there are no actual programmes for the conservation of parasite biodiversity because traditionally parasites are considered to be harmful to humans (see Lebarbenchon et al., Reference Lebarbenchon, Albespy, Brochet, Grandhomme, Renaud, Fritz, Green, Thomas, van der Werf, Aubry, Guillemain and Gauthier-Clerc2009). However, we caution against holding this traditional point of view; since parasite biodiversity is affected by human activities, it must therefore be included when evaluating conservation biology strategies (Deter et al., Reference Deter, Charbonnel, Cosson, Morand and Krasnov2010).
The conservation of host species (e.g. mammals) indirectly protects their parasite biodiversity, so increasing the sample size and geographical coverage in future studies will contribute to recommendations for their conservation. Results from panbiogeography and distribution models have been used in conservation strategies (e.g. Sánchez-Cordero et al., Reference Sánchez-Cordero, Cirelli, Munguía and Sarkar2005; García-Marmolejo et al., Reference García-Marmolejo, Escalante and Morrone2008); therefore, the results of both Escalante et al. (Reference Escalante, Martínez-Salazar, Falcón-Ordaz, Linaje and Guerrero2011) and those gathered in this study could be combined in an integrated conservation strategy for these taxa.
Acknowledgements
J.F.O. thanks Consejo Nacional de Ciencia y Tecnologia (CONACyT) for his Posdoctoral Fellowship through the programme ‘Estancias Posdoctorales y Sabáticas Vinculadas al Fortalecimiento de la Calidad del Posgrado Nacional, 2008’ at the Laboratorio de Morfología Animal, Centro de Investigaciones Biológicas, Universidad Autónoma de Estado de Hidalgo. E.A.M.S. thanks CONACyT for her Postdoctoral Fellowship at the University of Guelph, Ontario, Canada; as well as through the programme ‘Apoyos Complementarios para la Consolidación Institucional de Grupos de Investigación (Repatriación 2010)’. We are also grateful to an anonymous reviewer for useful comments on an earlier draft of this manuscript; and Tyler Elliott for the revision of the English language. This study was partially supported by CONACyT Project 80370 (T.E.) and FOMIX-ZAC-2011-01-C01-170798 (E.A.M.S.).