1 Introduction
In this paper, we aim to determine which acoustic measures correlate with primary and secondary stress in Tongan (Malayo-Polynesian, Austronesian; Blust Reference Blust2009), and to determine which of the measures best predict stress in the language. Studies of the acoustic correlates of stress date from pioneering work on English (Fry Reference Fry1955). However, the work in this area has focused on only a few languages, coming from a limited set of language families. There have been few acoustic studies of stress in Polynesian languages, and even fewer of Tongan in particular (but see Anderson & Otsuka Reference Anderson and Otsuka2003, Reference Anderson and Otsuka2006). Analyzing data from a wide array of cross-linguistic studies is vital for understanding how stress is realized in language in general, because it can offer an insight into which aspects of stress are universal and which are language-specific. For example, Gordon & Applebaum (Reference Gordon and Applebaum2010: 35–36) note the existence of languages in which typologically common acoustic measures of stress do not distinguish stressed from unstressed vowels, presumably because those measures serve as the primary cue to other contrasts, e.g. f0 in languages with lexical tone. Similarly, it is possible that duration may not be used to distinguish stressed and unstressed vowels in Tongan because it is a language with contrastive vowel length. By expanding acoustic studies of stress to a larger, more varied sample of languages, we will be better able to make cross-linguistic generalizations.
Previous studies have shown that multiple acoustic measures may correlate with stress in vowels. Stressed vowels are often found to have a higher fundamental frequency or pitch (Lieberman Reference Lieberman1960, Adisasmito-Smith & Cohn Reference Adisasmito-Smith and Cohn1996, Gordon & Applebaum Reference Gordon and Applebaum2010), greater intensity (Lieberman Reference Lieberman1960, Everett Reference Everett1998, Kochanski et al. Reference Kochanski, Grabe, Coleman and Rosner2005, Gordon & Applebaum Reference Gordon and Applebaum2010, Gordon & Nafi Reference Gordon and Nafi2012), and longer duration (Lieberman Reference Lieberman1960, Everett Reference Everett1998, Gordon & Applebaum Reference Gordon and Applebaum2010). Differences in F1 and F2, associated with differences in vowel quality, have also been found, including higher F1 (Cho & Keating Reference Cho and Keating2009, Gordon & Applebaum Reference Gordon and Applebaum2010). Researchers have also found differences in measures associated with voice quality or phonation (Sluijter & van Heuven Reference Sluijter and van Heuven1996). Not all of these acoustic measures necessarily correlate with stress for any given language; moreover, secondary stress may be cued differently than primary stress (Adisasmito-Smith & Cohn Reference Adisasmito-Smith and Cohn1996, Gordon & Applebaum Reference Gordon and Applebaum2010, Plag, Kunter & Schramm Reference Plag, Kunter and Schramm2011). In this study, we are interested in which of these measures correlate with stress in Tongan.
An area of particular interest is how stress will affect the Tongan vowel space. Stressed vowels are often more peripheral in the vowel space when compared to unstressed vowels. A common explanation for this pattern is that speakers systematically undershoot their articulatory targets in unstressed vowels, an account with a clear connection to the more general notions of phonetic undershoot and hyperarticulation (Lindblom Reference Lindblom, Hardcastle and Marchal1990). Undershoot at the synchronic level could represent the phonetic precursors leading to phonological, stress-based vowel reduction found in many languages.
This type of phonetic centralization (presumably due to undershoot) has been found in languages with five-vowel systems similar to the one found in Tongan, e.g. Castilian Spanish (Ortega-Llebaria & Prieto Reference Ortega-Llebaria and Prieto2011). Thus, we might expect unstressed vowels in Tongan to undergo centralization, yielding lower high vowels and higher low vowels. On the other hand, such a reduction strategy might be counterproductive in a language with few distinctive phonemes and relatively simple syllable structure such as Tongan; the potential loss of vowel contrasts would result in vast lexical neutralization. Therefore, it is possible that unstressed vowels in Tongan will not be subject to a reduction in the size of the vowel space.
There are also language-internal reasons to look at stress in Tongan. For one, stress plays an important role in the so-called ‘definitive accent’, whereby noun phrases undergo reduplication of the final vowel to mark that they are definite (Anderson & Otsuka Reference Anderson and Otsuka2006). Because stress is always penultimate, this reduplication in turn triggers a stress shift. In some cases, this results in a long vowel become trimoraic: compare non-definite [tamaˈsiʔi kaaˈkaa] ‘cunning boy’ vs. definite [tamaˈsiʔi kaakaˈaa].Footnote 1 Stress likely plays a primary role in cuing this contrast.
Stress may also be relevant for a controversial phonological process in Tongan called ‘syllable fusion’. It has been claimed that certain sequences of two vowels may be ‘fused’ into a single syllable (Churchward Reference Churchward1953, Feldman Reference Feldman1978, Poser Reference Poser, Goldberg, MacKaye and Wescoat1985, Schütz Reference Schütz2001), but there is disagreement as to which sequences of vowels may undergo the process (and under which conditions), with some claiming that the process never occurs at all (Taumoefolau Reference Taumoefolau2002). Measuring stress correlates could offer insights on the syllabic structure of these vowel sequences. Knowing how Tongan stress is realized acoustically is crucial for subsequent phonetic work looking at these phonological phenomena (for discussion, see Garellek & White Reference Garellek and White2010).
The paper is organized in the following manner: We first give a brief overview of the phonemes and stress system of Tongan. We then discuss our methodology, followed by the results of our study for each acoustic measure. Finally, we end with a discussion of our findings, their implications, and the conclusions of the paper.
1.1 Background information on the Tongan language
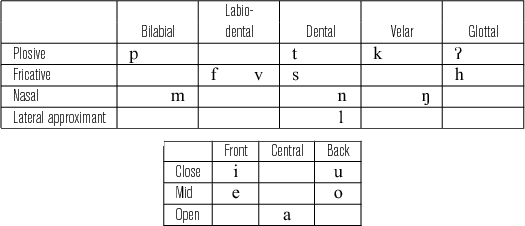
Tongan has twelve consonant phonemes and five vowel phonemes, presented in Table 1. In the consonants, Tongan has a voicing distinction only between the labiodental fricatives /f/ and /v/. For vowels, there is arguably a distinction between long and short vowels, as can be seen from pairs such as pepe [ˈpepe] ‘butterfly’ and pēpē [ˌpeːˈpeː] ‘baby’ (or [ˌpeeˈpee], see fn. 1 above).
Tongan consonant inventory (top) and vowel inventory (bottom).

Primary stress in Tongan always falls on the penultimate mora of a phonological word. Secondary stress assignment depends on morphology (Feldman Reference Feldman1978) and can be variable for loanwords (Zuraw, O’Flynn & Ward Reference Zuraw, O’Flynn and Ward2010), but always falls on the leftmost mora in the examples used in this study. In terms of post-lexical accent, each utterance is composed of multiple prosodic or ‘accentual’ phrases, which may include either a single content word, or else several smaller words and clitics. Each accentual phrase has post-lexical stress realized as a (usually) rising pitch accentFootnote 2 on the syllable bearing primary lexical stress, and a high- or low-targeted edge tone at the last syllable of the accentual phrase. Syllables with secondary stress sometimes receive the same rising pitch accent as syllables with primary stress, but this typically only occurs in long words (Kuo & Vicenik Reference Kuo and Vicenik2012). Phrasal accent has implications for our study, as we discuss in more detail in Sections 2.2 and 4.3 below.
2 Method
2.1 Participants
Four female native Tongan speakers living in the Los Angeles area participated in the study (approximate ages between 45 and 60 years old). All were from the main island Tongatapu (and spoke the same dialect), and had moved to the United States from Tonga as adults. At the time of the study, the speakers had been living in the United States for at least 10 years, but they reported that they still communicated in Tongan on a daily basis. The participants received a small monetary compensation for their participation.
2.2 Materials
For primary stress, we used CVˈCVCV words in which the first vowel was the same as the second vowel, for example talamu [taˈlamu] ‘to chew’. This allowed us to compare stressed and unstressed (short) vowels of the same type within the same word so that extraneous factors that may vary across repetitions (e.g. speaking rate) could be well controlled. Ten words of this type were selected for each of the five Tongan vowels. For secondary stress, the same set of words was used, but a CV suffix, usually the highly productive demonstrative suffix -ni, was added to each word. The resulting ˌCVCVˈCV–CV words allowed us to once again compare the first and second vowels, which now had secondary stress and no stress, respectively. Note that vowels with secondary stress were also word-initial, in contrast to vowels with primary stress. We discuss the implications of this in Section 3.1.2. A wide variety of consonants was used in each consonant position in order to control for consonantal effects on the target stressed/unstressed vowels.
Note that, in our study, all vowels with primary lexical stress also had post-lexical phrasal accent. The target words, as content words, each formed their own accentual phrase. Accentual phrases in Tongan always have a pitch accent that falls on the syllable with primary lexical stress. It would be very difficult (if not impossible) to disentangle the effects of lexical stress from post-lexical accent in Tongan. This issue is not unique to Tongan; in principle, it could apply in any language in which post-lexical phrases may be composed of single words (e.g. Farsi; Jun Reference Jun and Sun-Ah2005, Scarborough Reference Scarborough2007). In contrast, languages like English, where only some vowels with lexical stress also have post-lexical accent, allow more easily for the effects of stress and accent to be distinguished (e.g. Campbell & Beckman Reference Campbell, Beckman, Botnis, Kouroupetroglou and Carayannis1997, Cho & Keating Reference Cho and Keating2009). Nonetheless, we succeed in disentangling stress from accent with respect to secondary stress, because vowels with secondary stress were not pitch-accented in this study (owing to the relatively short length of the words elicited). We also ensured that accentual phrase-final edge tones did not influence the target sounds in this study because we only analyzed vowels up to the tonic syllable.
A full list of stimuli is provided in Appendix.
2.3 Procedure
The words were collected into a wordlist written in Tongan orthography, which was read by the speakers. Each word was repeated in the carrier phrase Angimui ‘a e fo‘ilea ko e ___ kiateau ([ˌaŋiˈmui ˈʔae ˌfoʔiˈlea ˈkoe ___ ˌkiateˈau]) ‘Repeat the word ___ for me’. Three repetitions were collected for each word, yielding a total of 30 tokens per speaker for each vowel for primary stress vs. unstressed and 30 tokens per speaker for each vowel for secondary stress vs. unstressed. The recordings were made in a UCLA Phonetics Lab sound booth using a Shure SM10A head-mounted microphone, whose signal ran through an XAudioBox pre-amplifier and A-D device. The recording was done using PCquirerX at a sampling rate of 22,050 Hz.
The first and second vowels of each word were labeled in PRAAT textgrids (Boersma & Weenink Reference Boersma and Weenink2009). The boundaries for vowels were segmented according to the beginning and end of a clear second formant. The labeled sound files were then run through VoiceSauce (Shue et al. Reference Shue, Keating, Vicenik and Yu2011) to obtain the acoustic measures, which were calculated for every millisecond. VoiceSauce calculates f0 using the STRAIGHT algorithm (Kawahara, Masuda-Katsuse & de Cheveigné Reference Kawahara, Masuda-Katsuse and de Cheveigné1999). VoiceSauce also outputs the duration of the labeled segment as well as values for F1, F2, and Root Mean Square (RMS) energy. The formants were measured using the Snack SoundToolkit (Sjölander Reference Sjölander2004).
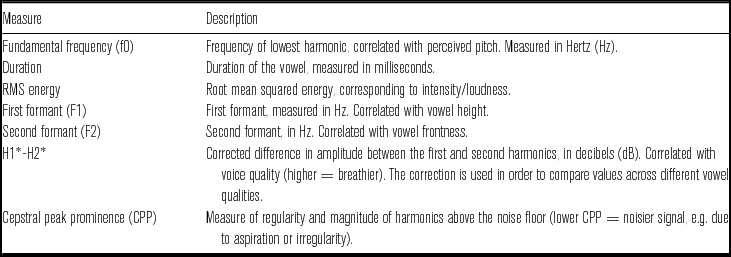
We also include here two acoustic correlates of voice quality: H1*-H2* and cepstral peak prominence (CPP). H1*-H2* is a measure of the difference in amplitude between the first and second harmonics (Bickley Reference Bickley1982). Its values have been corrected for formants (hence the use of asterisks) following the correction by Hanson (Reference Hanson1997) and Iseli, Shue & Alwan (Reference Iseli, Shue and Alwan2007), in order to enable cross-vowel comparison. H1*-H2* is perhaps the most commonly used harmonic measure of voice quality. Values of H1*-H2* are typically higher for breathy voice when compared to modal voice, and lower for creaky or laryngealized voice when compared to modal voice (Klatt & Klatt Reference Klatt and Klatt1990, Gordon & Ladefoged Reference Gordon and Ladefoged2001). CPP, calculated using the algorithm from Hillenbrand, Cleveland & Erickson (Reference Hillenbrand, Cleveland and Erickson1994), is a measure of noise and aperiodicity. Either aspiration noise during breathy voice or aperiodic voicing during creaky voice may result in lower values of CPP (Garellek & Keating Reference Garellek and Keating2011). Table 2 provides a summary of the acoustic measures recorded with a brief description of each measure.
Summary of acoustic measures.

The average values for each measure across the full duration of the vowels were calculated automatically by VoiceSauce, and the results were then saved to a text file for subsequent analysis.
3 Results
3.1 Linear mixed-effects analysis
In this section, we determine which acoustic measures differ significantly between stressed and unstressed vowels in Tongan. The values of each measure were analyzed using linear mixed effects models. These were implemented in R (R Development Core Team 2008) using the lmer() function of the lme4 package (Bates, Maechler & Dai Reference Bates, Maechler and Dai2008), following Baayen (Reference Baayen2008a: Chapter 7). Separate models were fitted for primary and secondary stress. All of the models contained a fixed effect for vowel (/i e a o u/) and three random intercepts: speaker, word, and repetition. These random effects significantly improved model fit according to likelihood ratio tests comparing models with and without the effect (using the anova() function in R, see Baayen Reference Baayen2008a), suggesting that there was indeed variation across individual speakers, words, and repetitions (the latter was likely due to the fact that speakers had a tendency to speak more quickly in later repetitions). However, by including these factors as random effects, we effectively controlled for any effect that they may have had on the results. Random slopes did not improve model fit, so none were included.
First, to determine the overall main effect of stress regardless of individual vowel, we ran a model with an added fixed effect for presence of stress (stress or no stress). For the main effect of stress, we report t-values provided in the model output, as well as p-values obtained using the pvals.fnc() function of the languageR package (Baayen Reference Baayen2008b), which estimates p-values by conducting Markov Chain Monte Carlo (MCMC) sampling with 10,000 simulations.Footnote 3
Second, to determine whether individual vowels differed from the overall pattern, we ran a model containing an interaction effect between vowel (/i e a o u/) and stress (stress or no stress). We compared this model to the model containing fixed effects for vowel and stress (but no interaction) using a likelihood ratio test, which evaluated whether the interaction effect significantly improved model fit. (Both models had the same random-effects structure.) If the interaction effect proved significant, we ran additional linear mixed-effects models on subsets of the data corresponding to each of the five vowels. These within-vowel models included a fixed effect for stress and the same random effects structures as the overall models. However, we used a Bonferroni-adjusted alpha level of .01 to account for the multiple comparisons (one for each of the five vowels). For within-vowel comparisons, we report the t-value from the model output as well as the p-value estimated by MCMC sampling (see above).Footnote 4
3.1.1 Fundamental frequency (f0)
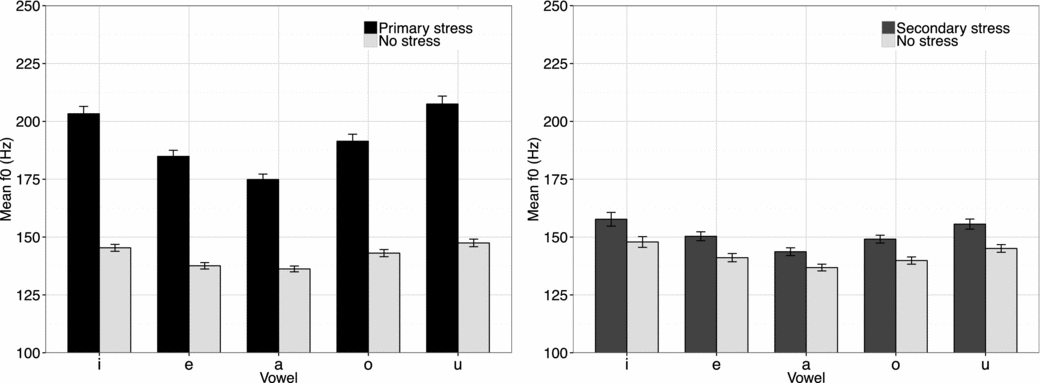
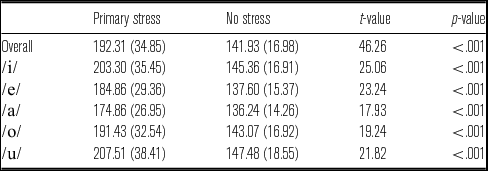
Figure 1 shows the mean values of f0 for primary and secondary stressed vowels and their unstressed counterparts. Vowels with primary stress have significantly higher f0 values overall (by about 50 Hz) than those without stress. A likelihood ratio test indicates that a vowel by stress interaction effect significantly improves model fit (χ2 (4) = 54.35, p < .001), suggesting that the magnitude of the primary stress effect varies across vowels. However, within-vowel comparisons show that the effect of primary stress remains significant for each of the vowels individually (Table 3). Vowels with secondary stress also have significantly higher f0 values than those without stress overall (t = 11.05, p < .001), but this difference of about 9 Hz is much smaller than the difference found for primary stress. A likelihood ratio test indicates that a vowel by stress interaction effect does not significantly improve model fit (χ2 (4) = 2.73, p = .60), suggesting that the effect of secondary stress on f0 does not vary significantly across vowels.
Mean f0 (in Hz) by vowel, for primary stress (left panel) and secondary stress (right panel). Error bars represent standard error of the mean.

Mean f0 (in Hz; standard deviations in parentheses) for vowels with primary stress and no stress, both overall and by individual vowel. t-values are taken from the linear mixed-effects models and p-values are estimated using MCMC sampling.

3.1.2 Duration
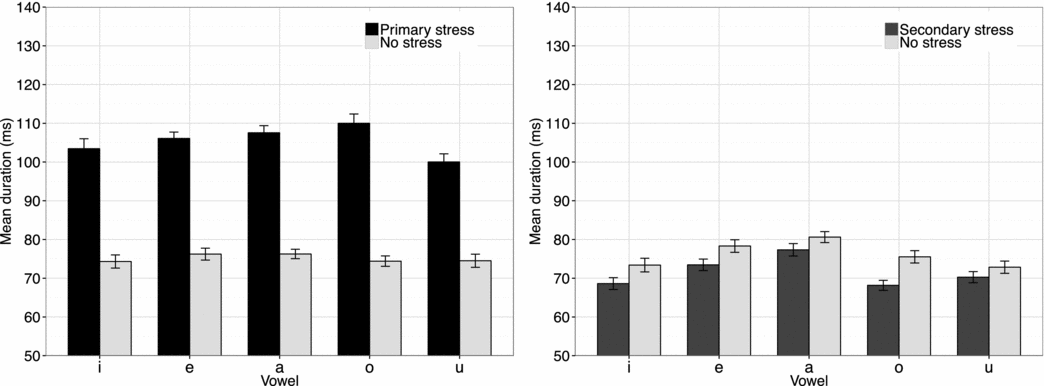
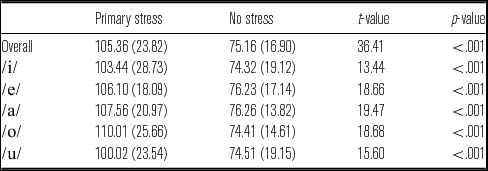
Figure 2 presents the mean durations for vowels with primary and secondary stress as well as their unstressed counterparts. We find that vowels with primary stress are significantly longer in duration (by about 30 ms) than unstressed vowels. A likelihood ratio test indicates that a vowel by stress interaction effect significantly improves model fit (χ2 (4) = 15.67, p = .003). Nonetheless, within-vowel comparisons show that this difference in duration holds for all five Tongan vowels individually (Table 4). Thus, the interaction between vowel and stress is due to the fact that the magnitude of the stress effect varies across vowels, even though the direction of the effect (longer vowels when stressed) does not.
Mean duration (in ms) by vowel, for primary stress (left panel) and secondary stress (right panel). Error bars represent standard error of the mean.

Mean duration (in ms; standard deviations in parentheses) for vowels with primary stress and no stress, both overall and by individual vowel. t-values are taken from the linear mixed-effects models and p-values are estimated using MCMC sampling.

For secondary stress, we find a surprising effect: vowels with secondary stress are slightly shorter than unstressed vowels (t = –6.18, p < .001). A likelihood ratio test indicates that a vowel by stress interaction effect does not significantly improve model fit (χ2 (4) = 4.80, p = .31), suggesting that the effect of secondary stress on duration does not vary significantly across vowels. It is possible that the shortened duration found for vowels with secondary stress was due to initial word position rather than to stress itself. However, this strikes us as unlikely because word initial positions are associated with increased duration in other languages (Turk & Shattuck-Hufnagel Reference Turk and Shattuck-Hufnagel2000).
3.1.3 RMS energy
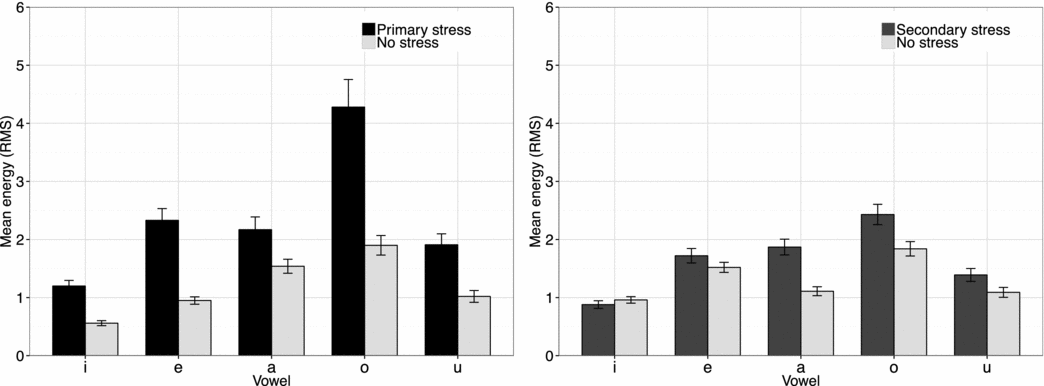
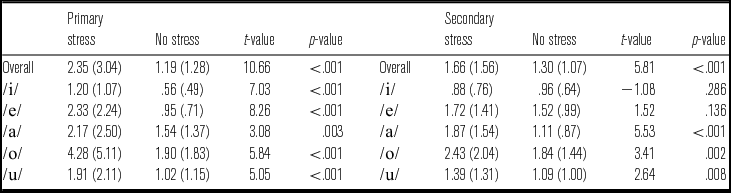
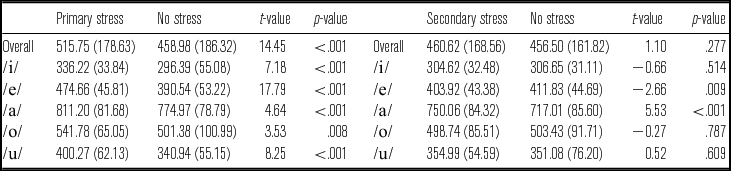
Figure 3 shows the mean values of RMS energy for vowels with primary and secondary stress as well as their unstressed counterparts. We find significantly greater energy in vowels with primary stress than in unstressed vowels. A likelihood ratio test indicates that a vowel by stress interaction effect significantly improves model fit (χ2 (4) = 37.18, p < .001), suggesting that the magnitude of this effect varies across vowels. Within-vowel comparisons indicate that each of the five vowels has greater energy when stressed, but to differing degrees (Table 5). We also find that vowels with secondary stress have significantly higher energy than unstressed vowels overall. Moreover, a vowel by stress interaction effect significantly improves model fit (χ2 (4) = 24.06, p < .001). Within-vowel comparisons reveal that the effect of secondary stress on energy is only significant for the vowels /a/, /o/, and /u/ (Table 5).
Mean RMS energy by vowel, for primary stress (left panel) and secondary stress (right panel). Error bars represent standard error of the mean.

Mean RMS energy (standard deviations in parentheses) overall and by vowel, for primary stress vs. no stress (left panel) and secondary stress vs. no stress (right panel). t-values are taken from the linear mixed-effects models and p-values are estimated using MCMC sampling.

3.1.4 First and second formants
Overall, we find that the F1 for vowels with primary stress is significantly higher than the F1 for unstressed vowels by about 57 Hz. A likelihood ratio test indicates that a vowel by stress interaction effect significantly improves model fit (χ2 (4) = 24.23, p < .001). However, within-vowel comparisons indicate that the difference in F1 is significant for all five of the Tongan vowels in the same direction: higher F1 for vowels with primary stress (Table 6).
Mean F1 (in Hz; standard deviations in parentheses) overall and by vowel for primary stress vs. no stress (left panel) and secondary stress vs. no stress (right panel). t-values are taken from the linear mixed-effects models and p-values are estimated using MCMC sampling.

The main effect of secondary stress does not reach significance, but a likelihood ratio test reveals that a vowel by stress interaction effect significantly improves model fit (χ2 (4) = 16.76, p = .002). Within-vowel comparisons reveal that the vowel /a/ has a greater F1 under secondary stress compared to no stress. The vowel /e/ has a lower F1 under secondary stress, but this difference is very small. There is no significant difference in F1 due to secondary stress for vowels /i/, /o/, and /u/ (Table 6).
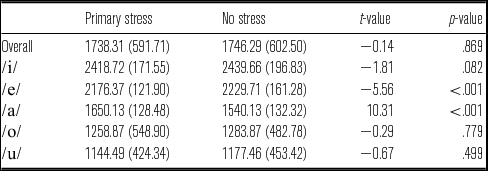
Looking at the F2 values, we find no significant main effect of primary stress on F2 overall, but a likelihood ratio test indicates that a vowel by stress interaction effect significantly improves model fit (χ2 (4) = 10.72, p = .03). Within-vowel comparisons (Table 7) reveal that the vowel /a/ has a significantly higher F2 when it has primary stress compared to no stress, and the vowel /e/ has a significantly lower F2 under primary stress. There is no significant difference based on primary stress for the vowels /i/, /o/, and /u/.
Mean F2 (in Hz; standard deviations on parentheses) for vowels with primary stress and no stress, both overall and by individual vowel. t-values are taken from the linear mixed-effects models and p-values are estimated using MCMC sampling.

For secondary stress, the main effect on F2 was not found to be significant (t = .47, p = .65). In addition, adding a vowel by stress interaction effect did not significantly improve model fit (χ2 (4) = 7.13, p = .13).
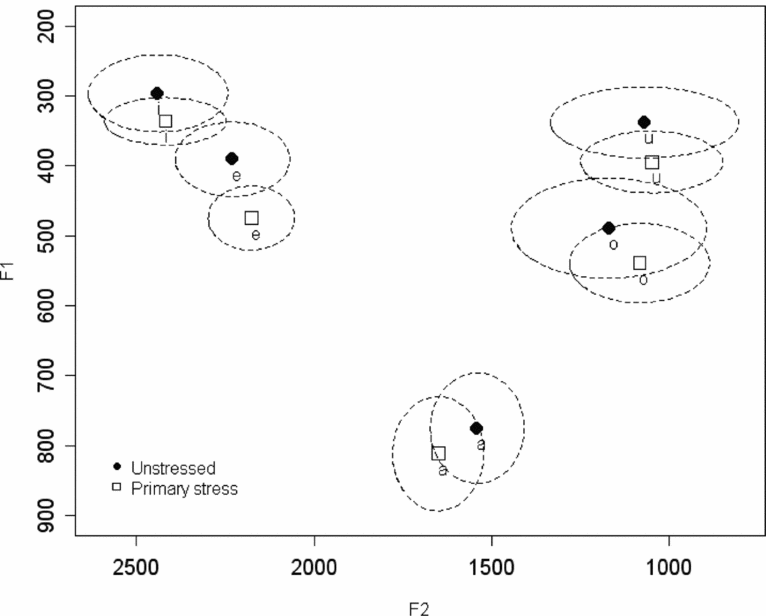
As seen in the vowel plot in Figure 4, vowels with primary stress in Tongan are generally lower in the vowel space (i.e. have a higher F1) than their unstressed counterparts. Thus, there is an overall shifting-up of all vowels in the vowel space when unstressed. This shift in F1 is generally not accompanied by a significant change in F2, except for /a/ (which has a higher F2 when stressed) and /e/ (which has a slightly lower F2 when stressed).
Vowel plot for primary stress vs. unstressed vowels. F1 × F2 clouds show one standard deviation from mean value.

It should also be noted that the vowel space in Figure 4 shows little to no overlap between the five vowels – even when they are unstressed. For each vowel, there is some overlap between the two stress conditions (e.g. between stressed /u/ and unstressed /u/), but the data show that in Tongan both stressed and unstressed vowels are well dispersed. Note that if the unstressed vowels were subject to phonetic undershoot, we would expect an overall smaller vowel space (and potentially some overlap between the five vowel categories) for unstressed vowels. The implications of this pattern in the vowel space will be discussed in greater detail Section 4.1.
3.1.5 Voice quality measures (H1*-H2* and CPP)
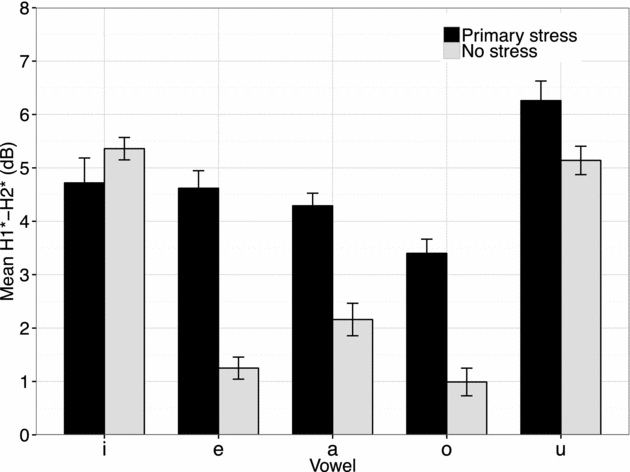
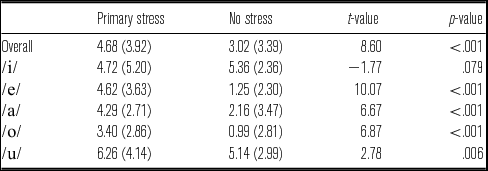
The results for H1*-H2* (see Figure 5) show a significant main effect for primary stress. A likelihood ratio test indicates that a vowel by stress interaction effect significantly improves model fit (χ2 (4) = 50.85, p < .001). Within-vowel comparisons show that all vowels but /i/ have significantly higher H1*-H2* values when they bear primary stress than when they are unstressed. For /i/, there was no significant change in H1*-H2* as a function of stress (Table 8). H1*-H2* is a measure of relative voice quality, and it can be difficult to interpret specific values in absolute terms. Vowels with primary stress may have higher values of H1*-H2* because they are breathier relative to unstressed vowels, or because unstressed vowels are creakier. To distinguish between these two possibilities, we report below the results for CPP (Hillenbrand et al. Reference Hillenbrand, Cleveland and Erickson1994), which decreases under noise from both breathiness and aperiodicity due to creaky voice (Garellek & Keating Reference Garellek and Keating2011). Thus, if the higher H1*-H2* values under primary stress are accompanied by low values for CPP, we can conclude that vowels are breathier when they bear primary stress. On the other hand, if vowels with primary stress have high CPP values, we can conclude that stressed vowels are less creaky (i.e. have less noise due to aperiodicity) than unstressed vowels.
Mean H1*-H2* by vowel, for primary stress (left panel) and secondary stress (right panel). Error bars represent standard error of the mean.

Mean H1*-H2* (in dB; standard deviations in parentheses) for vowels with primary stress and no stress, both overall and by individual vowel. T-values are taken from the linear mixed-effects models and p-values are estimated using MCMC sampling.

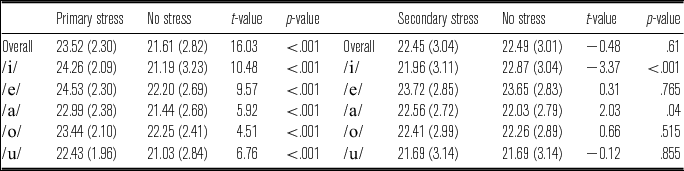
The results for CPP also show a significant main effect for primary stress. A likelihood ratio test indicates that a vowel by stress interaction effect significantly improves model fit (χ2 (4) = 34.71, p < .001), suggesting that the magnitude of the primary stress effect varies across vowels. However, within-vowel comparisons show that all vowels have significantly higher CPP values when they bear primary stress than when they are unstressed (Table 9). Taken together, the higher values of both H1*-H2* and CPP indicate that vowels with primary stress are clearer (i.e. less noisy) than unstressed vowels.Footnote 5 We discuss this issue in more detail in Section 4.2 below.
Mean CPP (in dB; standard deviations in parentheses) overall and by vowel for primary stress vs. no stress (left panel) and secondary stress vs. no stress (right panel). t-values are taken from the linear mixed-effects models and p-values are estimated using MCMC sampling.

The main effect of secondary stress on H1*-H2* was found to be non-significant (t = 1.36, p = .18). In addition, adding a vowel by stress interaction effect did not significantly improve model fit (χ2 (4) = 8.54, p = .07).
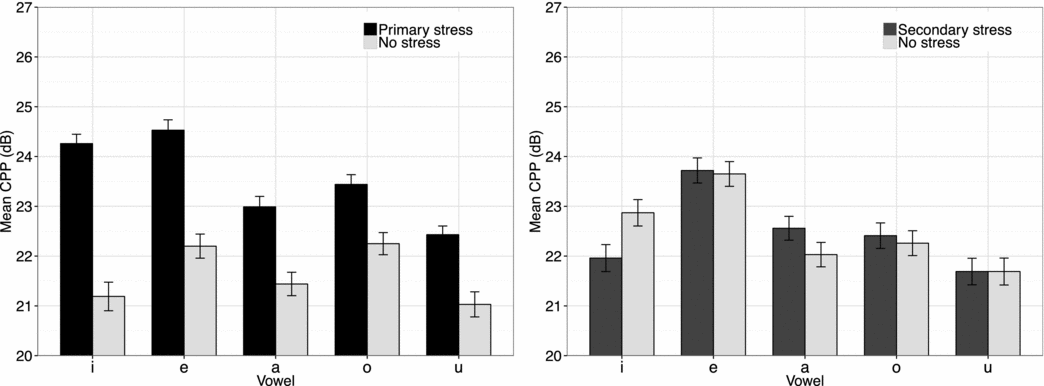
There was no significant main effect of secondary stress on CPP (see Figure 6). However, a likelihood ratio test indicates that a vowel by stress interaction effect significantly improves model fit (χ2 (4) = 17.57, p = .001). Within-vowel comparisons show that unstressed /i/ had a higher CPP than /i/ with secondary stress, but the difference was non-significant for each of the other vowels (Table 9).
Mean CPP by vowel, for primary stress (left panel) and secondary stress (right panel). Error bars represent standard error of the mean.

3.2 Linear discriminant analysis
The previous analyses focused on which measures differ significantly as a function of stress. In this section, we use linear discriminant analysis (LDA) to determine which of the measures from the previous analysis are most useful in discriminating vowels with primary stress from unstressed vowels, and vowels with secondary stress from unstressed vowels. We kept both data sets separate (instead of collapsing all unstressed vowels into one category) because unstressed vowels came from two word lists (those for primary vs. secondary stress), and differed in terms of their word position between both sets; unstressed vowels in the primary stress data set were word-initial in a three-syllable word, and those in the secondary stress data set appeared in the second syllable of a four-syllable word.
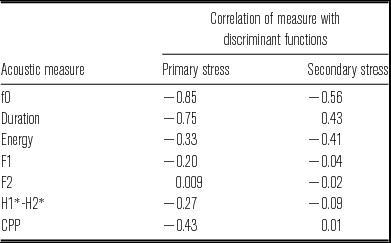
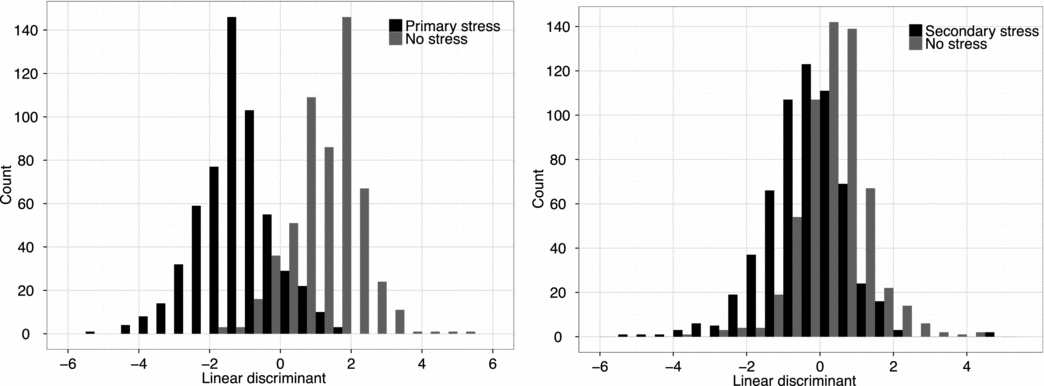
The LDA outputs a single function that can best discriminate the two categories (primary stress vs. no stress, or secondary stress vs. no stress) using a combination of all the acoustic measures provided. We included all of the acoustic measures in the LDA (see Table 10), regardless of their significance in the linear regression models above. For primary stress, the overall Wilks's Lambda was significant (Λ = .38, F(8,1110) = 227.23, p < .0001), indicating that the acoustic measures could successfully discriminate between vowels with primary stress and those with no stress. The model correctly classified 89.1% of tokens. For secondary stress, the overall Wilks's Lambda was also significant (Λ = .88, F(8,1172) = 19.31, p < .0001), indicating that the acoustic measures could successfully discriminate between vowels with secondary stress and those with no stress. However, the discriminant correctly classified only 64.5% of secondary stress vs. unstressed tokens. As seen in Figure 7, the linear discriminant for primary stress vs. unstressed vowels (left panel) separates the two stress categories better than the discriminant for secondary stress vs. unstressed vowels (right panel).
Results of linear discriminant analysis.

Histograms of the tokens (coded by stress category) plotted according to their linear discriminant function values. The left panel shows the linear discriminant for primary stress vs. no stress, and the right panel shows the discriminant for secondary stress vs. no stress.

The linear discriminant functions in the LDA incorporate all of the acoustic measures, but each measure contributes a different amount to each function. To gauge the relative contributions of the measures to each of the discriminant functions, we calculated the Pearson's r correlations between each measure and the values generated by the two functions (i.e. the values plotted in Figure 7).
Table 10 shows the correlations between the discriminants and each of the acoustic measures. Both discriminants (the one for primary stress vs. no stress, and the one for secondary stress vs. no stress) correlate most strongly with f0 and duration, and the discriminant for secondary stress correlates with energy as well. Fundamental frequency and duration are thus used by both discriminants, but in different capacities.Footnote 6
Thus, even though multiple measures can differentiate stressed from unstressed vowels when considered individually (particularly for primary stress), f0 and duration are found to be most important for discriminating vowels with primary or secondary stress from vowels with no stress. This analysis suggests that these measures may serve as the most reliable stress cues to listeners as well.
4 Discussion
In this study we found that multiple measures distinguish stressed and unstressed vowels. In particular, vowels with primary stress are marked by higher f0, higher F1, longer duration, higher energy, higher H1*-H2*, and higher CPP relative to vowels without stress. Though multiple measures correlate with stress in Tongan, the linear discriminant analysis showed that f0 and duration were the most useful cues for discriminating between stressed and unstressed vowels. With the exception of F1 and F2 (discussed below), these results are generally consistent with findings that have been reported for stress correlates in other languages (see Section 1 above).
We also find that primary stress is correlated with a different set of measures than secondary stress in Tongan, which is similar to Adisasmito-Smith & Cohn's (Reference Adisasmito-Smith and Cohn1996) findings for Indonesian. In particular, duration, f0, and energy are found to be consistently different in vowels with secondary stress and unstressed vowels, a subset of those found to be significant cues for primary stress.
In the remainder of this section, we discuss several aspects of our results in more detail. In Section 4.1, we focus on the effect of primary stress on the Tongan vowel space, arguing that the results are more consistent with a sonority expansion strategy (Beckman, Edwards & Fletcher Reference Beckman, Edwards, Fletcher, Docherty and Ladd1992, de Jong, Beckman & Edwards Reference de Jong, Beckman and Edwards1993) than with an account based on phonetic undershoot. In Section 4.2, we discuss the implications with regard to stress and voice quality. Finally, in Section 4.3, we consider the possible effect that the confounding of word stress and phrasal accent had in our study.
4.1 Phonetic targets and the effects of stress on the vowel space
Recall that the Tongan vowel space was neither expanded nor reduced in unstressed vowels relative to vowels with primary stress (Figure 4). Instead, all five vowels were higher in the vowel space (i.e. had lower F1) when unstressed, with no change in the overall size of the vowel space. This pattern of results is informative for our understanding of phonetic targets and how they are realized within the context of a stress system. As we describe below, the Tongan results are not consistent with some common accounts of how vowel quality is affected by stress (or lack of stress).
Crosswhite (Reference Crosswhite2001) discusses two common phonological vowel reduction systems: centralization of the unstressed vowels (e.g. as in English) and merging vowel contrasts (e.g. as in Catalan and Italian). Yet even in languages without phonological vowel reduction, we expect a tendency for a phonetically reduced acoustic vowel space in unstressed vowels (Flemming Reference Flemming2005). Indeed, this is often discussed in terms of phonetic ‘undershoot’. In Lindblom's (Reference Lindblom, Hardcastle and Marchal1990) ‘Hyper- and Hypoarticulation’ theory, the input to the speech system at the time of production represents an ideal goal that the speaker intends to produce. In certain speech conditions in which the duration of speech sounds is reduced (e.g. casual speech and unstressed vowels), articulatory targets may not be fully reached, resulting in what is commonly called undershoot. Similarly, in the Articulatory Phonology framework (Browman & Goldstein Reference Browman and Goldstein1986, Reference Browman and Goldstein1990), each speech sound is associated with a set of articulatory gestures. In running speech, gestures in close proximity overlap. Under conditions where speech sounds have shorter durations, these gestures have greater overlap due to the temporal compression. As a result, the gestural targets may not be fully realized. Johnson, Flemming & Wright (Reference Johnson, Flemming and Wright1993) likewise discuss what they call the ‘hyperspace’ effect, in which careful speech is characterized by a larger overall vowel space than reduced speech. Over time, the tendency to reduce the vowel space for unstressed vowels due to articulatory undershoot (a phonetic effect) may lead to phonological patterns of vowel reduction that we see in many of the world's languages (e.g. see Flemming Reference Flemming2005, Barnes Reference Barnes2012).
In Tongan, we found that unstressed vowels indeed had shorter durations than vowels with primary stress (see Table 4 above). Therefore, it is reasonable to expect that unstressed vowels in Tongan should be subject to undershoot and a reduced vowel space (Flemming Reference Flemming2005). However, the particular pattern found in Tongan does not follow from any of the theories discussed above. As the vowel space plot in Figure 4 above shows, the overall size of the Tongan vowel space is not reduced for unstressed vowels as predicted by the hyperarticulation account; rather, the size of the vowel space is comparable for stressed and unstressed vowels. Moreover, the vowel space for unstressed vowels resembles neither of the two phonological systems of vowel reduction discussed by Crosswhite (Reference Crosswhite2001): the unstressed vowels are not moving towards the center of the vowel space (as in centralization) and they are not moving closer to each other (as in contrast merging). Rather, all of the vowels, including the high vowels, are higher in the vowel space when unstressed.
We propose that the relationship between Tongan stressed and unstressed vowels is not one characterized by undershoot or the hyperspace effect, but rather by a shifted vowel space that retains both its overall size and the relative distance between the vowels within that space. This kind of pattern has been referred to as ‘sonority expansion’ (e.g. Beckman et al. Reference Beckman, Edwards, Fletcher, Docherty and Ladd1992, de Jong et al. Reference de Jong, Beckman and Edwards1993), whereby all vowels exhibit jaw lowering under stress to enhance sonority. Beckman et al. (Reference Beckman, Edwards, Fletcher, Docherty and Ladd1992) argued that sonority expansion might account for the increased jaw displacement for accented (phrasally-stressed) [ɑ] in English. However, in a subsequent experiment, de Jong et al. (Reference de Jong, Beckman and Edwards1993) found that the results were more consistent with hyperarticulation, because accented [ʊ] differed from unaccented [ʊ] mostly in terms of tongue retraction rather than lowering. They therefore argue for hyperarticulation as a more suitable explanation for the English data in both experiments. However, the acoustic data from Tongan presented here are only consistent with sonority expansion, because F1 raises under stress even for non-low vowels. Further research could verify whether the increase in F1 under stress is due to jaw lowering or some other articulatory mechanism.
4.1.1 Considering an alternate explanation: Effects of consonant closure on F1
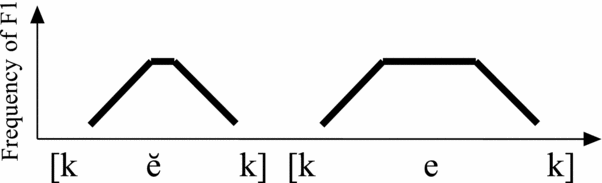
We briefly consider one alternate explanation for the lower F1 found for unstressed vowels, namely that consonant closures surrounding a vowel lower the vowel's F1 during the transitions between consonant and vowel (see Johnson Reference Johnson2003: 144). Even though our stressed and unstressed vowels have the same set of consonants surrounding them, the unstressed vowels have shorter durations. This means that the surrounding consonants could affect a greater proportion of the unstressed vowels compared to the vowels with primary stress, resulting in lower mean F1 for the unstressed vowels overall. This alternative hypothesis – which we ultimately refute – is illustrated in Figure 8. Assuming that F1 transitions are fixed in their duration, a shorter vowel would have an overall lower mean F1 than a longer vowel (even if the F1 target were held constant). This is due to the fact that F1 values are averaged across the entire duration of the vowel, but the target (represented in Figure 8 by the F1 plateau) is held for a shorter duration in the shorter vowel.
Schematic of possible F1 effect as a function of adjacent consonant [k] and vowel duration [e]. The F1 contours during vowels of differing lengths are schematized in terms of frequency (on y-axis) and duration of vowel (on x-axis). This hypothetical effect is not found in the current study; duration does not influence F1 independently of stress.

To evaluate this possibility, we took a subset for each of the five vowels in which vowels with primary stress and unstressed vowels had an equal mean and standard deviation for duration (on average 54 tokens, half stressed and half unstressed, were included for each vowel).
If the lower F1 for unstressed vowels were due only to the surrounding consonant closures, it would not occur for tokens with equal duration. But if the stress itself has some effect on F1, then the difference should remain when duration is controlled. Re-fitting the models to just the subsets with an equal mean duration, the difference in F1 remains significant for all vowels except /a/. Thus we conclude that for all vowels except /a/, primary stress results in a higher F1, independent of any effect of duration or the surrounding consonants. Thus, a scenario like the kind represented in Figure 8 does not account for the lower F1 of unstressed vowels in Tongan. These results also provide further support for the conclusion that phonetic undershoot, which depends on the difference in duration between stressed and unstressed vowels, cannot solely explain the lowered F1 for unstressed vowels in Tongan.Footnote 7
4.1.2 Motivation for the shifted vowel space in Tongan
One possible motivation for the shifted vowel space is perceptual clarity: enhancing the contrast between stressed and unstressed vowels without sacrificing the vowel quality contrast. Vowel reduction of the type found in English is effective at making stressed vowels very distinct from unstressed vowels, but the distinction between many vowel qualities is lost in unstressed vowels. This reduction strategy, however, would be counterproductive in a language with few distinctive phonemes and relatively simple syllable structure such as Tongan. In such languages, distinctions between different vowel qualities are highly informative even for unstressed vowels because losing those contrasts would result in many merged words. At the same time, stress plays an important role in morphological processes in Tongan, such as the definitive accent (see Anderson & Otsuka Reference Anderson and Otsuka2006). Thus, enhancing the contrast between stressed and unstressed vowels via slightly modified F1 values, without threatening the contrast between vowel qualities, could be perceptually beneficial. It is important to recall that F1 is not the sole acoustic measure correlated with stress in Tongan; it is therefore unclear whether listeners focus on any single measure as a cue to stress, rather than relying on the integration of several acoustic cues.
Given that the shift in the vowel space under stress cannot be accounted for by phonetic undershoot, our interpretation also implies that the shift in the vowel space has been phonologized. In other words, the sonority expansion strategy is part of the phonological system that Tongan speakers use to cue differences in stress. As a result, we predict that Tongan speakers should be able to use F1 as a cue to stress in a perceptual task with other measures held constant. We leave this prediction for future work. We conclude by noting that Tongan is unlikely to be unique in exhibiting the shifted system of unstressed vowels. As such, these findings underscore the need to examine a wider selection of languages to increase our understanding of how stress may affect the vowel space.
4.2 Voice quality and stress
The voice quality results show that H1*-H2* and CPP are generally higher for vowels with primary stress than for unstressed vowels. Higher H1*-H2* values are associated with less creakiness and/or breathier voice quality, whereas higher CPP values indicate a more modal, more periodic vowel. Thus, when taken together, the two measures indicate that primary stressed vowels in Tongan are more modal than unstressed vowels. Because unstressed vowels have lower H1*-H2* and CPP values, they are assumed to be creakier or less periodic than vowels with primary stress. The aperiodicity in creaky phonation is likely to lower both H1*-H2* and CPP, as seen in other languages like Mazatec, Zapotec, and Yi (Garellek & Keating Reference Garellek and Keating2011, Keating et al. Reference Keating, Esposito, Garellek, Khan and Kuang2011). Thus, the inclusion of CPP in this study is important, in that it helps clarify the H1*-H2* results.
Our results also indicate that voice quality and stress in Tongan interact similarly to what has been shown in other languages. Campbell & Beckman (Reference Campbell, Beckman, Botnis, Kouroupetroglou and Carayannis1997) found similar spectral changes in English vowels. They calculated H1-H2 (in their study, H2-H1, uncorrected for vowel formants), and three of the four speakers showed lower values of H2-H1 (thus, higher H1-H2) for accented vowels compared to stressed or unstressed ones. The results in Campbell & Beckman (Reference Campbell, Beckman, Botnis, Kouroupetroglou and Carayannis1997) are consistent with ours, because vowels with primary stress (which also bore accent in our study) showed higher values of H1*-H2*. Therefore, our study provides further evidence that stress affects voice quality. The results also show that both harmonic and inharmonic (noise) measures should be used to analyze voice quality (Simpson Reference Simpson2012), and that closer examination of these effects on various components of the spectrum is warranted.
We hypothesize that the higher values of H1*-H2* under stress could serve as a cue to listeners: Higher H1*-H2* values mean that the first harmonic is louder under primary stress relative to the second harmonic. A louder H1 accompanied by greater periodicity would result in a louder and clearer f0 (the frequency of H1) during stress. If stress in Tongan is primarily cued by f0, and if stress plays an important role in the language (as we claim), then it is reasonable to assume that the relative loudness of the fundamental frequency would be perceptually useful for Tongan listeners. Studies of other languages have illustrated that listeners may be highly sensitive to voice quality measures like H1-H2 (or H1*-H2*) – especially when voice quality is contrastive (as in Hmong; Garellek et al. Reference Garellek, Keating, Esposito and Kreiman2013), but even when voice quality accompanies other linguistic features like lexical tone (Kreiman & Gerratt Reference Kreiman and Gerratt2010, Kreiman, Gerratt & Khan Reference Kreiman, Gerratt and Khan2010). It is thus possible that Tongan listeners would be sensitive to changes in voice quality as a function of lexical stress.
4.3 Pitch accent vs. word stress
It is possible that the findings of this study are associated with pitch-accented vowels (i.e. phrasal prominence) rather than stress (lexical prominence). As mentioned earlier, we believe that for primary stress, it is effectively impossible to disambiguate between these two levels of prominence in our case. In Tongan, each content word typically forms its own accentual phrase, thereby necessarily bearing a pitch accent (Kuo & Vicenik Reference Kuo and Vicenik2012). Moreover, since focus in Tongan is expressed primarily through syntactic means with no overt prosodic changes (Kuo & Vicenik Reference Kuo and Vicenik2012), we were unable to elicit unaccented content words through post-focal de-accenting. Although this is a limitation in the current study, we expect that the same problem would arise in phonetic studies of stress in other languages that have both lexical stress and obligatory accentual phrase pitch accents, e.g. Farsi (Jun Reference Jun and Sun-Ah2005, Scarborough Reference Scarborough2007). It should also be noted that even though vowels with primary stress in this study always bore a pitch accent, vowels with secondary stress did not. Thus, we can conclude that the higher f0 that is characteristic of vowels with secondary stress is due to lexical stress rather than the presence of a pitch accent. Because secondary stress clearly has an effect on f0, it is likely that part of the difference in f0 (and possibly other measures) seen for primary stress is also due to lexical stress itself and not only to phrasal accent. Future research on the intonation of Tongan may help determine how lexical stress and phrasal accent may be disentangled in the language.
5 Conclusions
The primary goal of this paper was to determine which acoustic measures correlate with both primary and secondary stress in Tongan. The results indicate that vowels with primary stress are marked by higher f0, higher F1, longer duration, higher energy, and more regular voice quality relative to vowels without stress. Vowels with secondary stress are marked by higher f0 and energy, as well as shorter duration. We found a lowering of F1 for all unstressed vowels, including high vowels. This shift in the vowel space with no corresponding change in its overall size is inconsistent with an explanation based on phonetic undershoot alone, but is consistent with the interpretation that stressed vowels are lowered to enhance sonority (i.e. sonority expansion).
In addition to its implications for our understanding of how stress is realized cross-linguistically, this work provides a foundation for future work on phonological phenomena in Tongan that involve stress. Specifically, the measures that statistically correlate with stress could be used in studies investigating how speakers of Tongan use and perceive the ‘definitive accent’ (Anderson & Otsuka Reference Anderson and Otsuka2006). They could also serve as a tool in studies aimed at settling the ongoing dispute over the phonological structure of vowel–vowel sequences in Tongan (see Churchward Reference Churchward1953, Feldman Reference Feldman1978, Poser Reference Poser, Goldberg, MacKaye and Wescoat1985, Schütz Reference Schütz2001, Taumoefolau Reference Taumoefolau2002, Garellek & White Reference Garellek and White2010).
Appendix. Words elicited in the experiment written in IPA
The stressed and unstressed vowels that were compared in the experiment are underlined.

Acknowledgements
We are grateful for the helpful comments from three reviewers and Adrian Simpson as well as the editorial assistance of Ewa Jaworska. We also thank Pat Keating, Kie Zuraw, Hilda Koopman, and the members of the UCLA Phonetics Lab for helpful discussion. An earlier version of this work was presented at the 161st Meeting of the Acoustical Society of America and the 18th Meeting of the Austronesian Formal Linguistics Association.