Introduction
Wheat (Triticum aestivum L.) powdery mildew is a severe fungal disease caused by Blumeria graminis f. sp. tritici (Bgt). This fungus parasitizes on the surface of stems and leaves. Its mycelium can act as an additional sink to compete with the host's grain, causing changes in grain protein content (GPC) (Gao et al., Reference Gao, He, Niu, Wang and Yang2014a). Previous studies on leaves showed that powdery mildew could change the invertase activity of leaves, thus affecting the formation of photosynthetic assimilates (Sutton et al., Reference Sutton, Gilbert, Williams and Hall2007). The research on metabolic enzymes in grains is less, especially the research on enzymes related to nitrogen (N) metabolism (Li et al., Reference Li, Li, Guan and Tian2012, Reference Li, Yang, Li, Niu and He2017). Glutamine synthetase (GS; EC 6.3.1.2) and glutamate synthase (GOGAT) are two important enzymes in N metabolism (Zhang et al., Reference Zhang, Khan, Sun, Gao, Liang, Yang, Zhang and Li2018), which are essential for the formation and accumulation of wheat grain protein. The function of GS is to catalyse the ATP-dependent condensation of NH3 with glutamate (Glu) to produce glutamine (Gln) (Obara et al., Reference Obara, Kajiura, Fukuta, Yano, Hayashi, Yamaya and Sato2001), with two major isomeric forms, GS1 and GS2 (Bernard et al., Reference Bernard, Møller, Dionisio, Kichey, Jahn, Dubois, Baudo, Lopes, Tercé-Laforgue, Foyer, Parry, Forde, Araus, Hirel, Schjoerring and Habash2008; Li et al., Reference Li, Zhao, He, Zhao, Li, Liu, Zhang, Zhang, Tong and Li2011). GS1 has the function of N assimilation (Masclaux et al., Reference Masclaux, Valadier, Brugière, Morot-Gaudry and Hirel2000; Habash et al., Reference Habash, Massiah, Rong, Wallsgrove and Leigh2001; Gadaleta et al., Reference Gadaleta, Nigro, Giancaspro and Blanco2011, Reference Gadaleta, Nigro, Marcotuli, Giancaspro, Giove and Blanco2014; Goodall et al., Reference Goodall, Kumar and Tobin2013; Thomsen et al., Reference Thomsen, Eriksson, Møller and Schjoerring2014). GS2 can maintain the balance of N and carbon (C) metabolism in wheat (Németh et al., Reference Németh, Nagy and Pécsváradi2018). The function of GOGAT is to catalyse the transfer of the amide group of Gln to 2-oxoglutarate, produces two molecules of Glu (Nigro et al., Reference Nigro, Blanco, Anderson and Gadaleta2014). There are two forms of GOGAT; one is NADH-dependent (NADH-GOGAT; EC 1.4.1.14) and the other is ferredoxin-dependent (Fd-GOGAT; EC 1.4.7.1). Of the two different forms, NADH-GOGAT is located primarily in plastids of non-photosynthetic organs, while Fd-GOGAT is located primarily in the chloroplasts of photosynthetic organs (Yamaya et al., Reference Yamaya, Hayakawa, Tanasawa, Kamachi, Mae and Ojima1992; Lam et al., Reference Lam, Coschigano, Oliveira, Melo-Oliveira and Coruzzi1996; Nigro et al., Reference Nigro, Blanco, Anderson and Gadaleta2014). Studies have shown that the expression and activity of NADH-GOGAT contribute significantly to GPC (Nigro et al., Reference Nigro, Fortunato, Giove, Mangini, Yacoubi, Simeone, Blanco and Gadaleta2017; Imagawa et al., Reference Imagawa, Minagawa, Nakayama, Kanno, Hayakawa and Kojima2018). The expressions and activities of GS and GOGAT closely related to GPC under N and sulphur (S) fertilizer treatments (Kaur et al., Reference Kaur, Asthir and Bains2017; Zhang et al., Reference Zhang, Ma, Ma, Wang, Xie and Kang2017; Tao et al., Reference Tao, Chang, Wang, Wang, Ma, Yang and Zhao2018). Similar results were obtained in the study of GS transgenic wheat, as well as GS and GOGAT mutants of durum wheat (Nigro et al., Reference Nigro, Fortunato, Giove, Paradiso, Gu, Blanco, de Pinto and Gadaleta2016, Reference Nigro, Fortunato, Giove, Mangini, Yacoubi, Simeone, Blanco and Gadaleta2017; Hu et al., Reference Hu, Zhao, Liu, Hong, Zhang, Zhang, Sun, Li and Tong2018).
The expressions and activities of GS and NADH-GOGAT are significantly regulated by environmental factors, such as N fertilizer level, S fertilizer level and high temperature (Shi et al., Reference Shi, Xu, Li, Zhao and Dong2010; Kaur et al., Reference Kaur, Asthir and Bains2017; Zhang et al., Reference Zhang, Ma, Ma, Wang, Xie and Kang2017; Tao et al., Reference Tao, Chang, Wang, Wang, Ma, Yang and Zhao2018). The expressions of GS1 and GS2 are induced by biotic stress (Pérez-García et al., Reference Pérez-García, Pereira, Pissarra, Gutiérrez, Cazorla, Salema and Cánovas1998; Pageau et al., Reference Pageau, Reisdorf-Cren, Morot-Gaudry and Masclaux-Daubresse2006; Tavernier et al., Reference Tavernier, Cadiou, Pageau, Lauge, Reisdorf-Cren, Langin and Masclaux-Daubresse2007; Bernard and Habash, Reference Bernard and Habash2009). Proteomic data showed that GS2 expression in leaves was up-regulated after Bgt inoculation (Li et al., Reference Li, Li, Guan and Tian2012). Another study found out that Bgt infection of the susceptible cultivar resulted in reduced expression of GS1 in grains (Li et al., Reference Li, Yang, Li, Niu and He2017). As a biotic stress, powdery mildew may cause the activity changes of GS and GOGAT. It may also result in different expression patterns of GS isozyme genes. There have been only proteomics studies (Li et al., Reference Li, Li, Guan and Tian2012, Reference Li, Yang, Li, Niu and He2017), but systematical studies on the activity and expression changes of GS and GOGAT under powdery mildew were not found. Therefore, the effects of Bgt infection on the activities of GS and GOGAT in grains, and the expression of GS genes (GS1 and GS2) were analysed in the current work. At the same time, since the main form of N transport from leaves to grains is Gln, GS activity in flag leaves plays a key role in grain protein synthesis (Habash et al., Reference Habash, Bernard, Schondelmaier, Weyen and Quarrie2007). Therefore, GS activity in flag leaves was also analysed, combined with the different analyses of disease index (DI), GPC and yield, to reveal the effect of wheat powdery mildew on grain N metabolism.
Materials and methods
Materials
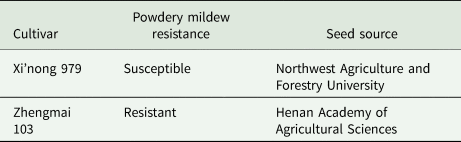
The following two winter wheat cultivars were used as plant materials (Table 1). The cultivars were tested and evaluated by field inoculation with Bgt isolate E20. Xi'nong 979 (susceptible) and Zhengmai 103 (resistant) were sown in 2016/17 and 2018/19 wheat growing seasons (hereafter signed as 2017 and 2019).
Description of the winter wheat cultivars used in the study

Experiment design and field management
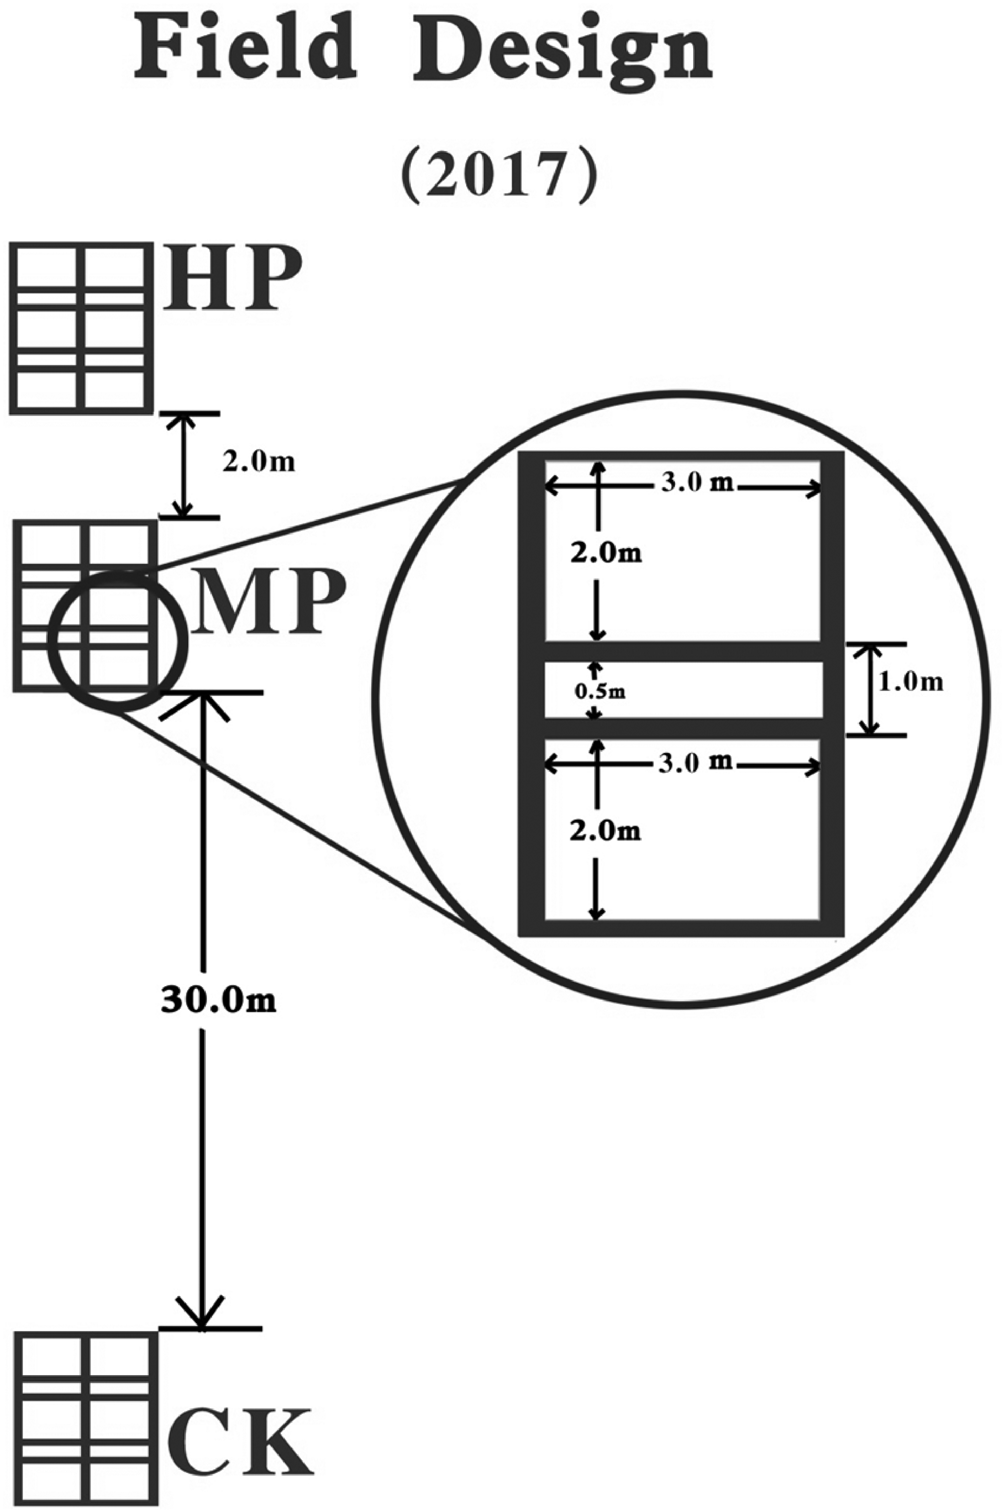
The field trial was carried out at the experimental field of Zhengzhou Normal University (34°54'N, 113°37'E, 89 m a.s.l.) in both growing seasons. The field treatment was in a split-plot design with three replications referred to Gao et al. (Reference Gao, He, Niu, Wang and Yang2014a) with a few changes. The main treatments were inoculated with different amounts of Bgt race E20, which was respectively marked as CK, MP and HP (Fig. 1), with CK being the un-inoculated control. On the 197th day after sowing (GS43) (Zadoks et al., Reference Zadoks, Chang and Konzak1974), pots prepared with infected seedlings were placed in the experimental plot (1 pot per plot) of HP treatment to initiate disease development. At the same time, numerous infected wheat leaves were scattered in the experimental area. Then more infected leaves were scattered every 2 days, and this practice was repeated a total of nine times. By increasing the frequency of inoculation and the amount of Bgt, Xi'nong 979 (the susceptible cultivar) in HP was controlled to be highly infected. The MP treatment was inoculated once on the 213th day (GS71) by scattering several infected wheat leaves in the experimental area, to control Xi'nong 979 to be moderately infected. The sub-plot had two wheat cultivars, planted in an area of 2 × 3 m, and 1 m apart. In MP and HP, ‘inducing’ lines of the susceptible cultivar (which can supply spores continuously when infected by Bgt) were planted in the 1 m gap with a width of 0.5 m, so as to fully induce the disease. In CK, separation lines with a width of 0.5 m of the resistant cultivar were planted to prevent the spread of spores. For the main treatments, blocks were arranged in the order CK, MP and HP, from south to north. The CK and MP treatments were 30 m apart while MP and HP were 2 m apart. The resistant cultivar was grown as separation lines between CK and MP, and between MP and HP. In addition, a four-layer cotton-cloth-wrapped fence with 1.4 m high was set up around each main treatment as separation screen. Between MP and CK, there were other wheat germplasm materials with high stalk and disease resistance planted. Thus, through the above spatial isolation, combined with differences in the frequency of inoculation and the amount of Bgt, the difference of powdery mildew severity of Xi'nong 979 among three treatments was controlled to reach a significant level, forming a gradient of severe (HP), moderate (MP) and mild powdery mildew (CK). The previous crop in both seasons was soybean. Seeds were sown on 15 October following soybean harvest and the planting density was 240 seeds/m2. Fertilizer was applied at the rate of 225 kg N/ha, 100.4 kg P2O5/ha and 112.5 kg K2O/ha. The N fertilizer was applied at two stages: 50% prior to planting and 50% as top-dressing at the elongation stage (GS 31). Flood irrigation was performed at booting stages (GS 43). Weeds were controlled by hand weeding and no fungicides were used. The pesticide Bichonlin (Imidacloprid) was used as necessary to minimize the effects of aphids.
Field design showing the arrangement of main treatments no inoculation (CK), one inoculation (MP) and nine inoculations of Bgt (HP).

Assessment and control of powdery mildew severity in the field
From the 210th day after sowing, 7 days after anthesis (DAA), the severity of the disease was assessed every 7 days for a total of four times. Thirty plants were chosen randomly by a five-point sampling method of each treatment combination. A modified 0–9 scale method (0 = no infection and 9 = severe infection) was adopted for the assessment (Gao et al., Reference Gao, He, Niu, Wang and Yang2014a). The DI can be expressed by the formula:

where n0, n1……n9 are numbers of the leaves with disease severity as 0, 1…9, respectively.
Sampling methods
During the flowering period, representative and similar-sized wheat spikes that started to flower on the same day were marked. From the 213th day (10 DAA), grains and flag leaves of control and infected wheat with the same DI were collected from each plot. Subsequently, samples were taken every 5 days for a total of five times. These samples were quickly frozen in liquid N and then preserved at −80°C. At maturity, all crops were harvested by hand and the total yield (T/ha) was calculated.
GS expression analysis by quantitative real-time RT-PCR analysis
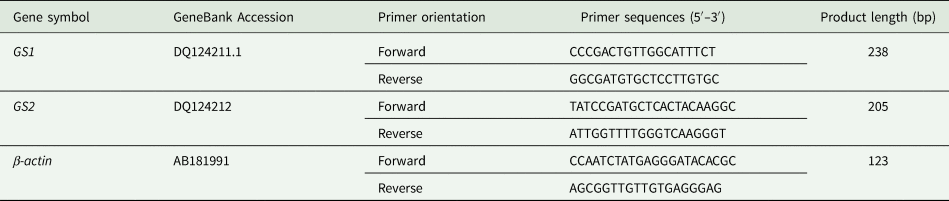
Three to five grains were used to extract RNA with three biological replicates. The total RNA was extracted using TRIZOL reagent and then was reverse-transcripted to cDNA using a PrimeScript RT reagent kit with gDNA Eraser (TaKaRa Biotechnology Co., Ltd, Dalian, China) according to the manufacturer's instructions. Gene-specific primers of GS1 and GS2 genes (Table 2) were designed based on the wheat GS1 (DQ124211.1) and GS2 (DQ124212) using Primer Premier 5.0 software (http://www.premierbiosoft.com/primerdesign/index.html), and NCBI's primer-designing tool (http://www.ncbi.nlm.nih.gov/tools/primer-blast/). The homologous sequences were searched on the website (http://plants.ensembl.org/Triticum_aestivum/Transcript/Sequence_cDNA), and the primers were aligned and screened by Snap Gene (software). Further, the specificity of the primers was checked by the melting curves of the RT-PCR products. Alignment analysis showed that the targeted fragments of GS1 shared 100.00% and 97.48% sequence identity to homoeologous genes from genomes A (Transcript ID: TraesCS6A02G298100.2) and B (Transcript ID: TraesCS6B02G327500.1), respectively. The targeted fragments of GS2 shared 99.51% sequence identity to homoeologous genes from genomes both A (Transcript ID: TraesCS2A02G500400.1) and D (Transcript ID: TraesCS2D02G500600.1). Furthermore, these targeted fragments were located on the conservative segments of two homoeologous genes. Thus, the expression of GS1 gene in the present study was conducted for the two homoeologous genes on chromosomes 6A and 6B, the expression of GS2 gene was conducted for the two homoeologous genes on chromosomes 2A and 2D. Reaction was performed on a Roche Light Cycler*480 Real-Time PCR Detection System (Germany). The expression analysis of the genes was carried out by the method of relative entropy, the data analysis was carried out by the method of 2−ΔΔCt (Livak and Schmittgen, Reference Livak and Schmittgen2001). Gene expression levels were normalized with β-actin gene (AB181991) (Zhang et al., Reference Zhang, Ma, Ma, Wang, Xie and Kang2017).
The DNA sequences of the primers used in real-time PCR

Enzyme activity analysis
According to the method of Cervilla et al. (Reference Cervilla, Blasco, Ríos, Rosales, Rubio-Wilhelmi, Sánchez-Rodríguez, Romero and Ruiz2009), wheat flag leaves or grains (0.5 g) were homogenized at 0–4°C in 5 ml of enzyme active extraction buffer (pH 7.6) containing 100 mm Tris, 1 mm EDTA, 1 mm MgCl2 and 10 mm 2-Mercaptoethanol. The homogenates were centrifuged (12 000 g, 20 min, 4°C). Then the supernatant fraction (crude enzyme extract) was collected, which was used to assay GS and GOGAT activities.
Total GS activity was determined by the hydroxamate synthetase assay, adapted from Cervilla et al. (Reference Cervilla, Blasco, Ríos, Rosales, Rubio-Wilhelmi, Sánchez-Rodríguez, Romero and Ruiz2009). Reactions started with the addition of crude enzyme extract (0.5 ml) to an assay mixture (2.5 ml) composed of 100 mm Tris pH 7.8, 50 mm glutamate, 20 mm ATP, 5 mm Hydroxylamine and 50 mm MgSO4 for the synthetase assay. The reaction proceeded at 30°C for 5 min and stopped with the addition of a solution (1.5 ml) composed of 670 mm FeCl3, 20% (w/v) trichloroacetic acid and 370 mm HCl. Absorbance value (A) was measured at 540 nm using a model UV-T6 new century spectrophotometer (Beijing Purkinje General Instrument Co., Ltd., Beijing, China).
The activity of GOGAT was determined according to Singh and Srivastava's method (Reference Singh and Srivastava1986), the oxidation rate of NADH at 340 nm was determined. The blank control tube contained 0.4 ml of 20 mm L-glutamine, 0.1 ml of 100 mm α-ketoglutarate, 0.1 ml of 10 mm KCl and 2.4 ml of 25 mm Tris-HCl buffer (pH 7.6). A test tube for measuring activity was initially filled with 0.1 ml of 100 mm α-ketoglutarate, 0.1 ml of 10 mm KCl and 2.28 ml of 25 mm Tris-HCl buffer (pH 7.6). After preheating for 3 min in a water bath at 30 °C, 0.02 ml NADH (3 mm), 0.1 ml crude enzyme extract and 0.4 ml L-glutamine (20 mm) were sequentially added to the test tube. The absorbance was measured at 340 nm. Then the reaction solution in the cuvette was poured back to the original tube, and the absorbance at 340 nm was measured 3 min after water bath at 30 °C. The difference between the two absorbance values was calculated for its activity. The active unit of NADH-GOGAT was expressed as the amount of 1 μmol NADH catalysed per hour per g of grain fresh weight at 30 °C.
Total protein determination
The Kjeldahl method was used to determine the grain N content. GPC was calculated by multiplying N content by 5.7.
Statistical methods
All data were subjected to General Linear Model analysis of variance and Pearson correlations using the SPSS 17.0 software (SPSS Institute Inc., Chicago, USA). Duncan's Multiple Range Test was used to compare the differences among means of all treatments. The data presented in tables and figures are means of three biological replications.
Results
Disease assessment
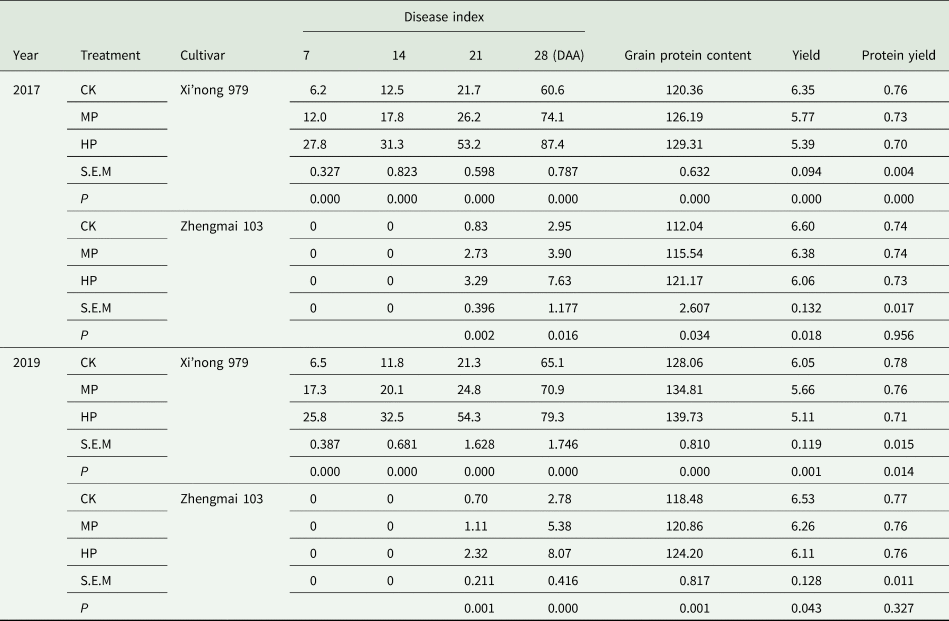
During the 2 years, the DI difference of susceptible cultivar Xi'nong 979 was significant among three different treatments, forming a clear gradient with mild infection of powdery mildew in CK, moderate in MP and high in HP (Table 3). Compared with Xi'nong 979, Zhengmai 103 was highly resistant to powdery mildew. Its symptom emerging time was later and the DI was lower, as well as a slow progression in both years (Table 3).
Variation in disease index, grain protein content (mg/g) and yield (t/ha) under varying degrees of Bgt infection in 2 years

The s.e.m. are presented (n = 3). DAA, days after anthesis.
Effects of wheat powdery mildew on GS expression in grains
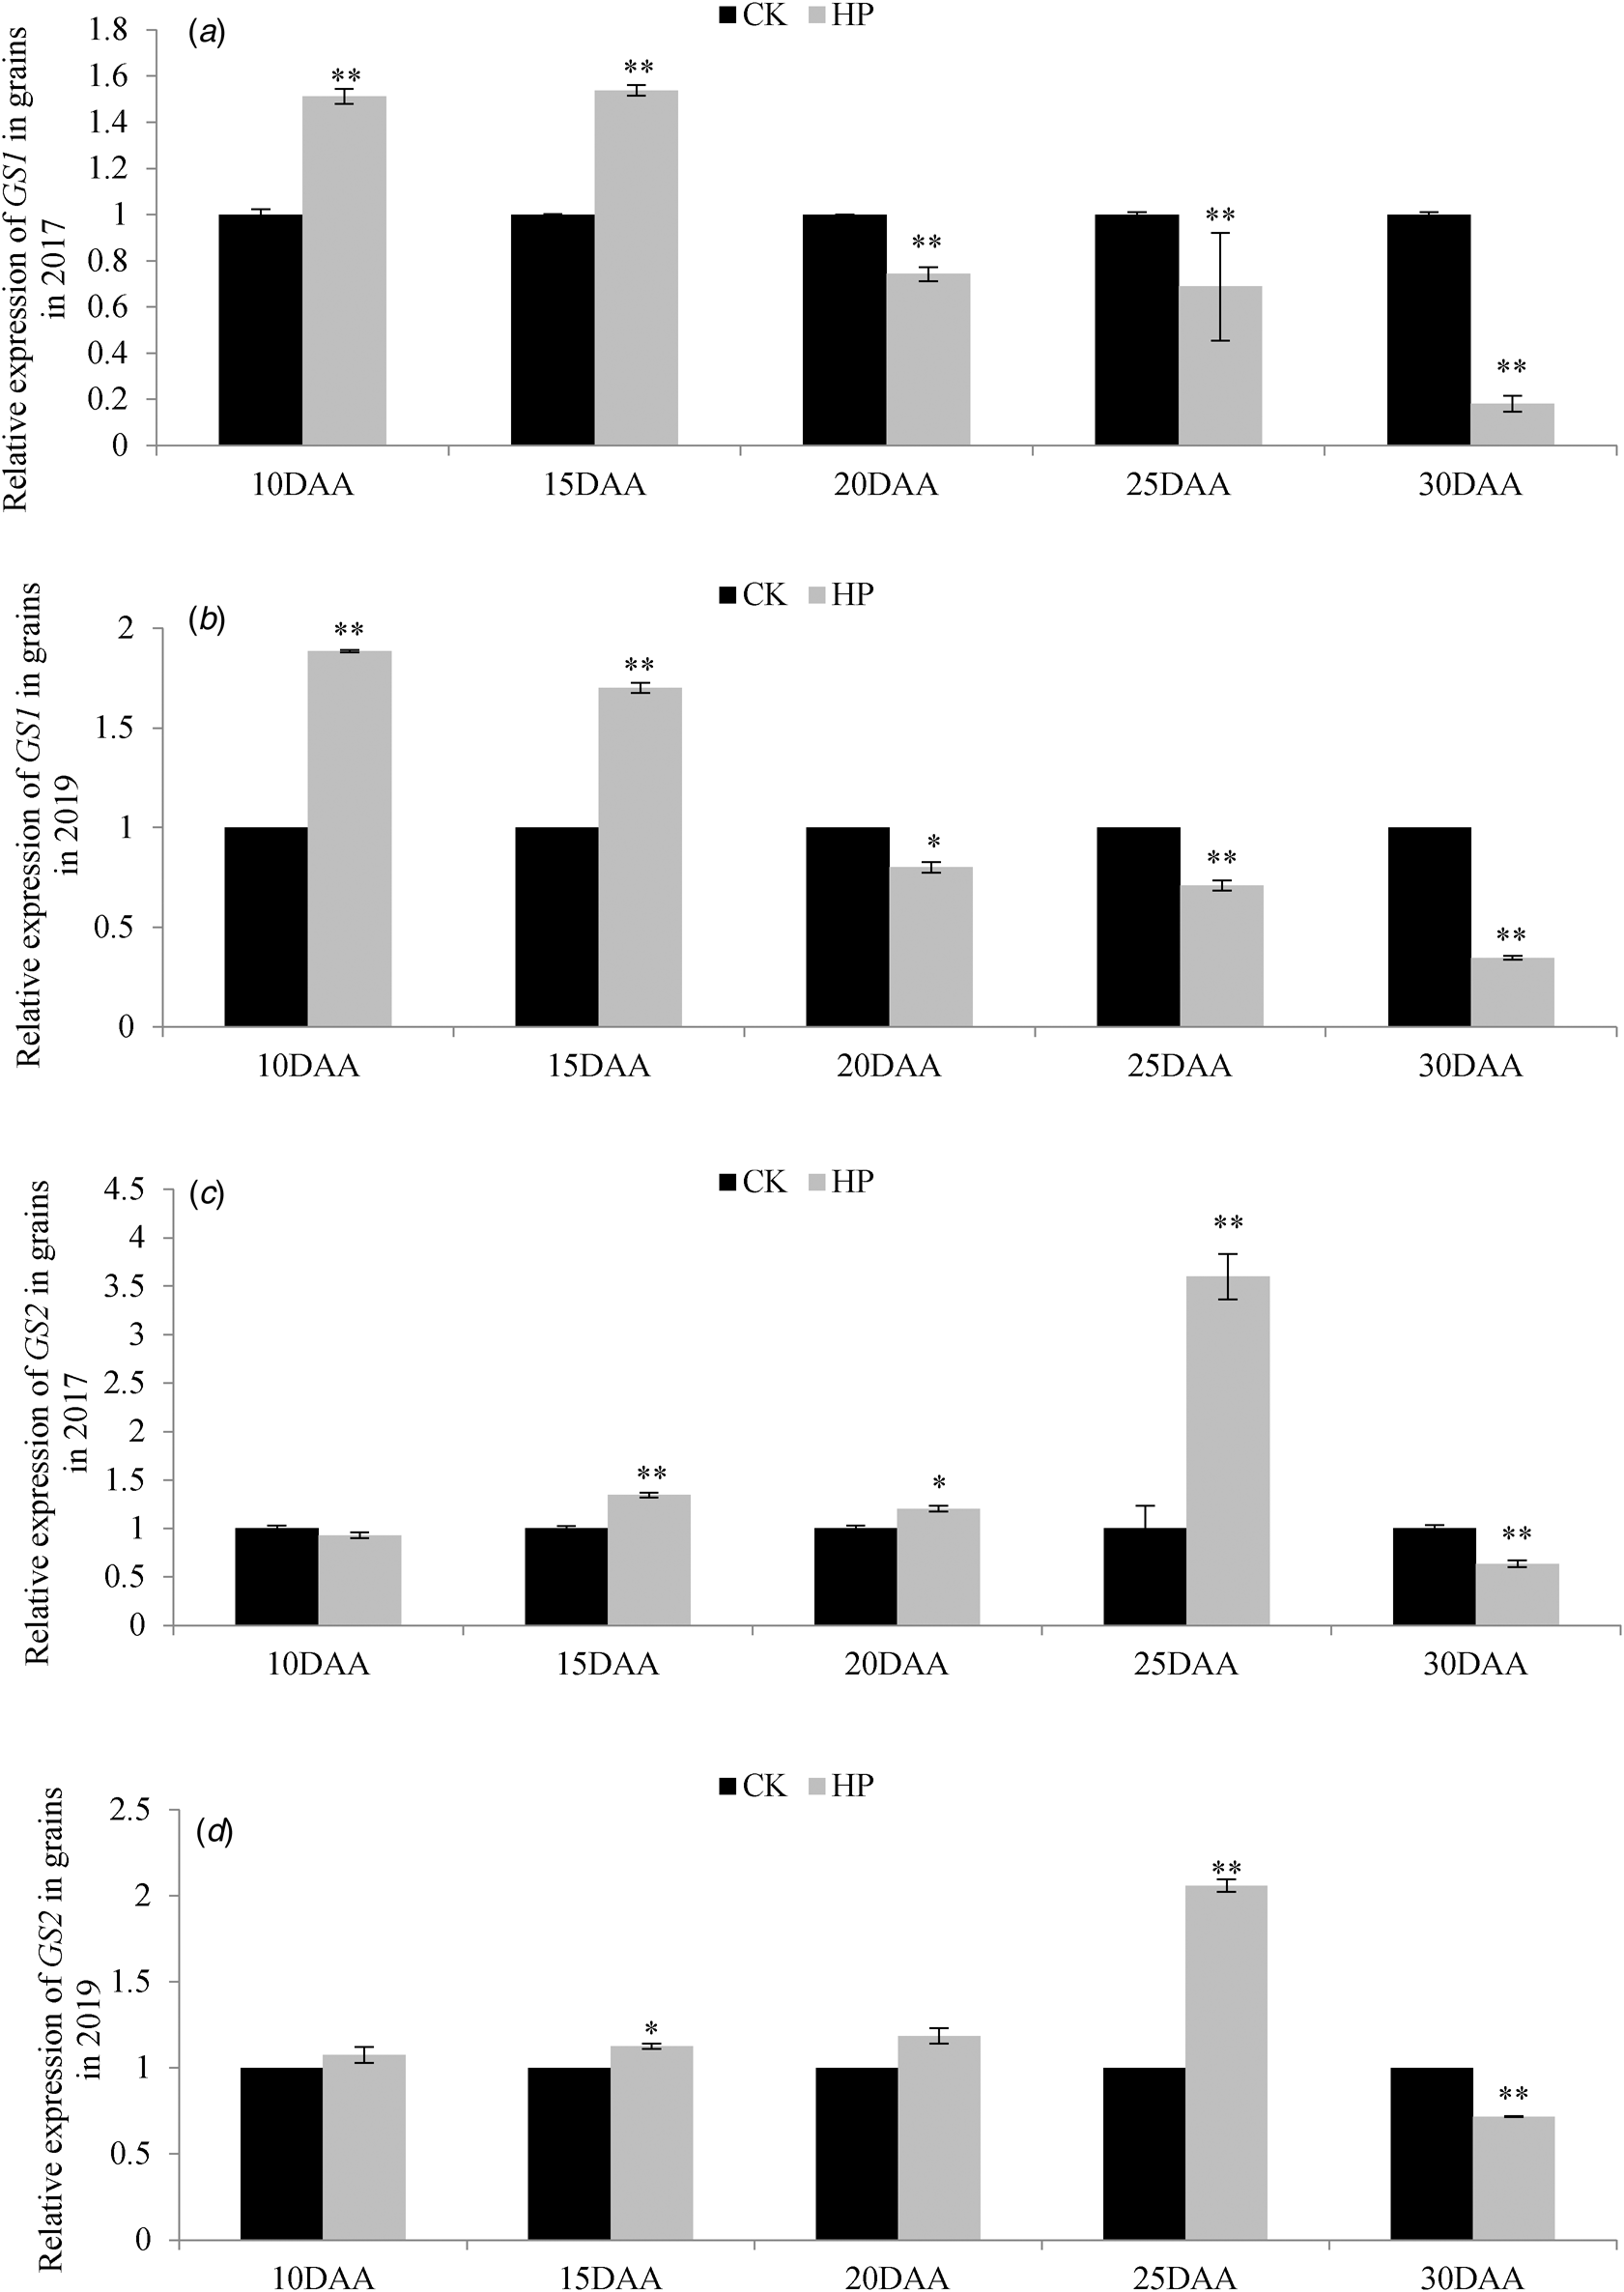
The results showed that GS1 expression in the grain of Zhengmai 103 in HP increased slightly at 10 and 15 DAA, reaching a significant difference (P < 0.01) in 2 years (Figs 2(a) and (b)). GS1 expression decreased from 20 to 30 DAA, and decreased to 18.13% (in 2017) and 34.72% (in 2019) of CK at 30 DAA (P < 0.01). GS2 expression in HP was significantly up-regulated at 25 DAA, which was 3.60 (in 2017) and 2.06 (in 2019) times of CK, while the other four stages had little change, between 0.63 and 1.34 times (Figs 2(c) and (d)).
Relative expressions of GS1 and GS2 in grains of the resistant cultivar Zhengmai 103 under no inoculation (CK) and nine inoculations of Bgt (HP) treatments during the grain filling stage in 2 years. Error bars indicate s.e.m. (n = 3) ‘*’ and ‘**’ indicate a significant level correlation at the 0.05 and 0.01 levels, respectively.

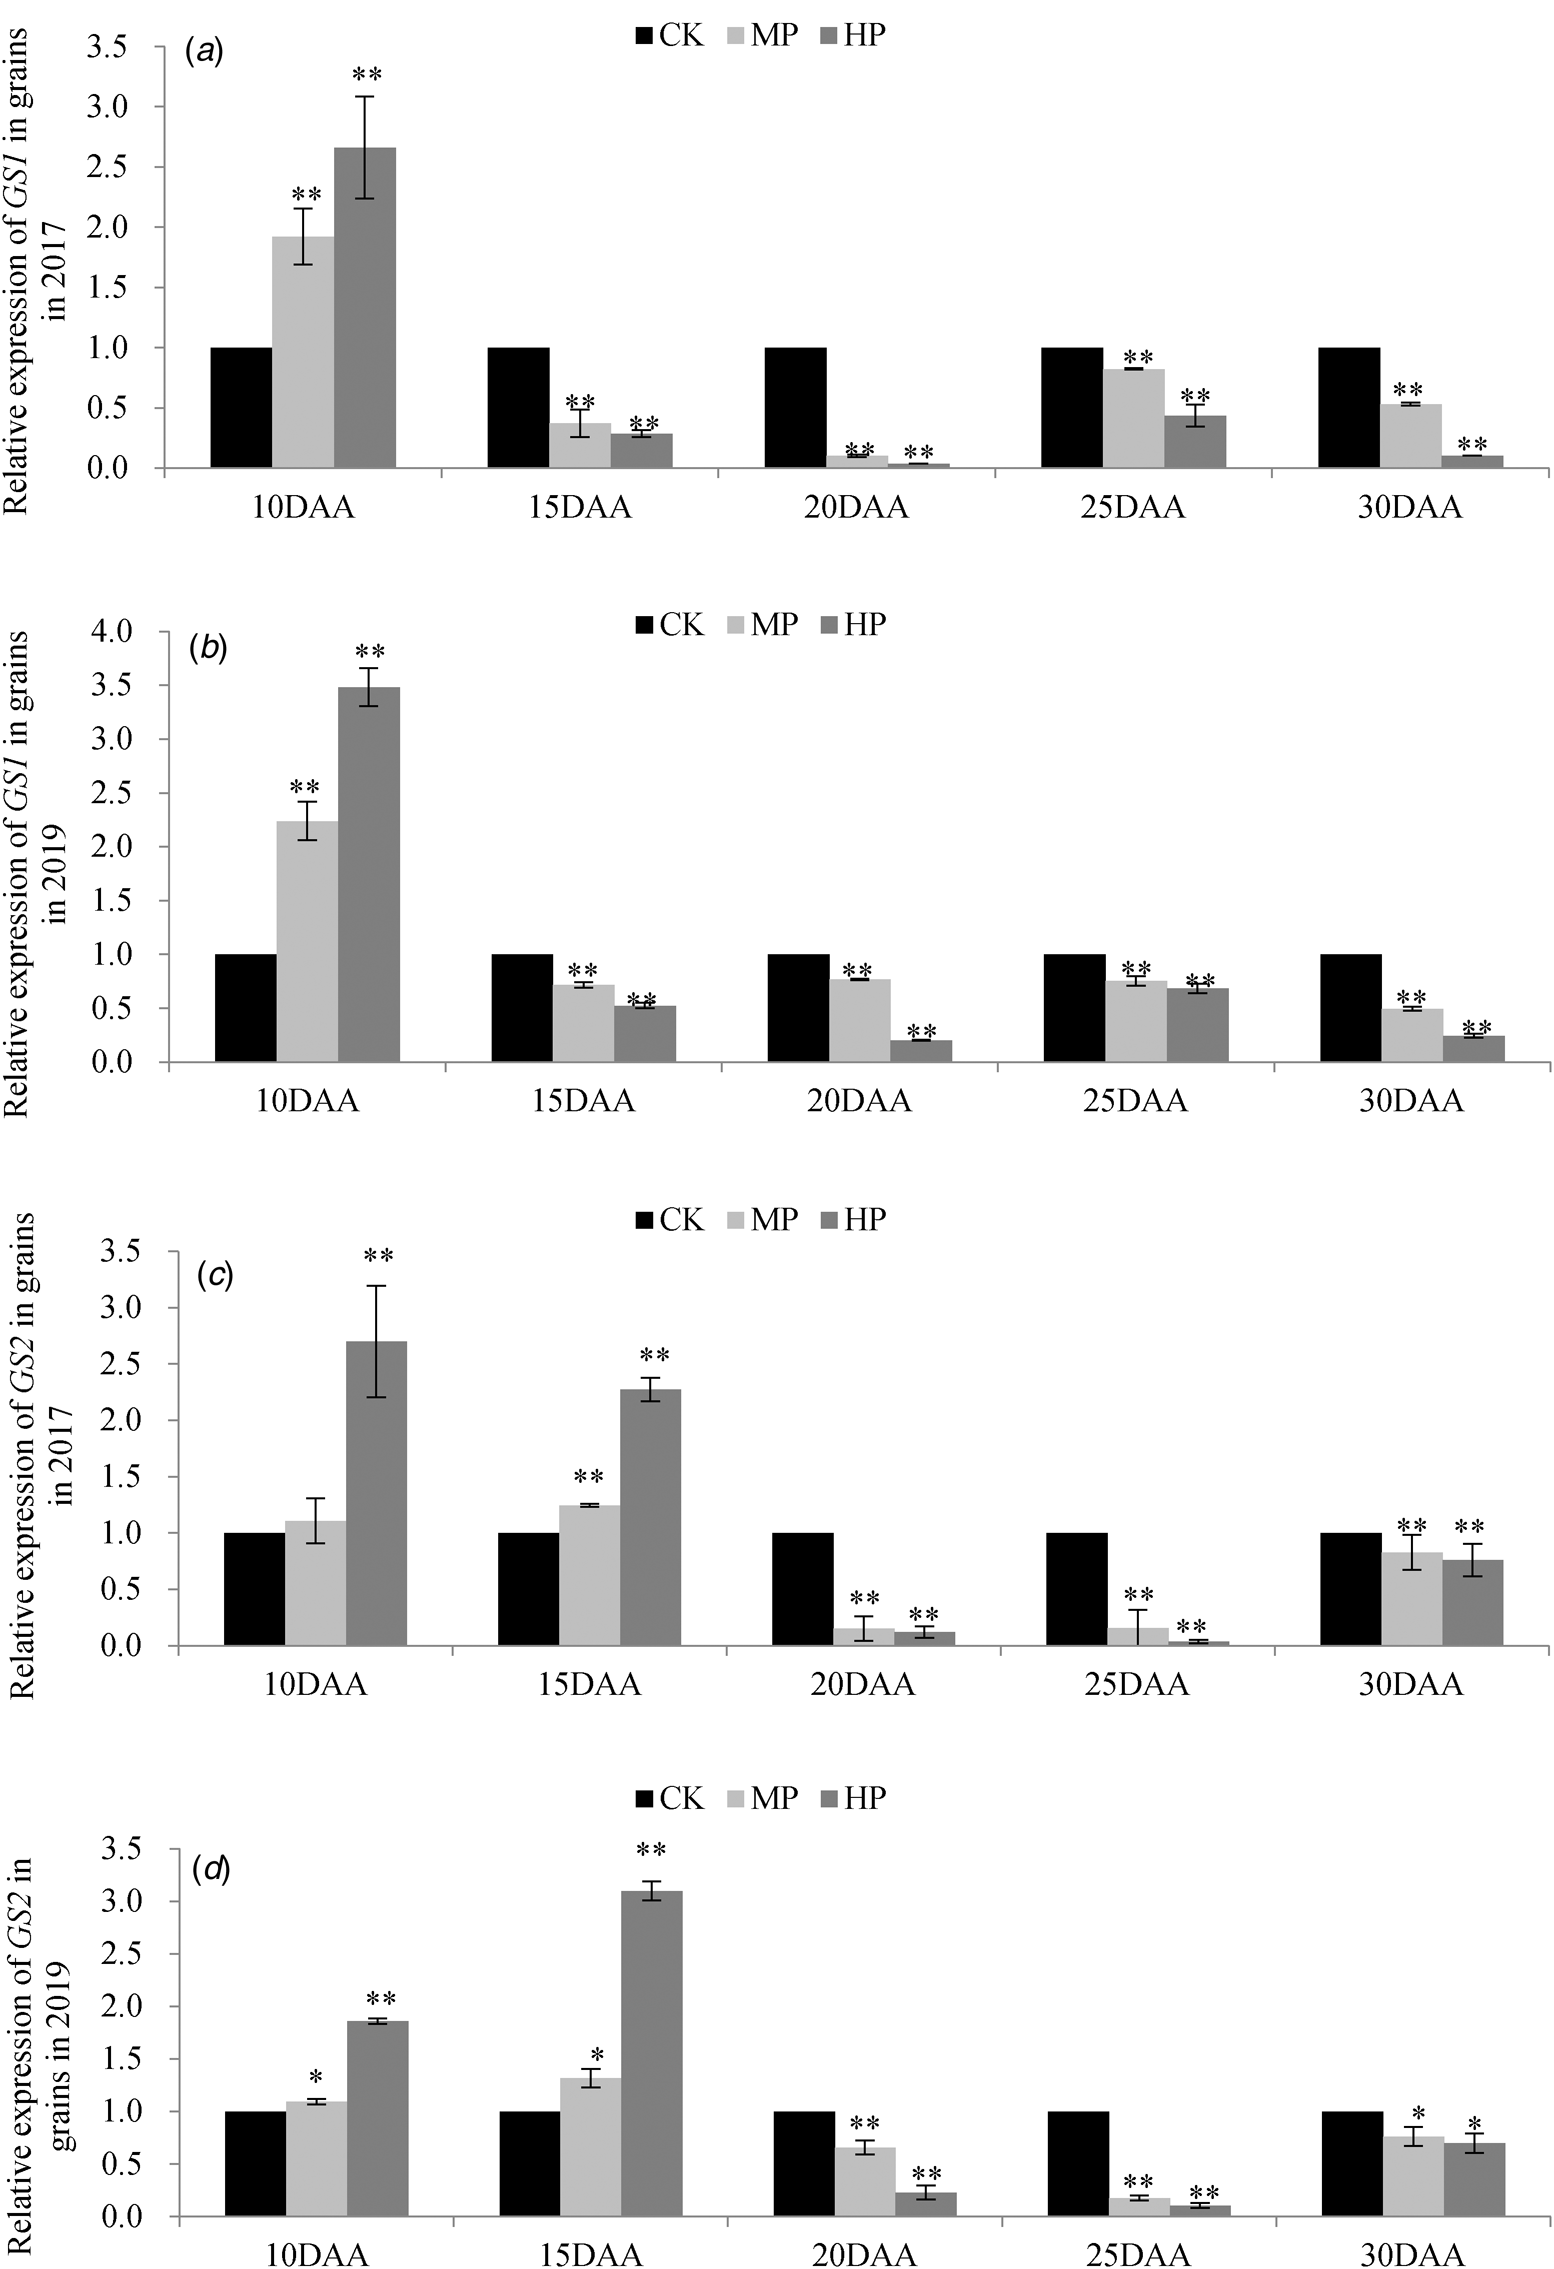
For susceptible cultivar Xi'nong 979, GS1 and GS2 expressions in MP and HP were significantly up-regulated for a short time, and the up-regulation increased with the increase of DI (Fig. 3). In 2017, GS1 expression was up-regulated to 1.92 and 2.66 times, respectively, in MP and HP (Fig. 3(a)). In 2019, GS1 expression at 10 DAA was also up-regulated to 2.24 and 3.48 times in MP and HP, respectively (Fig. 3(b)). GS2 expressions at 10 and 15 DAA in HP were up-regulated significantly in both years (Figs 3(c) and (d)). The expression of GS2 in MP at 10 DAA was not significantly different from that of CK (Fig. 3(c)). Following this transient up-regulation, the expressions of both GS1 and GS2 were down-regulated until 30 DAA. That is to say, the down-regulation of GS1 expression lasted from 15 to 30 DAA, and that of GS2 lasted from 20 to 30 DAA. The results showed that the expressions of GS1 and GS2 were induced by powdery mildew at the early stage of grain development (10 or/and 15 DAA), but inhibited at the middle and late stages (15 or 20–30 DAA). There were two differences. First, the expression of GS1 was induced earlier than that of GS2. At 10 DAA, GS1 expression in Xi'nong 979 was significantly up-regulated, while GS2 expression was only up-regulated in HP. The second difference was that the up-regulation of GS1 expression lasted for a shorter time, which only occurred instantaneously at 10 DAA, while the up-regulation of GS2 expression lasted from 10 to 15 DAA (Fig. 3).
Relative expressions of GS1 and GS2 in grains of the susceptible cultivar Xi'nong 979 under no inoculation (CK), one inoculation (MP) and nine inoculations of Bgt (HP) treatments during the grain filling stage in 2 years. Error bars indicate s.e.m. (n = 3) ‘*’ and ‘**’ indicate a significant level correlation at the 0.05 and 0.01 levels, respectively.

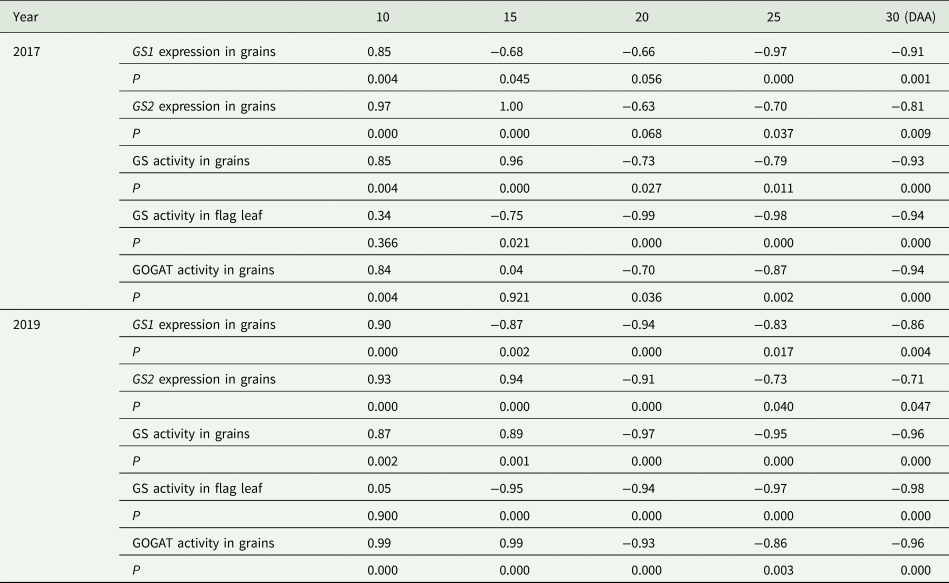
The correlation analysis between the expressions of the two genes and the DI of Xi'nong 979 showed that GS1 expression was positively correlated with DI at 10 DAA (Table 4). The correlation coefficients in 2017 and 2019 were 0.85 and 0.90, respectively. At 10 and 15 DAA, there was a significant positive correlation between GS2 expression and DI. The correlation coefficients at 10 DAA were 0.97 (2017) and 0.93 (2019), respectively, at 15 DAA were 1.00 (2017) and 0.94 (2019), respectively. From 20 (or 25) to 30 DAA, there was a significant negative correlation between GS (GS1 and GS2) expression and DI. The correlation coefficient between GS2 expression and DI was lower than that of GS1.
Correlation between expressions of GS1 and GS2 and disease indices of powdery mildew, and correlation between activities of glutamine synthetase (GS) and NADH-glutamate synthase (GOGAT) and disease indices of powdery mildew in the susceptible cultivar Xi'nong 979 (n = 3) (DAA = days after anthesis)

DAA, days after anthesis.
In conclusion, the expressions of GS1 and GS2 in the susceptible cultivar Xi'nong 979 had a high correlation with powdery mildew DI, showing a significant positive correlation at the early stage of grain development, and a significant negative correlation at the middle and late stages of grain development. These results indicated that the expressions of GS1 and GS2 were induced by powdery mildew at the early stage of grain development, but inhibited at the middle and late stages.
Effects of wheat powdery mildew on GS and GOGAT activities
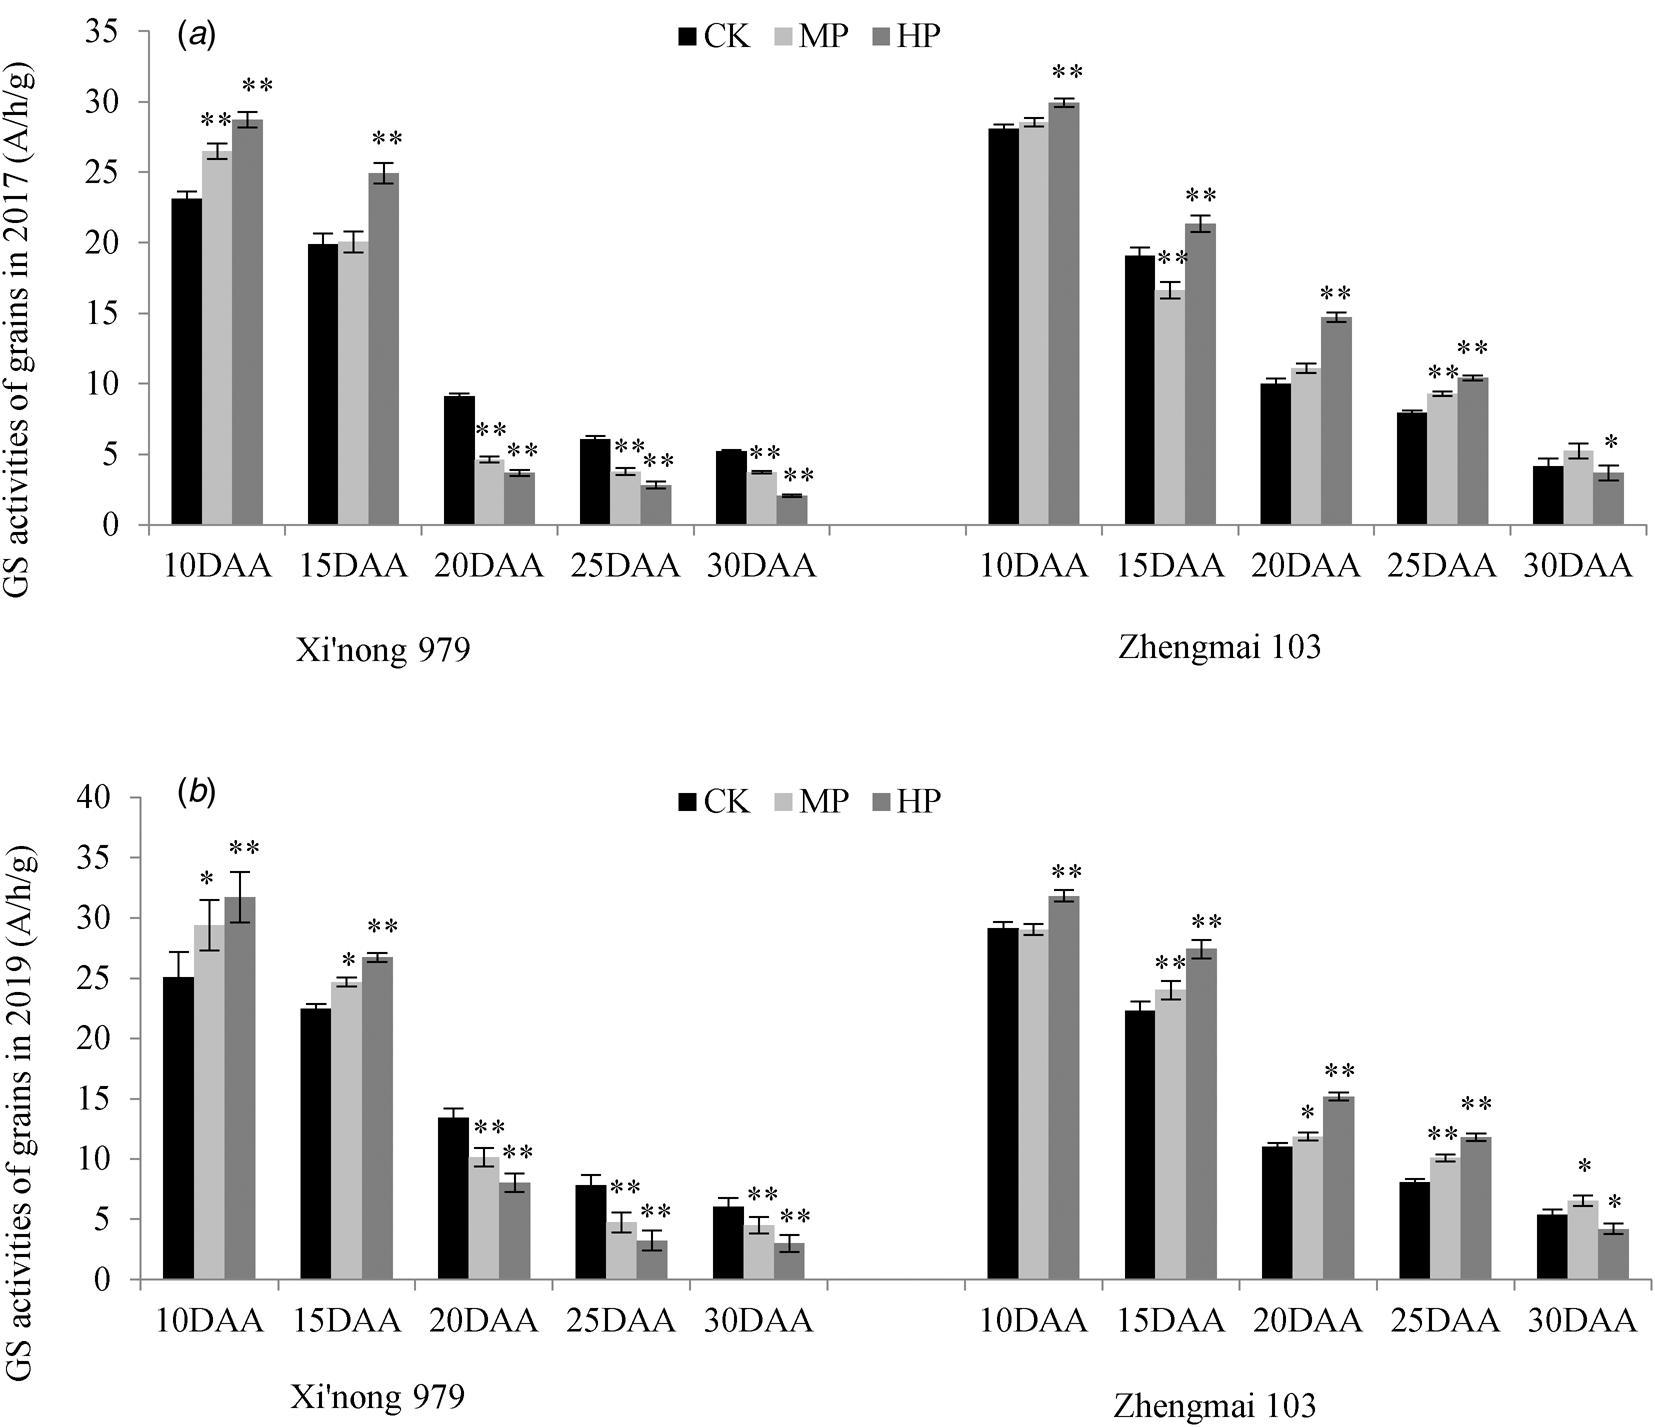
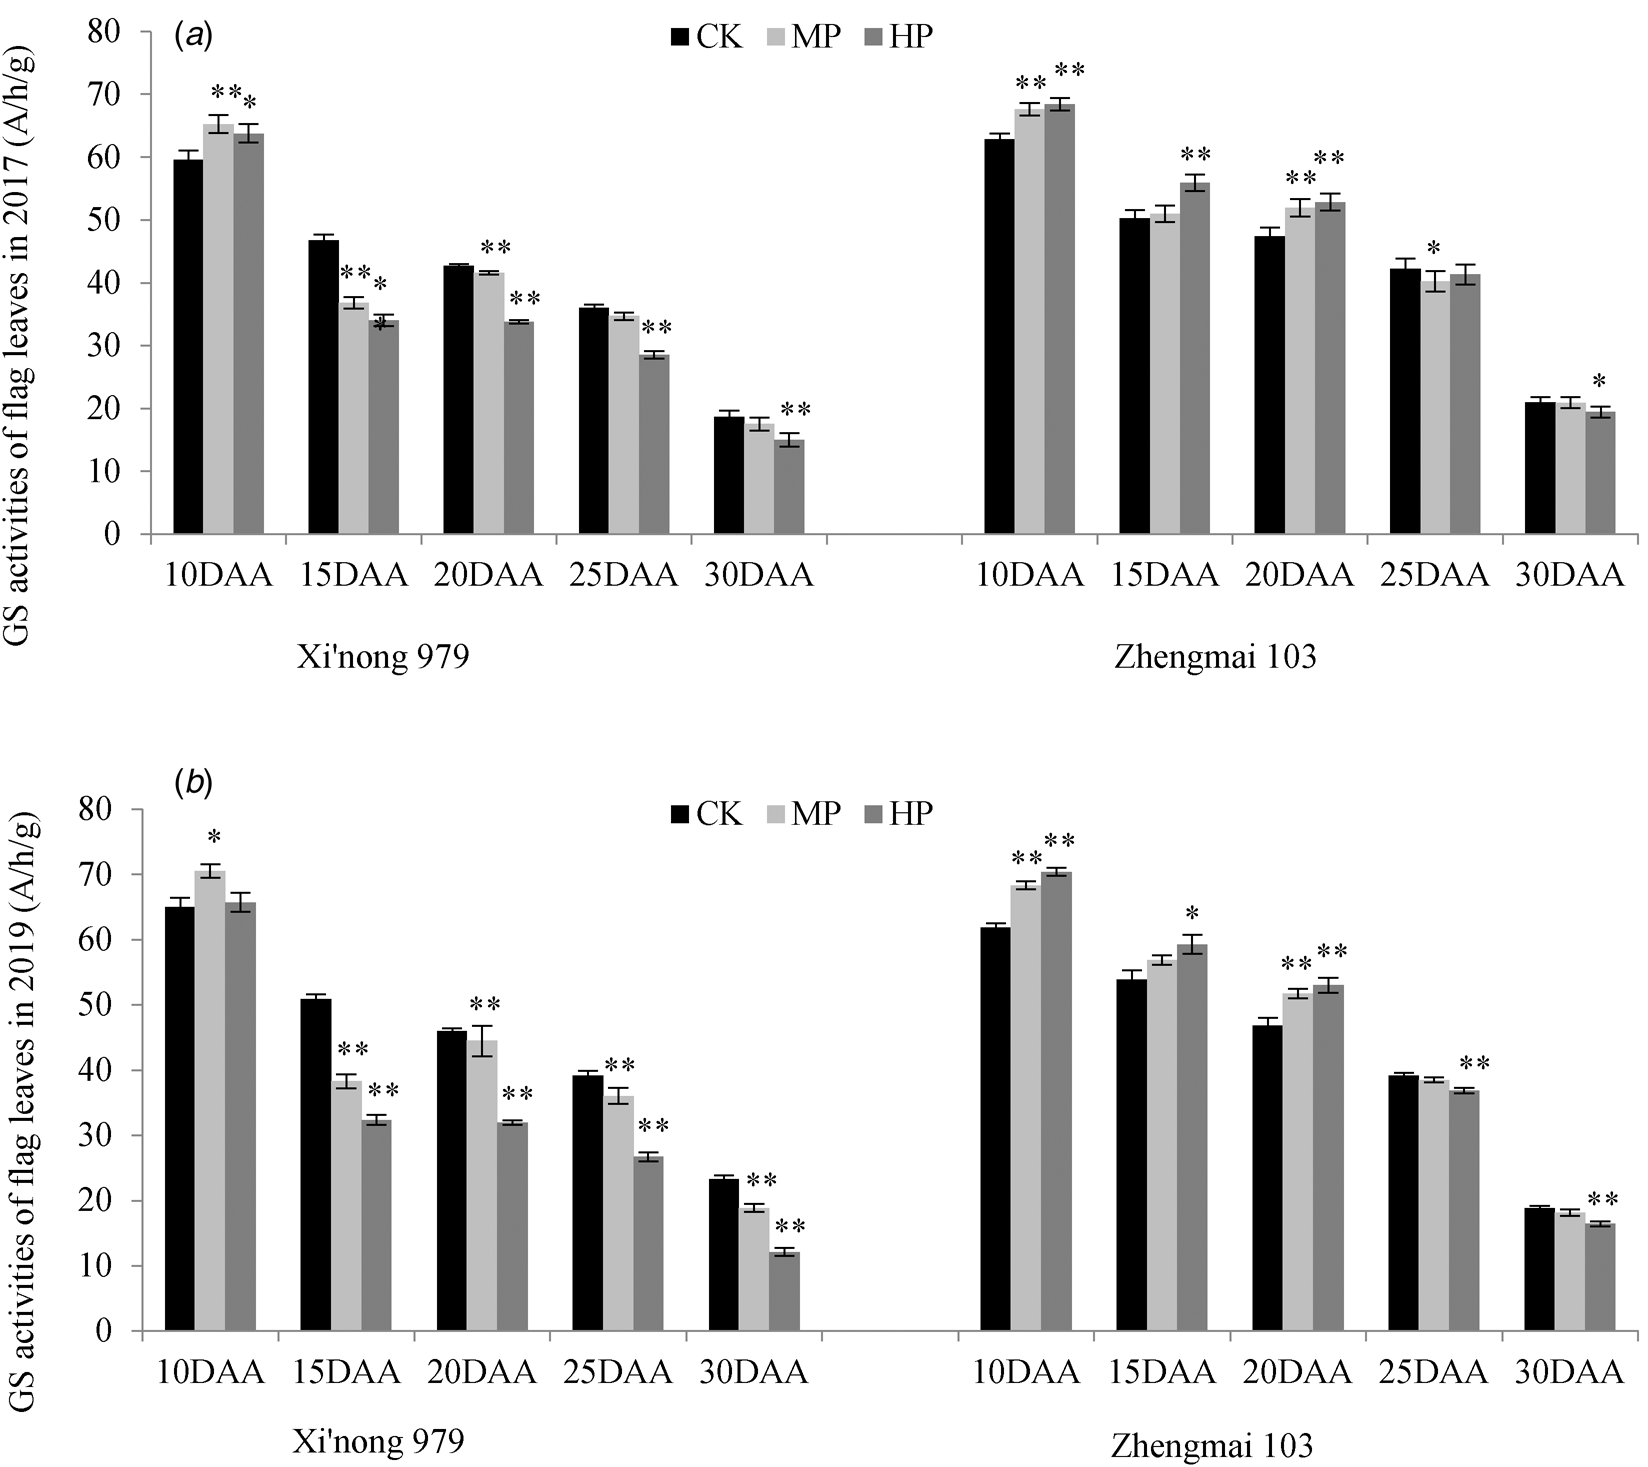
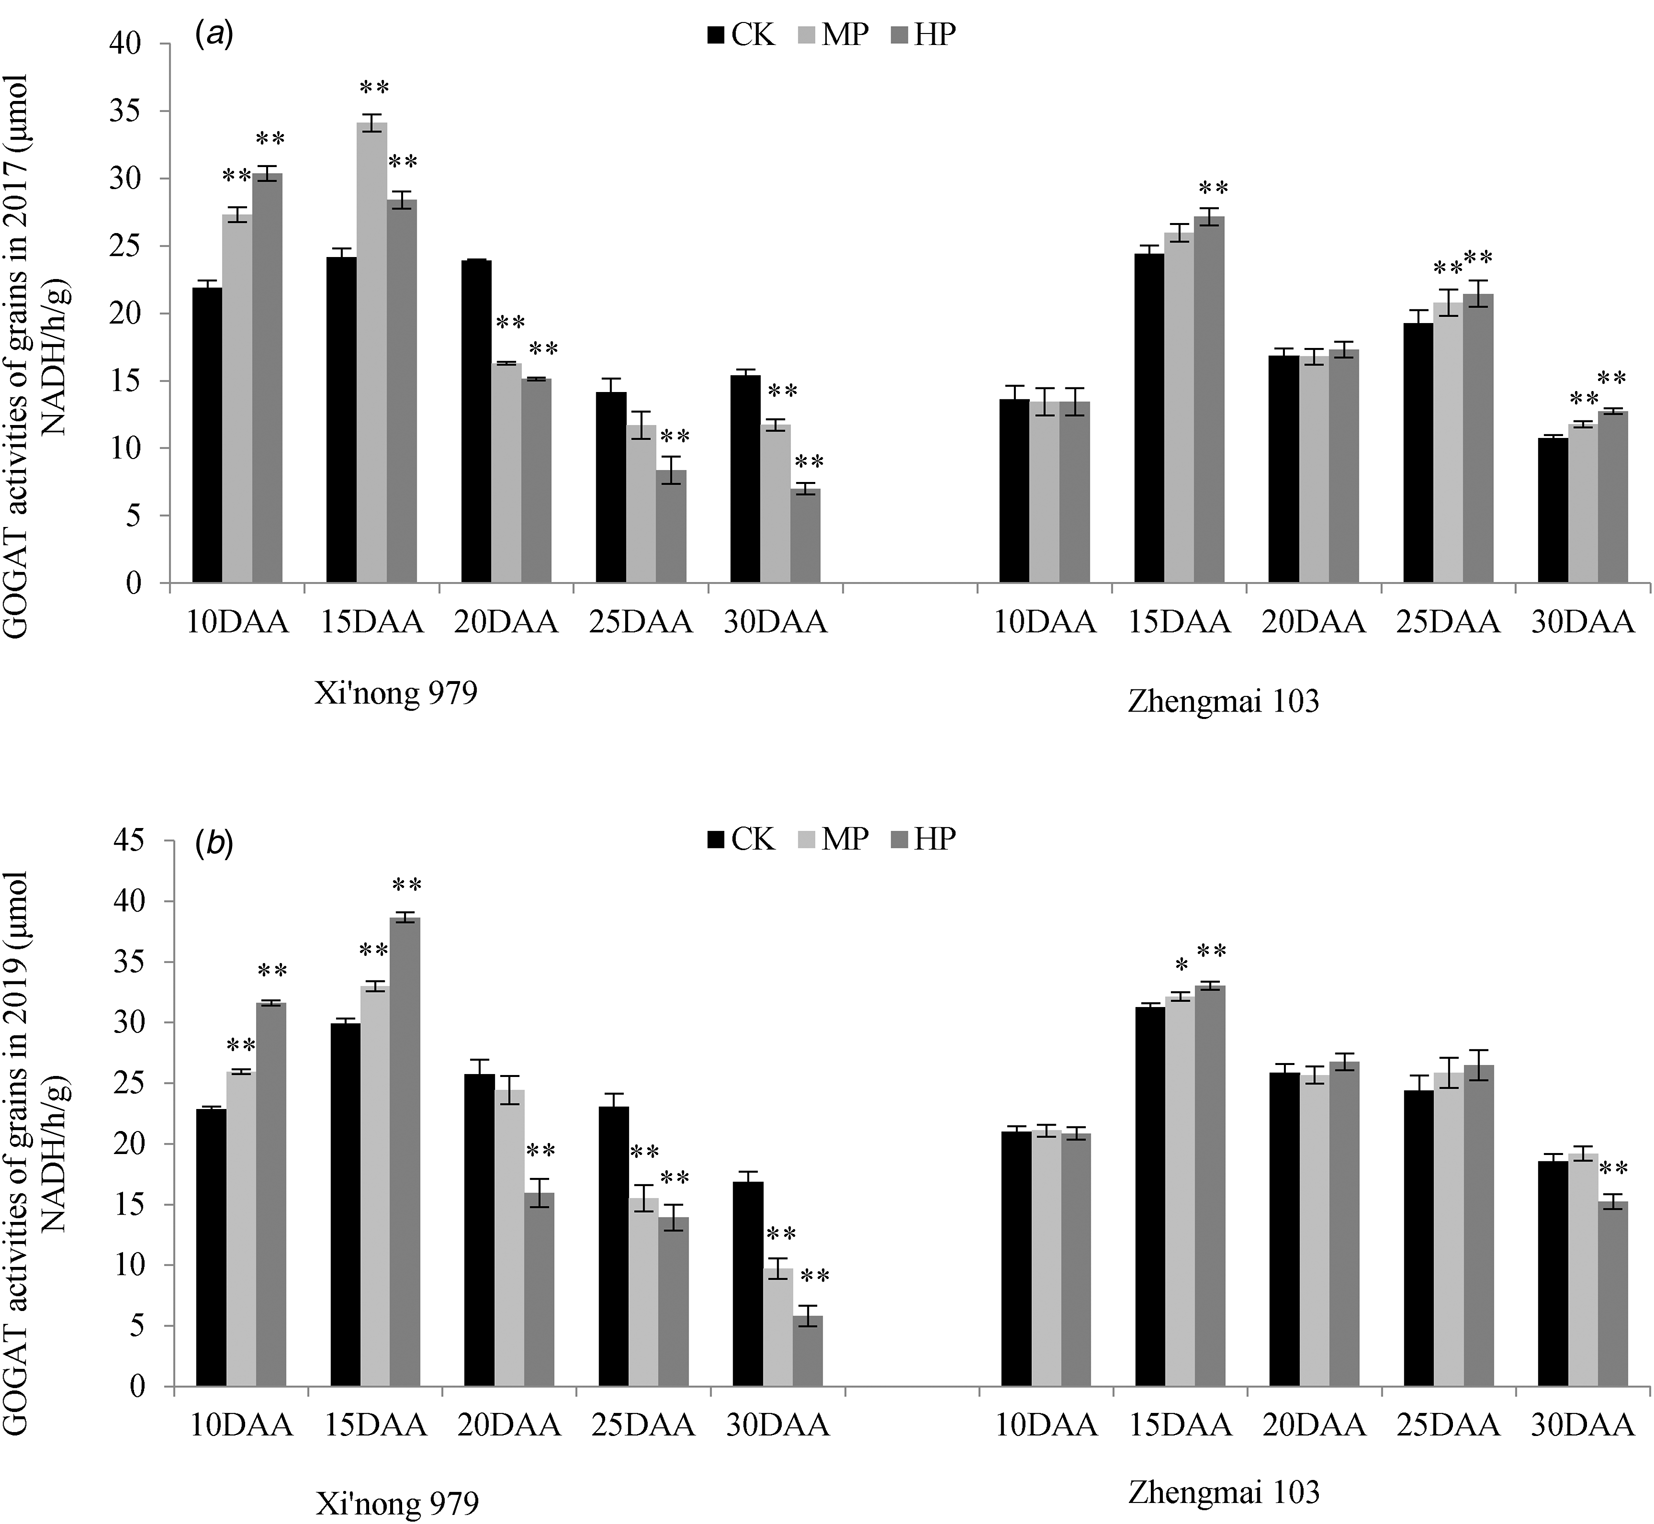
The results showed that the GS activity in grains of the susceptible cultivar Xi'nong 979 increased (HP > MP > CK) with the increase of DI from 10 to 15 DAA, and decreased from 20 DAA (Fig. 4). The change of GS activity in flag leaves was similar to that in grains, but the trend was slightly different at 15 DAA (Fig. 5). At 15 DAA, the GS activity in Xi'nong 979 showed a decreasing trend in both years, namely CK > MP > HP (Fig. 5). However, the turning point of GS activity from increasing to decreasing in flag leaves occurred at 15 DAA, while in grains it occurred at 20 DAA. The activity of GOGAT in grains also increased at first and then decreased in Xi'nong 979, and the decrease of GOGAT activity also began at 20 DAA (Fig. 6). As shown by correlation analysis with DI, for the susceptible cultivar (Xi'nong 979), GS and GOGAT activities in grains at 10 and 15 DAA correlated positively with DI, reaching a significant level or an extremely significant level (Table 4). The correlation coefficient was high and varied between 0.84 and 0.99. During 20–30 DAA, GS and GOGAT activities in grains and GS activity in flag leaves were negatively correlated with DI, and the correlation coefficients were between 0.70 and 0.98.
Total glutamine synthetase (GS) activities in grains of two cultivars under no inoculation (CK), one inoculation (MP) and nine inoculations of Bgt (HP) treatments during the grain filling stage in 2 years. Error bars indicate s.e.m. (n = 3) ‘*’ and ‘**’ indicate a significant level correlation at the 0.05 and 0.01 levels, respectively.

Total glutamine synthetase (GS) activities in flag leaves of two cultivars under no inoculation (CK), one inoculation (MP) and nine inoculations of Bgt (HP) treatments during the grain filling stage in 2 years. Error bars indicate s.e.m. (n = 3) ‘*’ and ‘**’ indicate a significant level correlation at the 0.05 and 0.01 levels, respectively.

NADH-glutamate synthase (GOGAT) activities in grains of two cultivars under no inoculation (CK), one inoculation (MP) and nine inoculations of Bgt (HP) treatments during the grain filling stage in 2 years. Error bars indicate s.e.m. (n = 3) ‘*’ and ‘**’ indicate a significant level correlation at the 0.05 and 0.01 levels, respectively.

For the resistant cultivar Zhengmai 103, GS activity and GOGAT activity in grains in HP increased during grain filling, and only slightly decreased at 30 DAA in both years (Figs 4 and 6). GS activity in flag leaves increased from 10 to 20 DAA, and slightly decreased at 25 and 30 DAA in both years (Fig. 5).
Effects of wheat powdery mildew on GPC and yield
In HP, GPC of susceptible cultivar Xi'nong 979 increased significantly, while yield and grain protein yield decreased (Table 3). For the disease-resistant cultivar, GPC of Zhengmai 103 in HP increased slightly, the yield decreased slightly, and there was no significant difference in protein yield among treatments in both years.
Discussion
Some studies have pointed out that the developing grain is a strong N sink, and the leaves transport amino acids into the developing grain (Masclaux-Daubresse et al., Reference Masclaux-Daubresse, Daniel-Vedele, Dechorgnat, Chardon, Gaufichon and Suzuki2010; Kaur et al., Reference Kaur, Asthir and Bains2017; Tabuchi et al., Reference Tabuchi, Abiko and Yamaya2007). The current study found that GS (GS1 and GS2) expression, GS activity, GOGAT activity in grains and GS activity in flag leaves of susceptible cultivars were induced by Bgt at early grain-filling stage (10–15 DAA), but decreased significantly during the middle and late grain-filling stages (15 or 20–30 DAA). However, the turning point of GS activity from increase to decrease in flag leaves occurred at 15 DAA, while the decrease of GS and GOGAT activity in grains mostly started at 20 DAA. Correlation analysis showed that GS activity, GOGAT activity and GS (GS1 and GS2) gene expression were significantly negatively correlated with the DIs at 20–30 DAA.
In the present study, in the middle and late stages of grain filling, the decline of GS activity, GOGAT activity and GS expression indicated that powdery mildew could inhibit N assimilation in flag leaves and grains, and the inhibition on flag leaves was earlier. In a previous study from our research group, it was found that the protein expression level of GS1 in grains at 15–30 DAA decreased after powdery mildew infection (Li et al., Reference Li, Yang, Li, Niu and He2017), which was consistent with the decrease of GS1 mRNA level in the present study. GS activity was also inhibited under other biotic stress. The host GS activity was inhibited by Colletotrichum lindemuthianum (Tavernier et al., Reference Tavernier, Cadiou, Pageau, Lauge, Reisdorf-Cren, Langin and Masclaux-Daubresse2007) and Pseudomonas syringae pv. tomato (Pérez-García et al.,Reference Pérez-García, Pereira, Pissarra, Gutiérrez, Cazorla, Salema and Cánovas1998), which was consistent with the results of the current study. It has also been reported that the GS activity of the host increased after infection by microorganisms (Silveira et al., Reference Silveira, Sala, Cardoso, Labanca and Cipriano2016; Martino et al., Reference Martino, Palumbo, Vitullo, Santo and Fuggi2018). Diazotrophicendophytic bacteria are capable of fixing N and can further promote plant growth (Silveira et al., Reference Silveira, Sala, Cardoso, Labanca and Cipriano2016). Arbuscular mycorrhizal fungus Glomus mosseae is also an N-fixing fungus and can form a symbiotic relationship with the host plant (Martino et al., Reference Martino, Palumbo, Vitullo, Santo and Fuggi2018). These two microorganisms (Silveira et al., Reference Silveira, Sala, Cardoso, Labanca and Cipriano2016; Martino et al., Reference Martino, Palumbo, Vitullo, Santo and Fuggi2018) promote plant growth, while Bgt in the current work inhibited photosynthesis and caused yield reduction.
In the early stage of grain filling, GS activity, GOGAT activity, GS1 expression and GS2 expression were induced by powdery mildew, the induction of GS1 (10 DAA) was earlier than that of GS2 (10 DAA). Thus, it was shown that N metabolism was certainly induced. However, the duration of the early induction was very short. Similar results were obtained in plants infected by other pathogens. It was found that GS1 and GS2 mRNA accumulated in the leaves of tobacco inoculated with P. syringae pv. syringae, the induction of GS2 occurred at time 5 d after inoculation and lagged behind that of GS1 (2 h after inoculation) (Pageau et al., Reference Pageau, Reisdorf-Cren, Morot-Gaudry and Masclaux-Daubresse2006). Pérez-García et al. (Reference Pérez-García, Pereira, Pissarra, Gutiérrez, Cazorla, Salema and Cánovas1998) found that the infection of tomato leaves by P. syringae pv. tomato induced the accumulation of GS1 isoform. In bean leaves infected by C. lindemuthianum, GS1 expression increased at both mRNA and protein level from an early stage of infection (Tavernier et al., Reference Tavernier, Cadiou, Pageau, Lauge, Reisdorf-Cren, Langin and Masclaux-Daubresse2007). Therefore, the duration of early induction of N metabolism by powdery mildew was very short, and the effect of powdery mildew on grain protein accumulation was small. In the middle and late stages of grain filling, which was also the key period of protein accumulation (Gao et al., Reference Gao, He, Niu, Wang and Yang2014a), the inhibition of N metabolism lasted for a long time. The results showed that powdery mildew could significantly inhibit the synthesis of protein in grains.
Previous studies on the application of N fertilizer (Kaur et al., Reference Kaur, Asthir and Bains2017; Zhang et al., Reference Zhang, Ma, Ma, Wang, Xie and Kang2017) and S fertilizer (Tao et al., Reference Tao, Chang, Wang, Wang, Ma, Yang and Zhao2018) showed that the increase of GS expression, as well as GS and GOGAT activity was accompanied by the increase of GPC (Kaur et al., Reference Kaur, Asthir and Bains2017; Zhang et al., Reference Zhang, Ma, Ma, Wang, Xie and Kang2017). The present study also found that, consistent with our previous work (Gao et al., Reference Gao, He, Niu, Wang and Yang2014a), powdery mildew caused a significant increase in GPC, but a significant decrease in yield and protein yield. For the elevated GPC, the study (Gao et al., Reference Gao, He, Niu, Wang and Yang2014a) speculated that there might be two reasons, one reason is that the metabolic environment of grains is conducive to protein synthesis. The other possibility is a passive increase in GPC due to yield reduction. After 2 years of experiments, an important conclusion was reached that powdery mildew had an inhibitory effect on N metabolism, and the increase of GPC was due to the passive increase caused by yield reduction. As shown by the study of Gao et al. (Reference Gao, Niu, Yang, Wang and He2014b), the deposition of starch was more sensitive to powdery mildew stress than that of protein. Other studies also pointed out that, the increase of GPC may result from a decrease in starch deposition rather than from an increase in protein deposition (Jenner et al., Reference Jenner, Ugalde and Aspinall1991).
Conclusions
The present study showed that powdery mildew could inhibit GS expression and activity, as well as GOGAT activity at the critical stage of grain development (middle and late stages), and the duration of induction at early stage was very short. The increase of GPC was not due to the enhancement of N metabolism in the grain. It should be the passive increase of protein content caused by the reduction of production.
Financial support
This study was supported by the National Natural Science Foundation of China (31571649) and Funding Plan for Key Scientific Research Projects in Colleges and Universities of Henan Province (19A210025).
Conflict of interest
The authors declare there are no conflicts of interest.
Ethical standards
Not applicable.