The institutional environment of Portuguese banking during the golden age years of economic growth (1950–73) has been criticised in many instances, at the time and in recent literature. Direct observers of the period, such as Wallich (Reference Wallich1951) and Pereira (Reference Pereira1953, Reference Pereira1956a, Reference Pereira1956b), and historians including Sérgio (Reference Sérgio1990) and Valério (Reference Valério2010) have stressed two main aspects of that environment: on the one hand, it would have granted excessive protection to existing banks, allowing them to obtain high rents, a disincentive for them to compete and innovate; on the other, it would have forced banks to concentrate their activity excessively on short-term commercial paper, thus preventing them from contributing effectively to finance growth.
Such supposed features of the banking system seem to be in contradiction, however, with the high growth rates of the years 1950 to 1973, the best in terms of economic growth in all of Portugal's history (see Amaral Reference Amaral2010). The apparent contradiction is not limited to Portugal, in fact, as rapid growth in many economies in that period occurred within a framework of heavily regulated financial systems. This is what Monnet (Reference Monnet2012) has appropriately called the ‘financial paradox’ of the golden age. It is difficult to reconcile the idea that a relatively free and competitive financial system is essential to finance investment at efficient prices (e.g. Freixas and Rochet Reference Freixas and Rochet1997; Guzmán Reference Guzmán2000; Barth et al. Reference Barth, Caprio, Levine and Mishkin2001) with the fast growth seen during the golden age.
The ‘paradox’ only exists, of course, if we believe that an environment of competition is the one that assures the most efficient outcome in terms of investment and capital accumulation. But some economists have questioned this, based on the notion that banking is an activity with special features (see, for instance, Petersen and Rajan Reference Petersen and Rajan1995; Cetorelli and Peretto Reference Cetorelli and Peretto2000; or, for a review paper, Northcott Reference Northcott2004). When we turn to economic history, however, we find very few authors who have sought to deal directly with the ‘financial paradox’ of the golden age. Such important works as AAVV (1994) and Cassis et al. (Reference Cassis, Feldman and Olsson1995) provide a thorough description of the various national legal frameworks but do not assess the impact of those frameworks on the actual behaviour of the agents in the market or on the growth performance of the various economies. Only a few more recent works have sought to go beyond such limited analyses. Some have followed the path of showing how the institutional environment of financial repression was not enough to fully curtail competition: Bordo et al. (Reference Bordo, Redish and Rockoff1994), Battilossi (Reference Battilossi2000), Capie and Billings (Reference Capie and Billings2004), Pons (Reference Pons Brias2002) and Pueyo (Reference Pueyo Sanchéz2003) are examples, for Canada, Europe as a whole, England and Spain, respectively.
Other works have followed a different path, namely that of suggesting how financial repression was ultimately irrelevant for growth. Wyplosz (Reference Wyplosz1999), for instance, has shown that in Belgium, France and Italy restrictions on banks were offset by various schemes (sometimes involving public institutions) allowing for a good flow of funds for investment. Both Quenouëlle-Corre (Reference Quenouëlle-Corre2005) and Monnet (Reference Monnet2012) also stress the positive effects of the complex system existing in France.
As we show in this article, Portugal is an interesting case from the international perspective. In 1933, an authoritarian regime, with a strong dirigiste tendency in economic terms, the Estado Novo, was introduced in the country. It is not surprising, therefore, that Portugal's banks were from then on very tightly regulated, even if the main piece of legislation preceded the regime and did not differ much from what existed in the rest of the western world. The legal framework, however, left a series of loopholes open, and banks used them in order to circumvent its restraints and compete with each other.
The signs of competition were various. We present them in this work in an essentially descriptive way. Much along the lines of Capie and Billings (Reference Capie and Billings2004), we provide ‘evidence’ of competition, leaving for some future work a formal test of the presence of that competition and the degree to which it existed. We make a case that competition resides at the origin of the modernisation of Portuguese banking, mostly in two dimensions: the growth of time deposits and geographical expansion. In order to draw parallels with other western countries, we provide some benchmarks. Despite the difficulties involved in these comparisons, due to many national specificities, we believe that the data presented are enough to show that Portuguese banks did not stand as outliers in comparison with their counterparts in other countries.
The remainder of this article is as follows. Section I presents the main features of the banking legislation, stressing the very tight rules in place, designed to hinder competition. Section II briefly describes the Portuguese banking system between 1950 and 1973, with special attention to the degree of concentration in the market and the behaviour of the seven most important banks. Section III presents the evidence gathered for those seven banks regarding interest rates, deposits, branching, capital ratios and profitability. Section IV concludes.
I
The financial problems resulting from World War I had a serious impact on the Portuguese banking system, with many banks trying to profit from the speculative environment of the postwar period (Reis Reference Reis and Feinstein1995). The government sought to tame the situation with a new banking law in 1925. This law was quite similar to those then in place in the rest of the western world. Most countries then implemented quite restrictive legislation (a summary for various countries can be found in AAVV 1994, and Cassis et al. Reference Cassis, Feldman and Olsson1995). The new rules in most countries called for (a) the introduction of the principle of discretionary governmental authorisation for the opening of banks, (b) high capital requirements, (c) liquidity requirements and (d) the establishment of interest rates determined by law. In most countries there was also an attempt to separate the investment and commercial activities of banks, as commercial banks in general had assumed a ‘universal’ nature since the nineteenth century and had, thus, increased the interest and liquidity risks. The Portuguese legislation included all these features.
In 1950 the law in place was still Decree 10,634, from 20 March 1925. The main features of this document, as well as the complementary legislation of 1935, are presented in the first two rows of Table 1. According to this institutional setting, banks had very limited freedom of action: deprived of an interest rate policy and forced to hold high cash reserves, they could not lend in the long run and could allocate only a very limited portion of their resources in stocks or bonds. Also, if they wished to expand geographically through branches, government authorisation was needed. It is possible (and this is the common stance of much of the literature on Portuguese banks) that such lack of freedom was somehow seen by them as advantageous, mostly thanks to the protection of their position in the market: the lack of free contestability in the market (entries as well as mergers and acquisitions depended on government authorisation) might have given banks an apparent free hand to engage in anti-competitive practices. But this requires some qualification: although mergers, acquisitions and entries depended on government authorisation, they were not forbidden, meaning that, even if restricted, the threat of exclusion from the market still existed.
Main elements of Portuguese banking legislation, 1925–73

The institutional framework resulting from the combination of Decree 10,634 and Law 1,894 was criticised at the time on several bases. The first criticism came from Henry C. Wallich, an American economist working in the context of Marshall Aid, who wrote a report on the Portuguese financial system in 1951. According to Wallich (Reference Wallich1951), ‘Portugal's credit system is well developed in some fields, less so in others. Facilities for short-term commercial bank credit are ample … [But] in the fields of agricultural and colonial credit, and of long term credit and capital for industry, much progress is still possible’ (p. 9). Many Portuguese economists and political actors would later repeat the main thrust of this opinion. Pereira (Reference Pereira1953) (one of the leading banking specialists of the time) noted that, ‘in terms of credit, the natural ability of Portuguese banks is concentrated in the short and medium run, as the liquidity principle limits strongly the use of capital for long-run periods’ (p. 88) (similar observations can be found in Pereira, Reference Pereira1956a and Reference Pereira1956b).Footnote 1
Many of these criticisms have been echoed in recent literature, such as Sérgio (Reference Sérgio1990), according to whom the Portuguese commercial banking system in the 1950s was defined by ‘excess liquidity … and the apparently almost exclusive financing of commercial activity … The protectionism of the market and the restrictive rules within which the firms acted … allowed for such high rents that they could operate in an environment of excess liquidity (without need to find profitable operations)’ (p. 74).Footnote 2 Valério (Reference Valério2010) also noted that ‘the restrictions put by the existing legislation and the dominant practices of the banks generated a situation of excess reserves that can be truly classified as structural’ (p. 130).Footnote 3
Accurate or not, such criticisms inspired important legislative changes, even if they did not change the generally repressive nature of the regulations. The most important of these changes were laid down in a new legislation package in 1957 and 1959, the main elements of which can be found in row 3 of Table 1.
One further element of the legislative environment faced by the Portuguese banking sector that needs mention is its position within the corporatist institutions typical of the Estado Novo. Since this regime defined itself as being ‘corporatist’, it sought to cover most social and economic activities with the appropriate institutions. Accordingly, the banking sector was granted a representative in the Corporatist Chamber, a consultative legislative body created in 1933. In 1935, a National Credit Council (Conselho Nacional de Crédito), where representatives of the government and the banking sector met to deal with issues affecting the market, was created.Footnote 4 Although this institutional environment had the potential of giving bankers an opportunity to exert control over the market, the few indications we have are that the council never had a great role in disciplining it (see below). In 1936, the official (corporatist) bankers' association (Grémio Nacional dos Bancos e Casas Bancárias) was created, devoted mostly to negotiating labour conditions with the sector's unions, along with a limited role in coordinating the market.Footnote 5 In 1957 the government authorised the creation of the Credit and Insurance Corporation.Footnote 6 According to Valério (Reference Valério2010), the corporation had only ‘a negligible role in Portuguese banking life’ (p. 118).
II
Since the new legislation of 1957–9 did not change most of the market conditions arising from the legislation of 1925, both the observers of the period and recent historians believe it kept on offering banks a very cosy environment. Although not founded in any explicit theory, Sérgio's (Reference Sérgio1990) idea that banks enjoyed such high rents that they could sit on a pile of cash reserves in excess of the legal requirement (something that is also stressed by Wallich Reference Wallich1951, Pereira Reference Pereira1953, Reference Pereira1956a, Reference Pereira1956b and Valério Reference Valério2010) raises some issues.
First, the idea implies that banks somehow enjoyed some form of ‘excess profits’. Only under such conditions could they forgo income earned in credit instruments and keep much of their assets in the form of sterile cash reserves. Under perfect competition no existing agents in the market can influence the price, and profit maximisation takes place at the point where marginal cost equals marginal revenue. ‘Excess profits’ for such a long period as the one studied here can only exist, then, if marginal revenue consistently exceeds marginal cost, and this is only possible if some form of protected oligopoly exists. Under such conditions agents are able to determine either the price or the quantity of the product in the market, and this can happen only if there are high barriers to entry. Such barriers existed in the Portuguese banking market, as discussed above, in mainly two ways: high initial capital requirements and discretionary authorisation by the government (which additionally had adopted a no-new-entrants rule, even if a cum grano salis one) (see above and Table 1). Under such conditions, particularly the rule preventing new entrants, it seems that Portuguese banks could adopt anti-competitive practices without much fear of being put out of business. The only hard data the literature presents in favour of this idea, however, is the high cash ratio (excess reserves) of Portuguese banks. Even if Sérgio (Reference Sérgio1990) provides figures on profits for the period between 1950 and 1959, she gives no definition of ‘excess profits’ (or ‘rents’, in her own words) and does not make any comparison. Consequently, she does not provide a guide on how to interpret the existing profit rates.
We challenge such ideas in this and the next sections. Although not conveying the image of an environment of freedom, we nevertheless point to the presence of some form of competition. In this section we provide some preliminary indicators, with a more thorough analysis in the following ones.
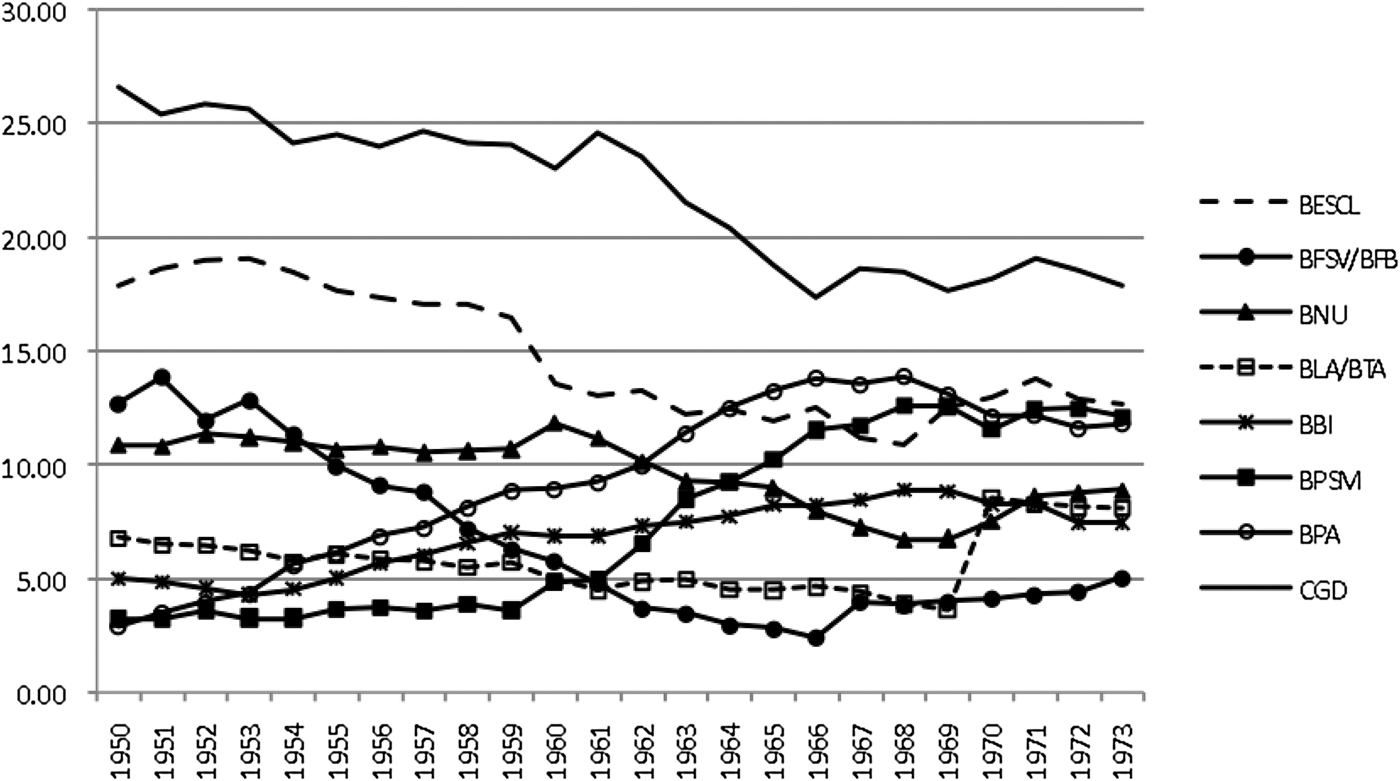
In 1950 the Portuguese banking system comprised 22 incorporated commercial banks, 13 non-incorporated banking houses and 20 savings banks (INEb 1953). Incorporated commercial banks dominated the market, accounting for roughly 69 per cent of all deposits (up from 40 per cent in 1938; see Roquette et al. Reference Roquette1968). Non-incorporated banks were residual, with a market share of about 1.5 per cent (INEa 1950). Most of the 20 savings banks were of small size, with the exception of the National Savings Bank (Caixa Geral de Depósitos). Savings banks accounted for about 30 per cent of deposits but most of this came precisely from the Caixa Geral de Depósitos (CGD), which represented 90 per cent of all deposits in savings banks and was the largest financial institution in the country, with a market share of around 27 per cent (Figure 1). There were also 10 credit companies, among which only one was of significant size.
Market share of deposits of the seven largest commercial banks and the Caixa Geral de Depósitos, 1950–73 (%)
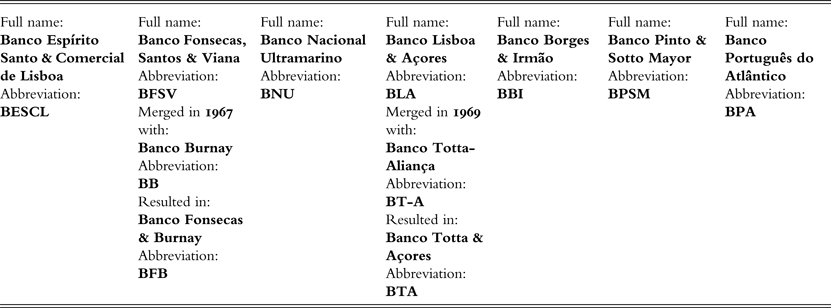
The seven largest commercial banks in 1950 (Figure 1) were BESCL, the market leader since 1947, with a share of deposits of roughly 18 per cent, followed by BFSV, with roughly 13 per cent, then BNU, with close to 11 per cent, then BLA, with approximately 7 per cent, then BBI, with almost 5 per cent, and finally BPSM and BPA, both with about 3 per cent – for the full names of the various banks, see Table 2. The rest of the banks not listed here were all of a much smaller scale, and sometimes only regional.
Full names, abbreviations and mergers of the seven largest commercial banks, 1950–73
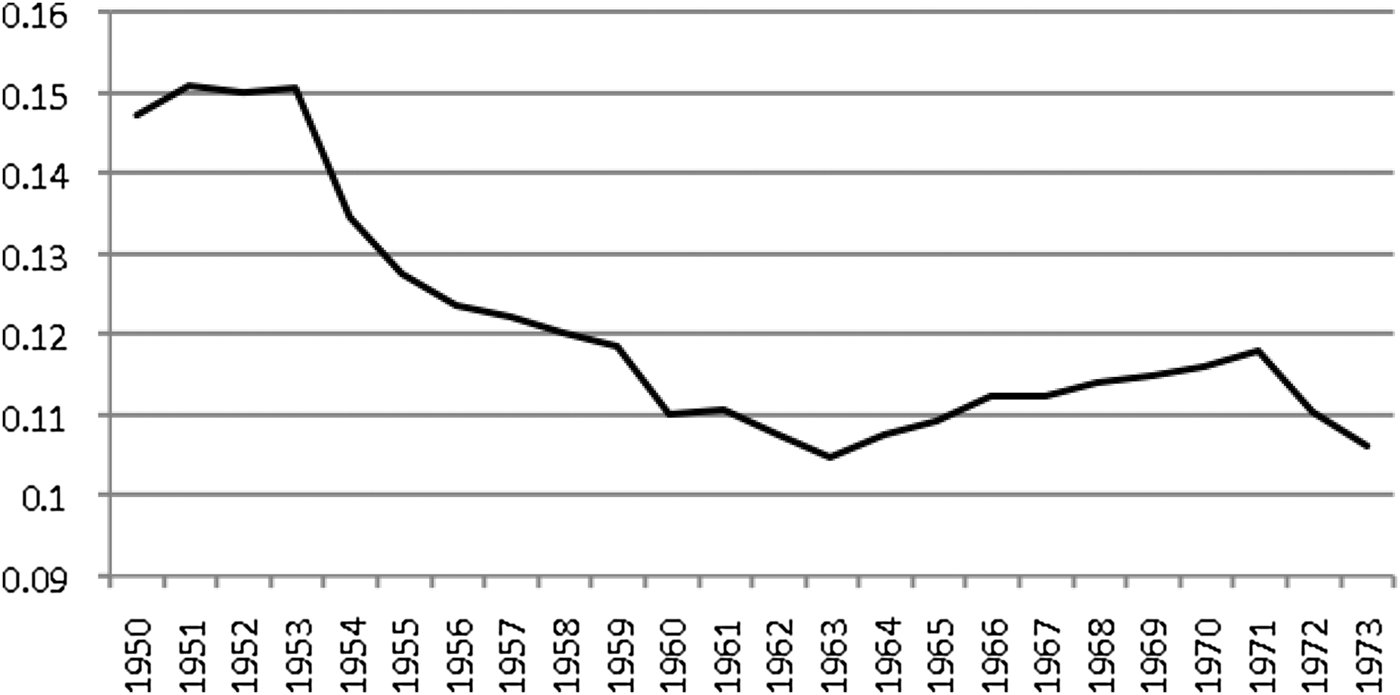
The Hirschman-Herfindahl Index (HHI), a measure of market concentration, for deposits in the Portuguese commercial banks in 1950 (which excludes CGD) was 0.15 (Figure 2). The significance of this value in terms of market concentration has no immediate interpretation: did this represent a high, moderate, or low degree of concentration? There are no generally accepted standards of assessment, but the merger guidelines of the US Department of Justice can be used as a benchmark (see US Department of Justice and Federal Trade Commission, 1982, and 2010). According to its latest version (of 2010), an HHI of 0.15 corresponds to a concentrated market (even if moderately so).Footnote 7
Market concentration in Portuguese commercial banking (Hirschman-Herfindahl Index, deposits), 1950–73 Note: until 1959 deposits in each bank were published in INEc; after that date this publication disappeared, and the data had to be retrieved from the banks' annual accounts.
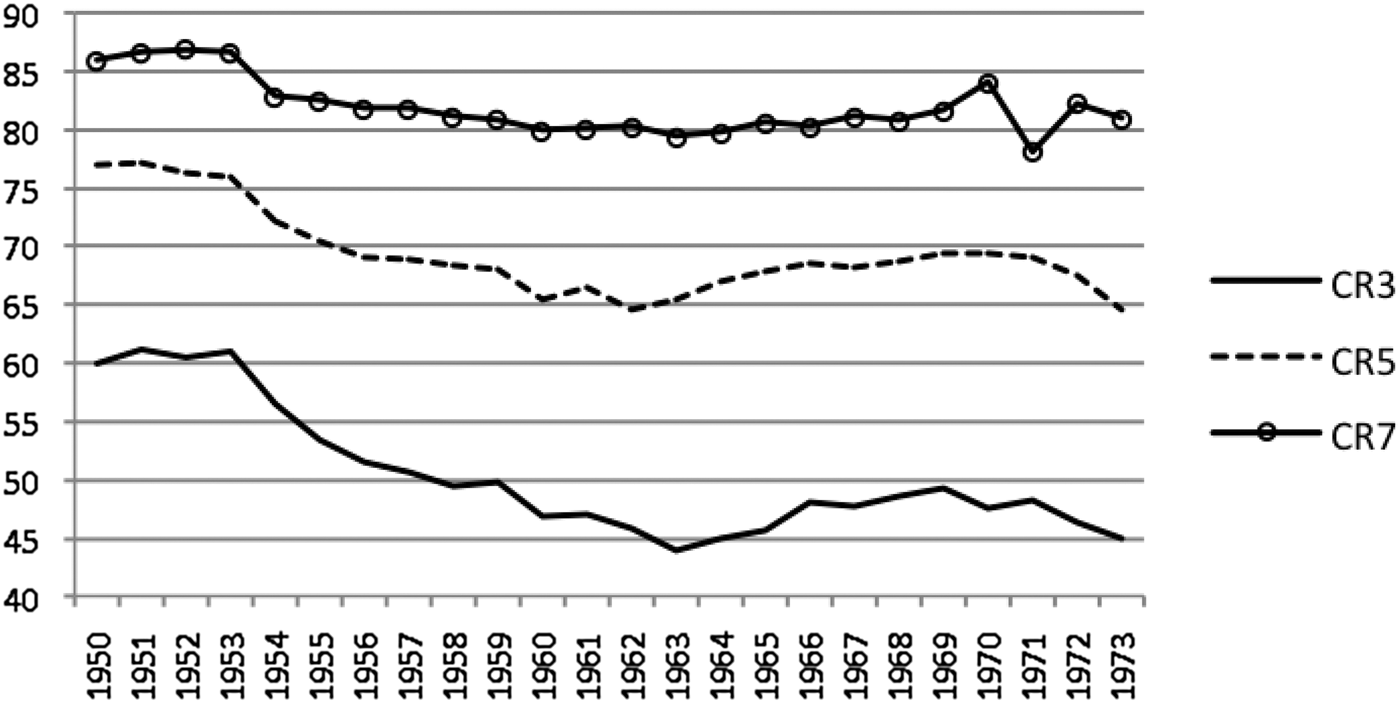
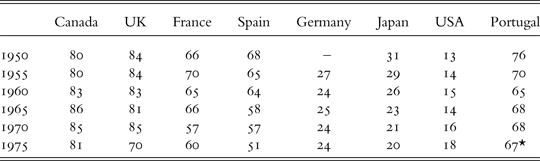
The concentration ratios in Figure 3 (measuring the proportion of deposits appropriated by, respectively, the three, five and seven largest commercial banks in Portugal), together with the international data in Table 3, seem to corroborate this idea, as they show a degree of concentration that was lower than in Canada or the UK and not far from France or Spain.
Concentration ratios in Portuguese commercial banking (deposits), 1950–73 (%) Notes: CR3: deposits in the first three largest banks; CR5: deposits in the first five largest banks; CR7: deposits in the first seven largest banks.
Concentration ratios, various countries (CR5) (deposits), 1950–75 (%)
* 1973
Sources: For Portugal, see Figure 2; for the remaining countries, Revell (Reference Revell1987), except Spain, Pueyo (Reference Pueyo Sanchéz2003).
Twenty-three years later, in 1973, the banking structure had changed considerably. Commercial banks now held 80 per cent of all deposits in the country (up from 69 per cent), with the remaining 20 per cent being held almost entirely by CGD (18 per cent, down from 27 per cent). The number of incorporated banks had dropped to 14 (down from 22) (Valério Reference Valério2010) and the number of non-incorporated banks to 7 (down from 13) (INEb 1973) (none of this being the result of failures, but rather of the transformation of non-incorporated banks into incorporated ones and from mergers and acquisitions).
The 1973 picture reflects the changes in the relative position of the seven largest banks that took place since 1950, as Figure 1 shows. In 1973 BESCL was still the market leader in deposits, but its share was now much lower (a little more than 12.5 per cent). The next positions were now occupied by the two smallest (among the seven larger) banks in 1950, BPSM and BPA. Both had jumped from a market share of approximately 3 per cent to one that closely matched BESCL (roughly 12 per cent) and had even been able to overtake BESCL for a few years (BPA between 1965 and 1969, a period in which it was the market leader, and BPSM in 1967 and 1968). The second bank in 1950, BFSV (which changed its name to BFB after a merger in 1967; see Table 2 for full names of the banks, abbreviations and dates of merger) was now the smallest, with a market share of about 5 per cent, and even this market share was only possible thanks to the merger. The third bank in 1950, BNU, was now fourth, with a lower share than in 1950 (more or less 9 per cent), and was accompanied by two banks of much smaller size in 1950 (BBI, and BLA, which meanwhile had changed its name to BTA also thanks to a merger in 1969; see Table 2 for full names of the banks, abbreviations and dates of merger).
A few aspects of the evolution just portrayed should be underscored: (a) the threat to the market leader (BESCL) posed by two initially much smaller competitors but that proved to be considerably more dynamic throughout the period (BPA and BPSM); (b) the persistent decline of what was, in 1950, the second most important bank, BFSV; (c) the decline of BNU, even if much less pronounced than that of BFSV; (d) the interesting and dynamic behaviour of an initially small bank that was able to reach an intermediate position in 1973, BBI; and (e) the decline of a bank of intermediate size in 1950 (BLA), which was rescued at the eleventh hour by the merger with an institution with similar characteristics, BT-A. We, thus, have, on the side of dynamism BPA, BPSM and BBI, and on the side of decline, BFSV, BLA and BNU. On top, we have BESCL, struggling to keep its position, with initial decline but apparent late recovery. For some aspects of the history of these banks, see Bessa-Luís (Reference Bessa-luís1969), BPA (1993), Câmara (Reference Câmara1972, 1985 and 1989), Sousa (Reference Sousa1984), Damas and Ataíde (Reference Damas and Ataíde2004) and Valério (Reference Valério2010).
The changes just outlined were reflected in a degree of concentration that fell between 1950 and 1973, as measured by both the HHI and the concentration ratios (Figures 2 and 3), especially until the early 1960s. The HHI went from levels around 0.15 in 1950 to around 0.10 in the 1960s (and remained at that level in 1973). As for the concentration ratios, the decline was particularly pronounced in the CR3 indicator, showing that loss of market power took place essentially at the top end of the spectrum. This is certainly a result of the erosion of BESCL's and BFSV's positions, thanks to the challenge posed by BPA and BPSM. The decline in CR3 is also explainable by a loss of market power of the three largest institutions as a whole. That is why the decline of CR5 is less pronounced than that of CR3 and the decline of CR7 is overall practically non-existent. By the end of the period the seven leading banks were still the same (although reflecting various mergers), but their order in terms of importance in the market had been radically altered.
Although apparently straightforward, measures of market concentration pose problems of interpretation when used as a proxy for competitive behaviour. Market concentration does not tell us if banks can actualise market power, and for more than one reason: first, concentration may itself be the consequence of high competition; in this case, concentration would just be the outcome of a competitive process in which the most efficient institutions would have been able to drive the least successful ones out of the market. Consequently, a declining concentration would not necessarily indicate more competition. Also, even admitting that higher concentration by itself means market power, one needs to wonder about the level beyond which such market power can be exerted. Market concentration measures do not, therefore, by themselves confirm the existence (or lack) of competition. But they are a preliminary indicator, and the behaviour of the measures presented above does raise some questions regarding the idea of a ‘cosy’ environment for Portuguese banks, in which they could simply rest on their earlier achievements. Next, we will use a series of other indicators that are more explicit in this respect.
III
Interest rates, deposits, capital and profitability
As we have seen above, most of the literature uses the evidence on cash reserves as a ‘proof’ of the non-competitive behaviour of Portuguese commercial banks between 1950 and 1973. However, Amaral (Reference Amaral2013) suggests that the ‘excess reserves’ that banks supposedly held might be little else than an accounting issue related with the lack of separation in the banks' books between deposits at the Bank of Portugal and in other commercial banks. We next present even more decisive evidence questioning the lack of competition of Portuguese banks.
Interest rates, deposits and branches
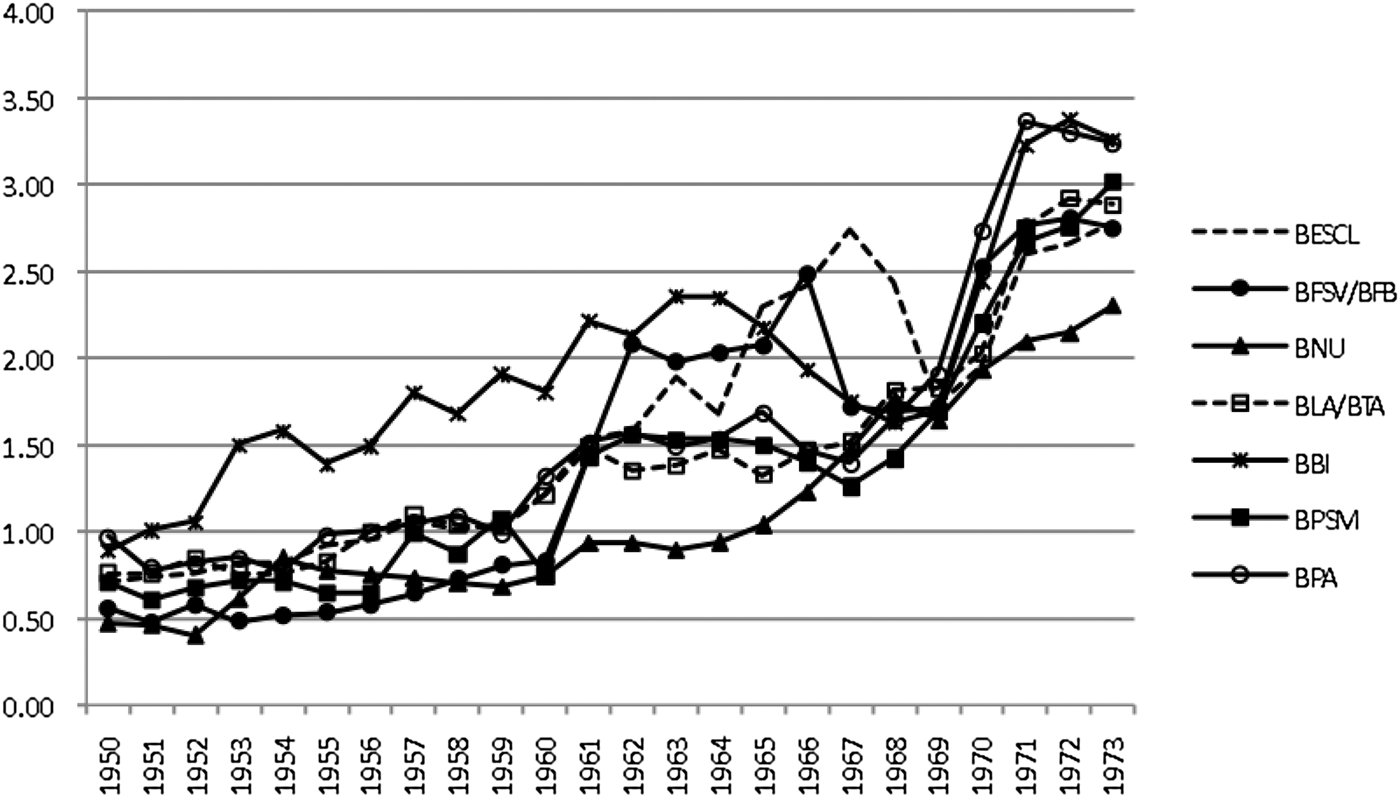
The law did not allow Portuguese commercial banks to have an autonomous price policy, as interest on deposits and credit was indexed to the Bank of Portugal's rediscount rate (see Section I and Table 1). However, when we look at the average interest rate practised on deposits by the seven largest commercial banks, we find a not insignificant variance (Figure 4). The estimates presented here are the ratio (×100) of income from interest and commissions over the amount of deposits. A note should be made about these series. They do not correspond to precise figures for the average interest rates of the various banks, but to an estimate. There are two sources of imprecision. First, deposits registered in the banks' books are separated by just three (and sometimes only two) categories: demand deposits, time deposits and small-time deposits; but there were many more interest rates, depending on the maturity of the time deposits (one month, three months, six months, one year, two years, more than two years). It is thus impossible to directly link the various rates with the various types of deposits. The second source of imprecision comes from the fact that in their books banks lumped together into a single accounting item income from interest and income from commissions.
Average interest rate on deposits (seven largest commercial banks), 1950–73 (%)
Despite the imprecise nature of the data, they show remuneration policies differing from bank to bank, sometimes by a large amount (Figure 4). In the 1950s the difference between the bank paying the lowest average rate and the one paying the highest was between the bottom range of 0.5–0.75 per cent and a peak of 1.5–1.75–2 per cent, and in the 1960s and 1970s the difference was similar, although at higher rates. It is easy to see that much of the difference was caused by the rates practised by BBI. But in the 1960s more banks adopted similar remunerations. And even if we do not take BBI's rates in the 1950s into consideration, the differences continued to be large. Another bank that stands out in comparison with the remaining ones is BNU, although for the opposite reason: its consistency in paying the lower rates in the market. These two contrasting behaviours are easily explained by the nature of each of the banks. BBI was the dynamic financial arm of a business group (Sousa Reference Sousa1984), able to squeeze the financial margin in search of funds for other activities, while BNU was a para-public institution (Valério Reference Valério2010) that could pay low interest and still attract a large number of depositors, thanks to the implicit guarantee of (partial) state ownership.
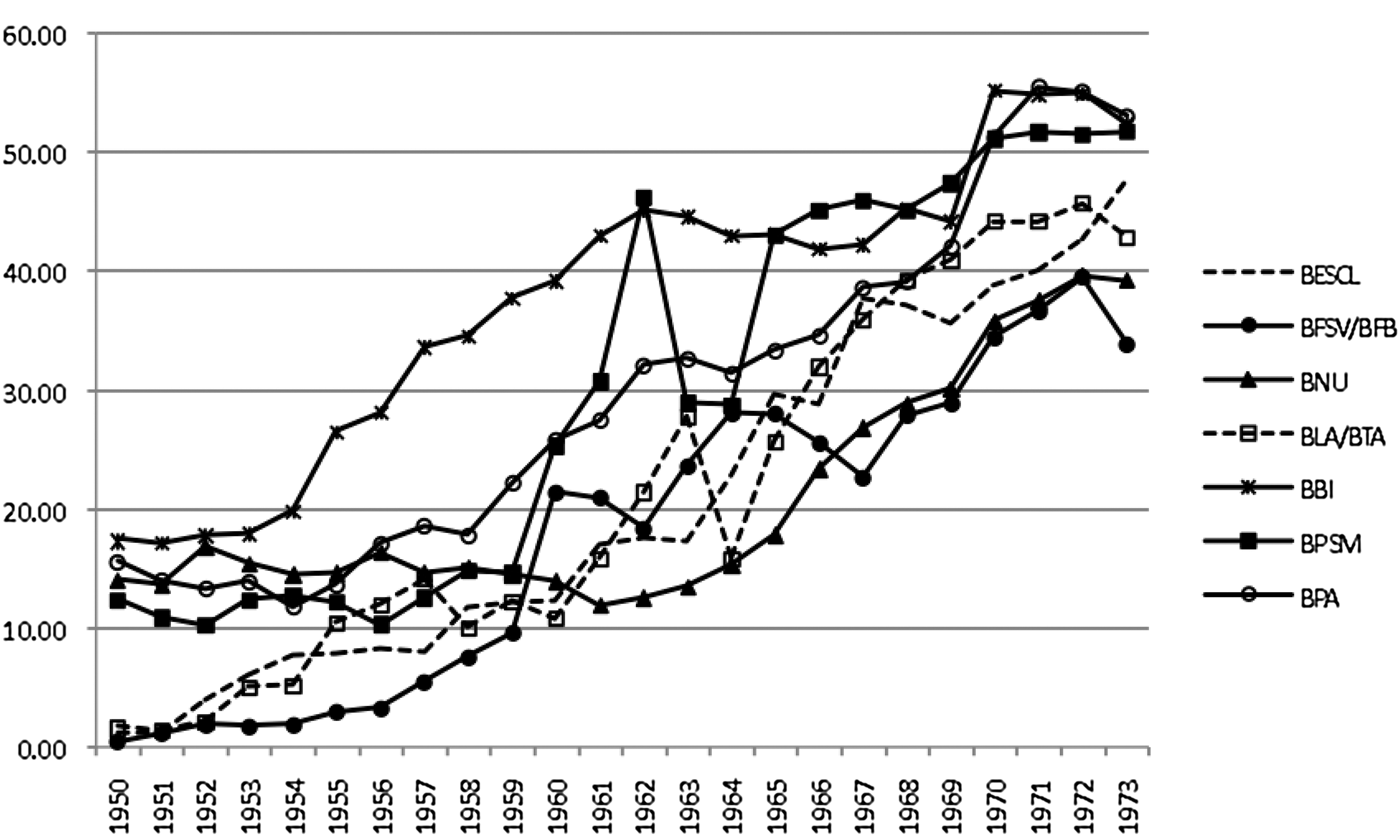
If banks could not compete on the interest rates offered to depositors, the only explanation for the differences just reported must have to do with the types of deposits held in each bank, as time deposits were remunerated at a higher rate than demand deposits. Figure 5 shows that indeed the volume of time deposits differed between the various banks, even if it increased in all of them during the 1960s. Not surprisingly, taking into consideration the previous data on interest, BBI is the bank with the highest proportion of time deposits most of the time. In 1950 the seven banks under analysis could be classified into two groups in terms of holdings of time deposits: on the one hand, we had BBI, BPA, BPSM and BNU, with a higher proportion of time deposits; on the other, BESCL, BLA and BFSV, with the lowest. This fits well with the picture presented above concerning the most and least dynamic banks. The initial exception is BNU, but it soon converged in the rest of the period to the pattern typical of the least dynamic. Even if the most active in the process of attraction of time deposits were BBI, BPSM and BPA, all others also entered the race as time passed. In 1973 figures for the seven largest banks with respect to time deposits ranged between 35 and 50 per cent of all deposits.
Proportion of time deposits in total deposits (seven largest commercial banks), 1950–73 (%)
From the 1960s on the attraction of time deposits was, thus, an important instrument of competition. Until 1965 there was no legal restriction on the interest asked on time deposits (the important legal restriction here being, of course, the one on credit, as banks could not offer rates on time deposits for which they could not find a match from the assets side). But the introduction of legal limits for rates on time deposits in 1965 did not stop their growth, something that is explained by the structure of the different rates, biased in favour of time deposits (see row 3 in Table 1).
The idea of competition through time deposits is also supported by some qualitative data. Silva (Reference Silva1967) noted that in the 1960s, ‘an increasing number of banks launched truly aggressive campaigns in order to attract depositors. Such campaigns would not have been very rewarding, however, if banks had not used the return associated with those deposits as an instrument. As a consequence [of the existing legal limits], the fight had to be concentrated in time deposits’ (p. 17). Various banks seem to have even crossed the line of legality: ‘outdated rates have fostered [banks], in terms of liabilities [i.e. deposits], not to comply with the law or to go subtly around the spirit of the law’ (Silva Reference Silva1968, p. 25).Footnote 8
In the 1960s complaints by banks about the legality of the practices of their competitors multiplied. The meetings of the National Credit Council, where representatives of the various banks and of the government met, overflowed with such complaints. In one of these meetings (June 1964), Fausto de Figueiredo, the representative of BFSV, could not have been clearer: ‘it is common knowledge … that legal dispositions … are not met’ (GNBCBa 1964, p. 14). In another meeting, one month later, the Visconde da Merceana, representative of BNU, paraphrased an article in a Spanish magazine: in a year in which the maximum legal rates on time deposits were 3 per cent, some banks paid 4, 5, 7 and even 10 per cent, the latter in the case of certain large accounts. According to the Visconde da Merceana, this was ‘the perfect picture of what is happening in Portugal’ (GNBCBa 1964, p. 9).Footnote 9
The disregard for legal limits concerning interest rates was apparently so widespread that in 1967, under the Bank of Portugal's sponsorship, all commercial banks plus six banking houses signed an ‘Agreement on the Discipline of Banking Activity’ (Compromisso relativo à disciplina da actividade bancária) (GNBCBb 1967), in which they pledged to respect those limits. Soon, however, under the argument that the agreement was not being respected by competitors, BESCL withdrew from it (Damas and Ataíde Reference Damas and Ataíde2004). In 1970 a new agreement was signed (GNBCGb 1970), but the lack of respect for this document was universal. Figure 4 shows precisely this: in 1969, following the first agreement, all average interest rates converged to the same value. But in 1970 the difference between them had widened again, and continued to do so until 1973.
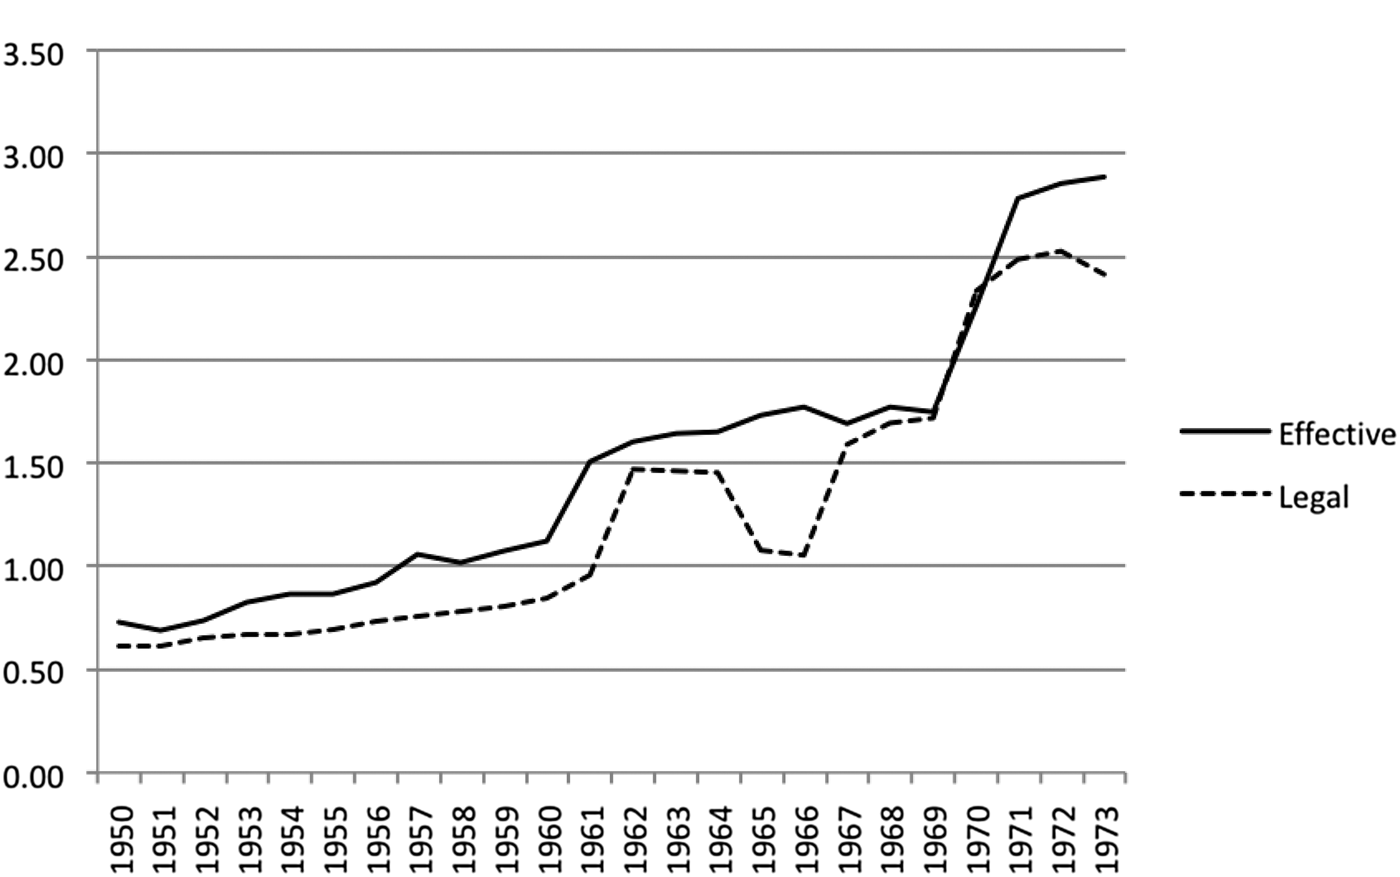
But there are even clearer indications of these illegal practices. An exercise in the style of Pons (Reference Pons Brias2001) reveals that the largest seven Portuguese commercial banks as a group paid effective average interest rates that were higher than those established by the law (Figure 6). The rates identified in the figure as ‘effective’ are those actually paid by the seven largest banks on average. The rates identified as ‘legal’ are the ones they should have paid if they had respected the legal limits. Both are average rates, balancing for the different weight of demand and time deposits held by the banks. The calculations presented in Figure 6 are simple: for effective rates, the amount of income paid by the banks in interest was divided by the amount of deposits they held, as in the case of Figure 4. Two caveats already mentioned above should be borne in mind: (a) banks' books in this period did not separate interest payments from payments in the form of commissions; (b) although we have information on the legal rates for the various types of time deposits (from one month to two years), the banks' books did not distinguish between those deposits, classifying them only as ‘time deposits’ (occasionally separating them from ‘small-time deposits’). For this reason, the procedure to calculate legal rates was a little more complex: first, an average of the legal rates on time deposits was calculated for each year; then, this average was weighted by the proportion of time deposits held by the banks; the result was then added to the legal rate for demand deposits weighted by the proportion of demand deposits held by the banks. Despite the obvious imperfection of the method (due to the data constraints), the results are still interesting as they reveal that banks paid effective interest rates above the legal ones (a result similar to that found by Pons Reference Pons Brias2001 for Spain in a similar period). Note also the brief coincidence of ‘effective’ and ‘legal’ rates at the time of the 1967–8 agreement, and how soon divergence reappeared, as many banks started breaking the deal.
Average effective and legal interest rates (seven largest commercial banks), 1950–73
Interest was not the only instrument used by banks to attract deposits. Another was geographical expansion. Throughout this entire period there was a rush for the opening of branches, particularly in the second half of the 1960s. Available aggregate data are very patchy, but they still convey a picture of strong growth. According to Sérgio (Reference Sérgio1990), between 1950 and 1959 the government authorised the opening of 121 branches. Pintado and Serra (Reference Pintado and Serra1966) count 364 branches in 1965 and 539 in the following year, i.e., an increase of 165. This means that in one single year more branches were opened than during the entire 1950s. According to Carvalho (Reference Carvalho1973), the number of branches had grown to 778 in 1972, more than twice the number of 1965.
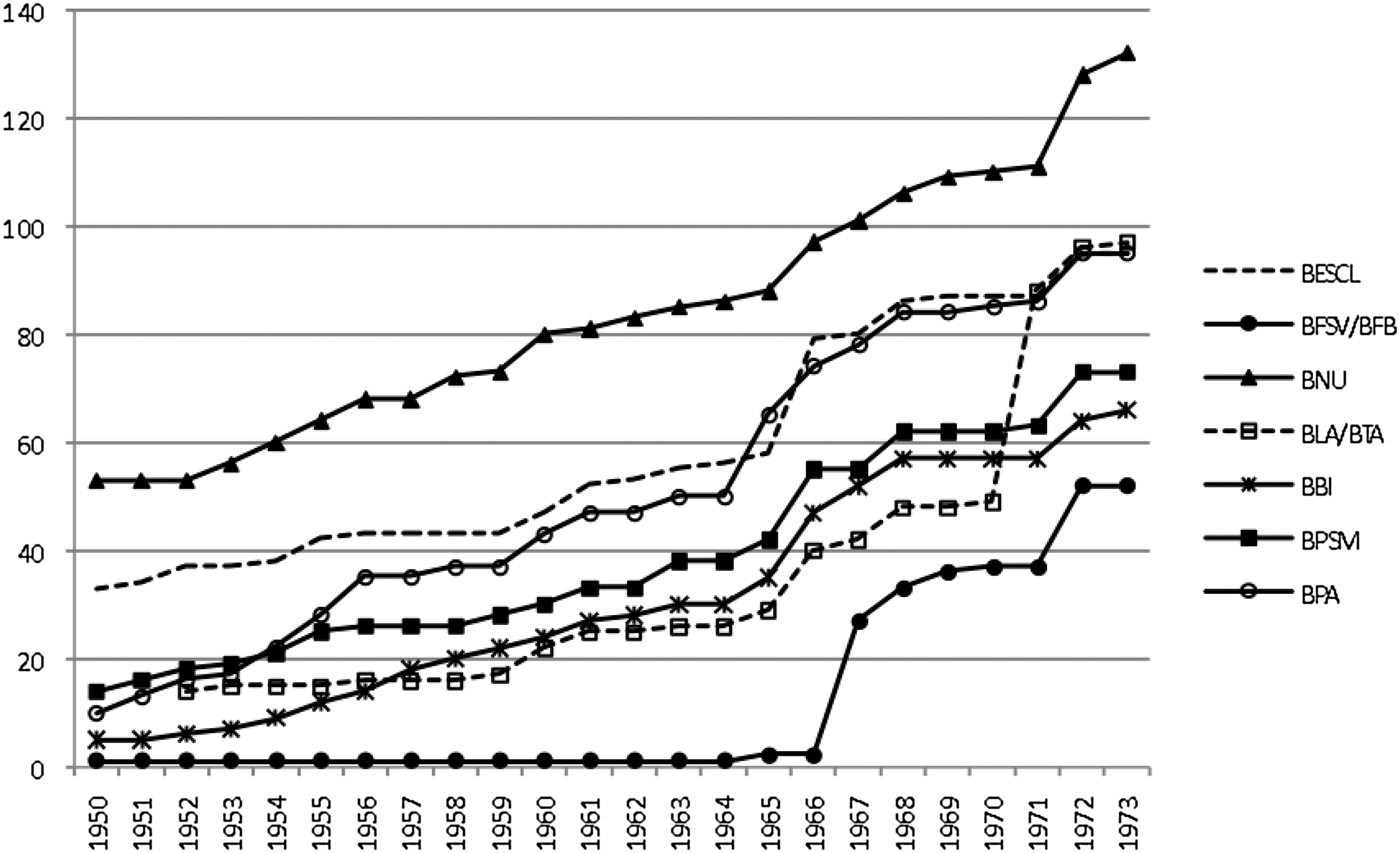
Aggregate data on branches are difficult to obtain, but we have built series for the seven largest banks. Figure 7 shows the results, confirming the general impression of growth. BNU was undoubtedly the bank with the greatest presence in the country since the 1950s. BESCL was second, although never acquiring such a vast network. This confirms the idea that these were the only banks having a truly national dimension at the beginning of our period of study. BPA displays the most consistent growth, very much connected with its strategy of capturing popular savings in large cities and small towns (Bessa-Luís Reference Bessa-luís1969; BPA 1993). By the 1960s its network was the size of BESCL's. Although growing as much as BPA in the 1960s, BPSM increased its network of branches more slowly. This is related with its concentration (contrary to BPA) in a more urban clientele (Câmara Reference Câmara1989). BBI also shows strong growth, with an expansion close to that of BPSM in the 1960s, although slower than BPA. BLA shows modest growth until the late 1960s, but with a sharp jump in 1970, almost doubling its network thanks to the merger with BT-A, allowing it to catch up with BESCL and BPA. Finally, there is the case of BFSV, which remained outside of the branch rush until 1967, with just one office until 1965 (in Lisbon), and two in 1966 (with the new Porto office). Only the merger with BB allowed BFSV to acquire a network of branches.
Number of branches of the seven largest banks, 1950–73
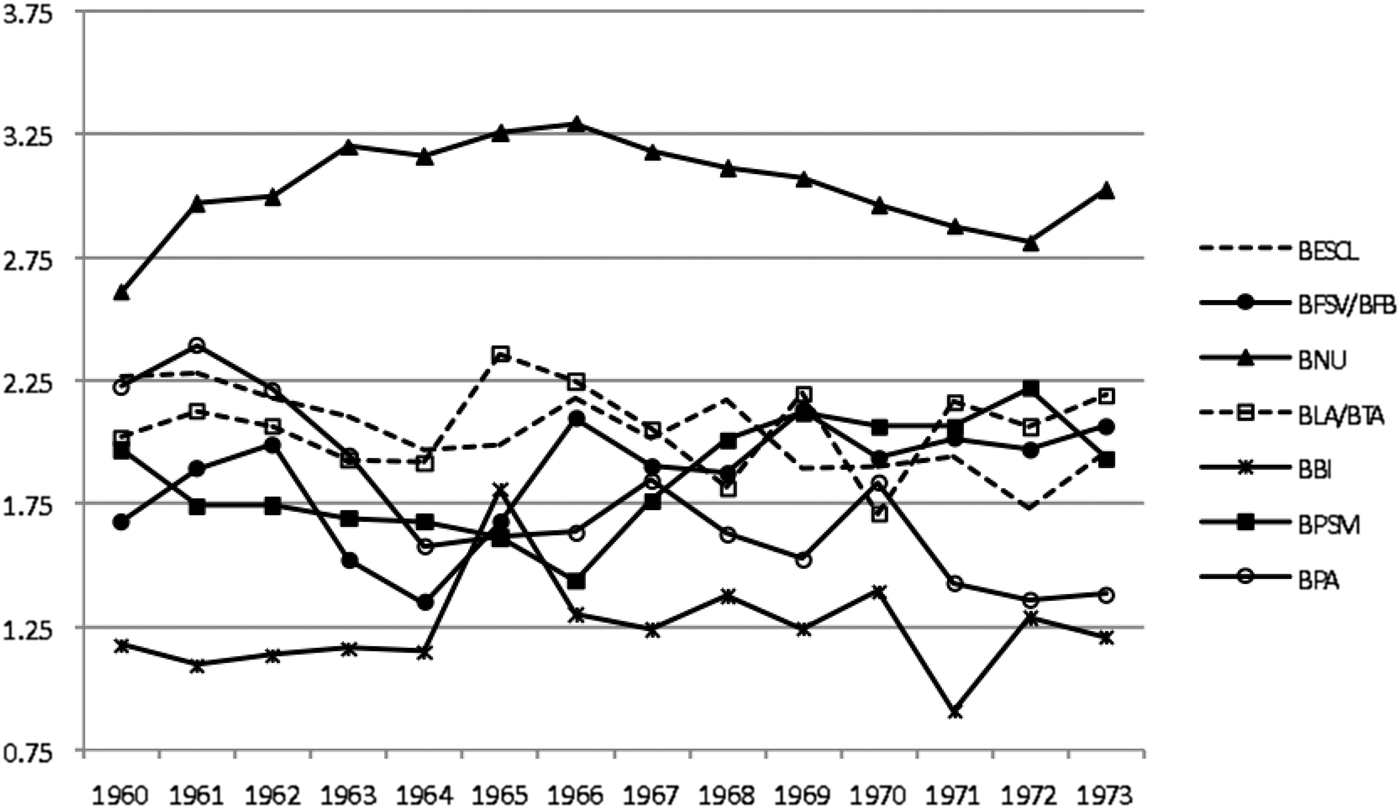
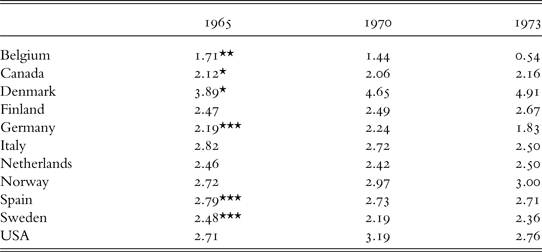
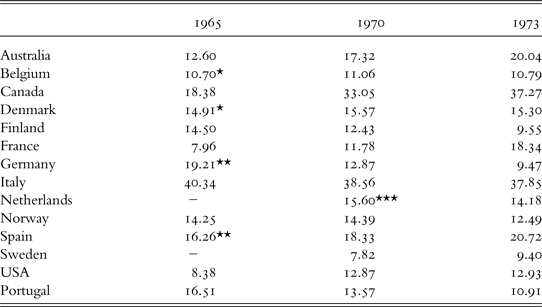
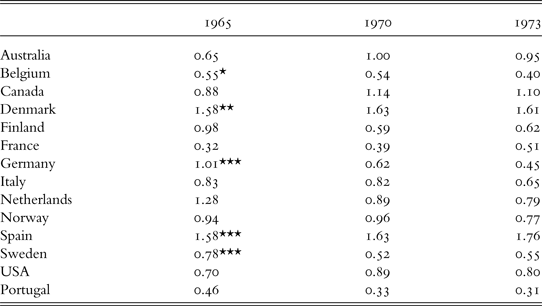
Lack of competition between banks should have translated into high interest rate margins. Figure 8 shows the financial margin (the difference between income earned and income paid on interest) of the banks analysed. These figures are subject to the same sort of shortcomings as the data on interest presented above: they lump together income from interest and commissions. Another shortcoming is that the data start only in 1960, the reason for this being that most banks were not forced by law to publish income earned from credit instruments until that date. Still, they show an interesting picture, namely one of substantial differences throughout the period. Again, not surprisingly, the bank with the closest margin was BBI, and also not surprisingly, the one with the largest was BNU. We have seen above that the latter generally practised the lowest rates on deposits, and the former the highest ones. The margins of other banks fell between the two extremes, although BPA converged to lower levels in the final years of the period. Was this high or low? Table 5 provides some figures for other countries. The Portuguese values fall within the norm.
Financial margin (interest margin/total assets) (seven largest commercial banks), 1960–73 (%)
Financial margin (interest margin/total assets) (commercial banks), various countries, 1965–73 (%)
*1966
**1967
***1968
Notes: Australia – trading banks; Canada – chartered banks; Denmark, Finland and Italy – all banks; USA – FDIC insured; all other countries – commercial banks
Source: Revell (Reference Revell1980).
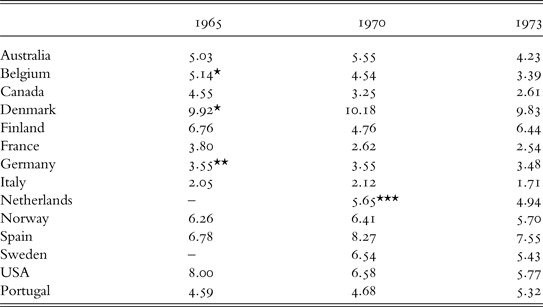
Capital–assets ratio, Portugal and various countries (commercial banks), 1965–73 (%)
*1966
**1968
***1971
Notes: Australia – trading banks; Canada – chartered banks; Denmark, Finland, France and Italy – all banks; USA – FDIC insured; all other countries – commercial banks
Sources: for Portugal – INEa; for all other countries – Revell (Reference Revell1980)
Capital
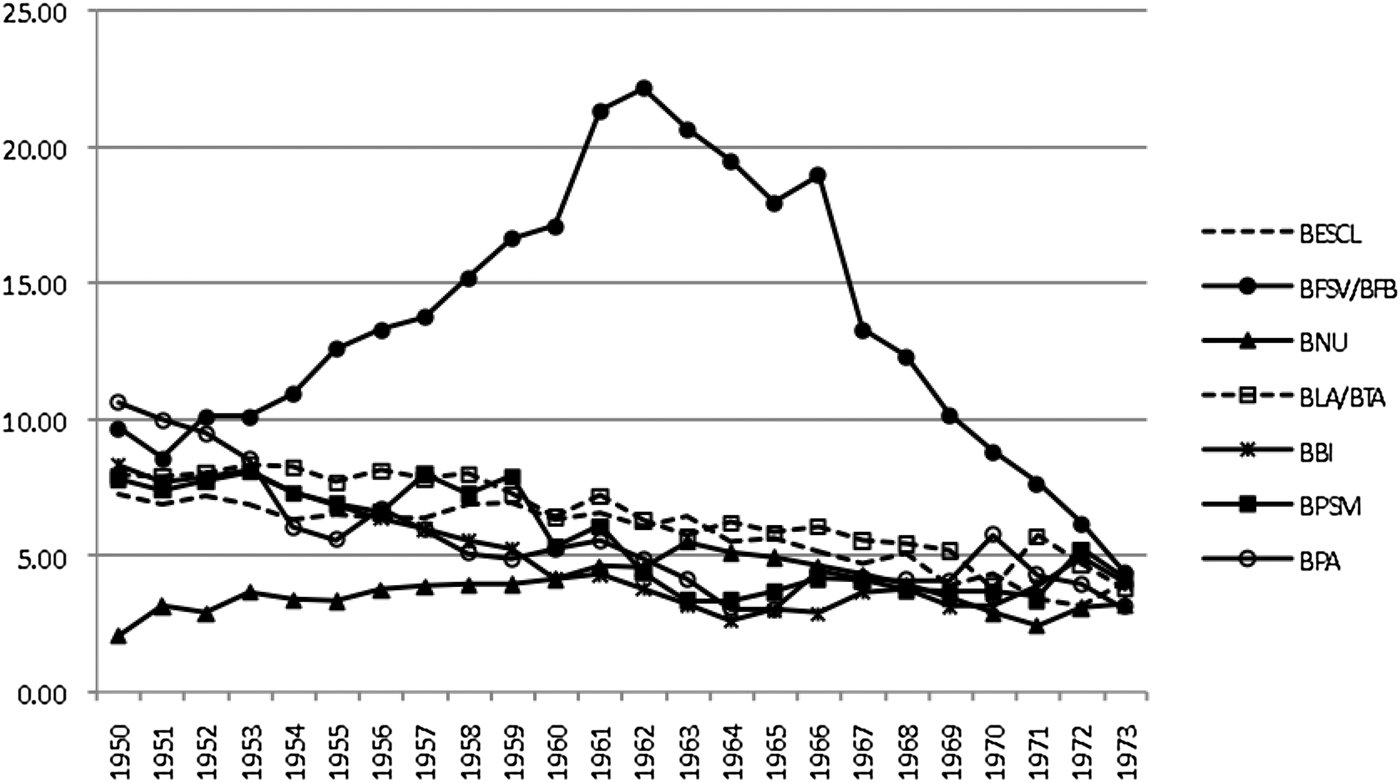
The idea of lack of competitive behaviour of Portuguese banks in this period may be questioned by still other data, such as the banks' capital ratios. Note that the legislation of the time did not establish proportional limits, but rather absolute amounts (see Section I and Table 1). When we look into the capital–assets ratios of the banks under analysis, they reveal increasingly higher leverage (Figure 9). Well capitalised in 1950 (in a range between 7.5 and 11 per cent of their assets, if we exclude BNU), their capital ratios fell steadily throughout the period, so that by 1973 all of them had ratios below 5 per cent (between 3 and 4.8 per cent).
Capital–assets ratio (seven largest commercial banks), 1950–73 (%)
The only exceptions to the generalised pattern shown in Figure 9 are BNU and BFSV/BFB. BNU was consistent in having the lowest capital ratio of all banks, something most probably explainable by its ‘advantage’ as a semi-public institution. Such status, implying the impossibility of bankruptcy, meant that it did not need to show any special solidity in order to be trustworthy to customers. BFSV represents the almost opposite case: being a unit bank unwilling to expand geographically when all other banks were entering the race (Câmara Reference Câmara1985), it preferred to invest in solidity, setting it apart from the remaining banks in this respect. The more the competitors expanded geographically, the more BFSV had to increase its capital, to retain and attract depositors. As we will see next, this had very serious implications for profitability and ultimately forced the bank to change strategy, when it merged with BB. From that moment on the bank's capital ratio converged quickly to the general pattern. If we disregard BFSV, the capital ratios of Portuguese banks did not set them apart in international terms (Table 5).
Profitability
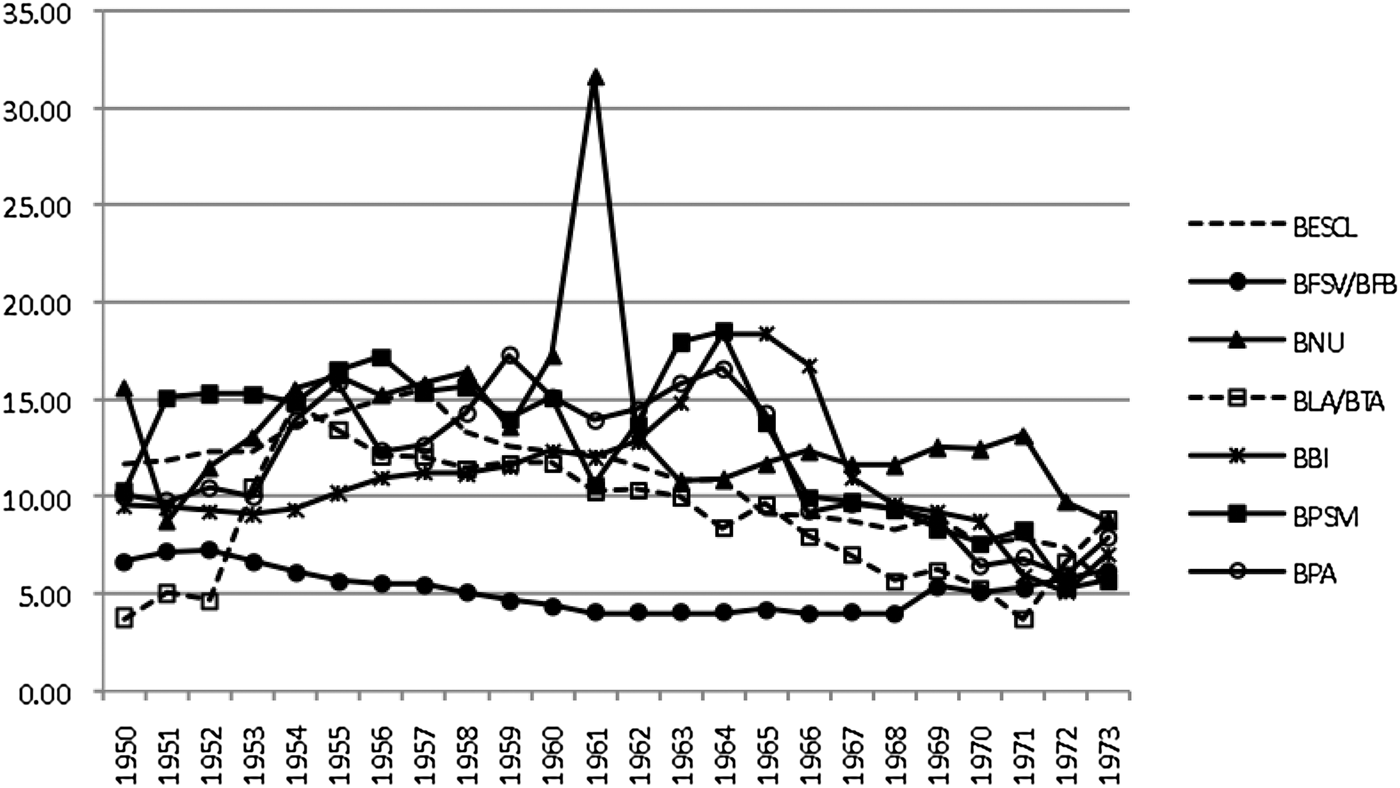
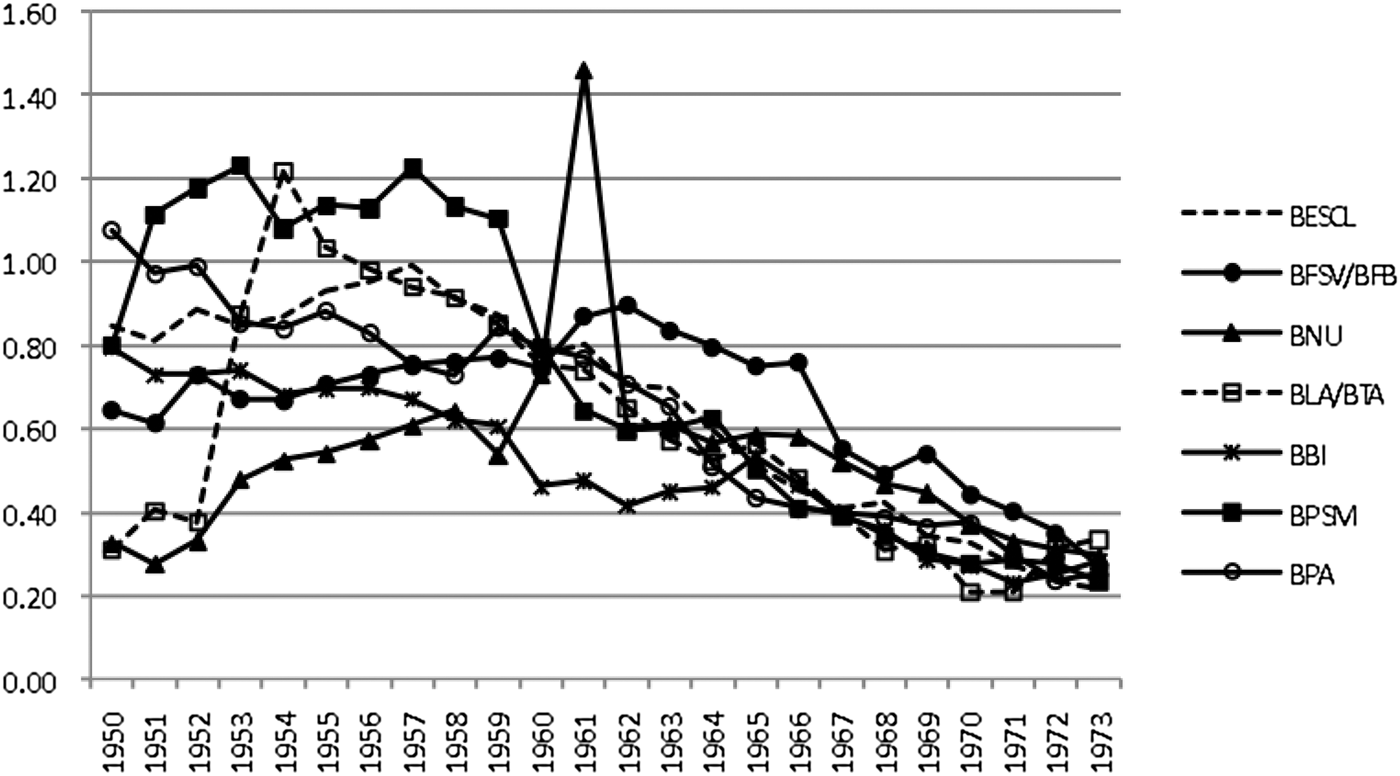
The argument over the excessively protected environment of Portuguese banking rests ultimately on the issue of profitability. The figures for the return on equity (ROE) of the seven largest commercial banks presented in Figure 10 are the published after-tax profits calculated as a ratio of equity and reserve funds (×100). When we compare them with what we know from other countries (Table 6), they do not stand out as being particularly high – quite the contrary. The exception is, again, BFSV, with its very low record, something mostly explainable by the high capital ratios it had as a consequence of its unit-bank strategy. A visible feature of ROE of Portuguese banks is its decline during the 1960s, coinciding with the rush for branches and deposits, thus suggesting that more competition led to the squeezing of the banks' profit margins. If, in 1965, ROE of Portuguese banks ranged more towards the high end of the international spectrum, the opposite occurred in 1973 (Table 6). Figures for return on assets (ROA) in Figure 11 provide an even clearer picture of the connection between profits and a higher cost structure. These figures show two movements: on the one hand, convergence between, and on the other, consistent decline of ROA of the various banks, both taking place essentially in the 1960s. The international comparison in Table 7 shows again that the behaviour of Portuguese banks was not unlike that of banks in other countries.
Return on equity (seven largest commercial banks), 1950–73 (%)
Return on assets (seven largest commercial banks), 1950–73 (%)
Return on equity, Portugal and various countries (commercial banks), 1965–73 (%)
*1966
**1968
***1971
Notes: Australia – trading banks; Canada – chartered banks; Denmark, Finland, France and Italy – all banks; USA – FDIC insured; all other countries – commercial banks
Source: see Table 5.
Return on assets, Portugal and various countries (commercial banks), 1965–73
*1967
**1966
***1968
Notes: Australia – trading banks; Canada – chartered banks; Denmark, Finland and France – all banks; USA – FDIC insured; all other countries – commercial banks.
Sources: see Table 5.
These figures raise a few questions, as they appear to be excessively low for a somewhat underdeveloped financial system such as Portugal's. Some caveats are in order here. Despite their importance, the truth is that accurate data on profitability are, in general, very difficult to obtain, as accounting standards and practices in different countries allow for much imprecision. Capie and Billings (Reference Capie and Billings2001), for instance, have revealed the considerable extent to which the reported profits of the English clearing banks in the twentieth century differed from true ones. The main source of divergence was the unreported (publicly, although reported secretly) ‘hidden reserves’. Capie and Billings (Reference Capie and Billings2001) could only establish the importance of these reserves thanks to a reconstruction of the banks' profits-and-loss accounts based on unpublished data from the banks' archives. This is something we cannot provide at this stage for Portuguese commercial banks. As a result, we must simply rely on published data. When other information from unpublished archival material becomes available it will be possible to compare it with our figures.
Thus, the possibility exists that the profit rates just reported are not the ‘true’ ones. But another way of interpreting them is to suggest that they might reflect lower opportunities for banks to find profitable operations, thanks to the restrictive legal environment. The banks' financial margins were almost entirely set by the government in an administrative way, and alternative assets (such as stocks and bonds) could only be used residually. As increased competition led to higher costs related to the efforts to attract depositors (higher interest paid on time deposits, lower interest asked on loans, and higher real estate and personnel costs in new branches), perhaps the recorded low profitability was just a reflection of the fact that little room was left for banks to increase their margins.
Even if these figures will in time be revised by later findings of unpublished data in banks' archives, they raise doubts about the idea common in the literature that Portuguese banks were granted ‘excess profits’ by the existing institutional environment. But these are topics requiring much more detailed study in the future.
IV
We have shown in this article that despite the legal restrictions of the period 1950–73, Portuguese commercial banks found various ways of competing with each other. This raises doubts about the idea, common in the literature, that they lived in a ‘cosy’ environment based on ‘rents’ and ‘excess profits’. The picture we have drawn here is, nevertheless, essentially an impressionistic one. Any agenda for future research needs to go beyond this and provide more formal tests of the degree of competition. A test of the Panzar and Rosse (Reference Panzar and Rosse1987) type is already under preparation. But other topics are also worth attention: we have seen that much of the evolution of Portuguese banks in this period depended on discretionary measures of the government, such as entry in the market, the opening of branches, and the establishment of interest rates. Future work should analyse the political economy dimension present in the relationship between government and banks. A thorough study of the structure of credit is also needed. The banks' published accounts do not allow for detail in this respect. Knowledge of their actual credit policy will have to rely on yet unpublished material lying in the banks' historical archives, although we cannot be sure right now of the existence of relevant data in such unpublished material. The current article has opened the way for a better understanding of the Portuguese financial system in the crucial period of the golden age, but much work remains to be done.