Introduction
Footrot is an endemic disease of sheep which costs the British sheep industry an estimated £24 M annually (Nieuwhof and Bishop, Reference Nieuwhof and Bishop2005). The disease is caused by bacteria, Dichelobacter nodosus, that can survive outside sheep hooves for only a limited time (Egerton, Reference Egerton2000), with prevalences being higher under damper conditions.
Differences between breeds in resistance to footrot have been reported in Australia and the US. Emery et al. (Reference Emery, Stewart and Clark1984) found that British breeds were more resistant than Merinos under a moderate challenge on pasture (as expressed in lower severity, rather than fewer feet affected), but not when cultures of D. nodosus were applied directly to each hoof. Burke and Parker (Reference Burke and Parker2007) found breed differences among various hair breeds, hair breed crosses and Dorset sheep in the number of locations on a hoof affected by footrot and odour but not footrot severity (or ‘score’) or consequential culling.
Comparing offspring from different Targhee rams, Bulgin et al. (Reference Bulgin, Lincoln, Parker, South, Dahmen and Lane1988) concluded that susceptibility to footrot is heritable, without presenting a heritability estimate. In a lamb population with a prevalence of footrot ranging from 1% to 34% in females and 31% to 57% in males, Skerman et al. (Reference Skerman, Johnson, Kane and Clarke1988) calculated a heritability of 0.17 on the underlying scale for the binary trait (i.e. presence or absence of footrot) in Romney lambs of 8 to 9 months of age. In the same dataset, the heritability of ‘overall score’, an assessment of footrot severity on a continuous scale, was 0.14. The heritability estimated in an offspring–dam regression for the binary trait scored at about the same time was similar (0.12), suggesting that the trait in lambs of this age and ewes are genetically similar.
Raadsma et al. (Reference Raadsma, Egerton, Wood, Kristo and Nicholas1994) reported that in deliberately infected Merino sheep of 10 to 21 months of age, the heritability for susceptibility to footrot can be as high as 0.3 when using the average of repeated measurements. The highest heritabilities were found if footrot was analysed as a binary trait, i.e. presence or absence of footrot, or severe footrot, and using a threshold model. In the study of Raadsma et al. (Reference Raadsma, Egerton, Wood, Kristo and Nicholas1994), in which vaccination interventions were used, the repeatability of footrot scores was moderately high pre-vaccination (when prevalence was over 50%), but much lower post-vaccination (when prevalence was lower). The genetic correlation between successive cases of footrot after re-infection ranged from 0.14 to 0.95, with an average of 0.67, suggesting that some different genes are involved in response to subsequent cases of footrot.
The potential to decrease the prevalence of footrot in Great Britain through selective breeding depends on a number of factors, including the heritability of resistance to the prevailing strains and the effect of the British climate on the bacteria. It may also depend on breed of sheep and age. A practical breeding programme requires a measure that can be readily applied to large numbers of sheep on commercial farms. Because of the complexity of diagnosis of footrot, this study investigated lesion score as defined by Egerton and Roberts (Reference Egerton and Roberts1971) and applied by Raadsma et al. (Reference Raadsma, Egerton, Wood, Kristo and Nicholas1994). The effectiveness of a selection programme may be increased by repeated scoring of animals, which would be especially beneficial if the indicator traits were found to have a low repeatability. The aim of this study is to determine the heritability and repeatability of lesion scores in two breeds of sheep and at different ages, and to assess whether or not breeding for resistance to footrot is a credible option for British sheep breeders. The study follows a snapshot approach, in which all animals are measured simultaneously but little is known about the disease history of individual animals. This approach reflects the practical situation in the field and the conditions under which a commercial selection programme would operate.
Material and methods
Animals
This study included two populations of sheep; Scottish Blackface (SBF) and mules, i.e. the female progeny of longwool breed sires and hill ewes. In 2005, SBF ewes and their lambs in two commercially managed SAC flocks were scored for footrot. Details of the structure of these flocks are described in Conington et al. (Reference Conington, Bishop, Lambe, Bunger and Simm2006). In 2006, ewes in the same two flocks, as well as ewes in three commercial SBF flocks were scored, including 330 animals that had been scored as lambs in the previous year. All five flocks are members of the Scottish Blackface Sire Reference Scheme (http://www.bfelite.co.uk/) and genetic links exist among them. Six generations of pedigree were used in subsequent statistical analyses, as well as routinely collected data on date of birth, farm, management group, sex, litter size and, for lambs, live weight at about 20 weeks.
The mules were from a population that had been created to investigate the effects of selection in purebred longwool rams on crossbred offspring. A total of 45 Blue Faced Leicester rams were crossed with 750 SBF ewes and 750 Hardy Speckled Face over 3 years. The animals were kept on three farms in different parts of the country and recorded for maternal traits. In 2005, when they were first scored for footrot, they varied in age from 5 to 7 years, and they were scored again in 2006. Details on these flocks are given by Van Heelsum et al. (Reference Van Heelsum, Lewis, Davis and Haresign2006).
Scoring
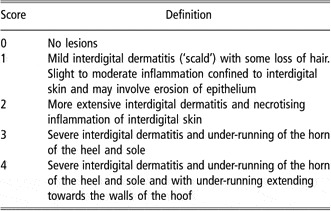
The scoring system described by Egerton and Roberts (Reference Egerton and Roberts1971) was implemented as described in detail by Conington et al. (2008) and summarised in Table 1. Animals were inspected and awarded a score of 0 (healthy) to 4 (severe footrot) for each hoof, where a score of 1 may indicate scald or early stage footrot. Animals that appeared to be affected by footrot or any other disease at scoring were promptly treated with antibiotic spray and pared where required.
Scoring system used in this study, each hoof is scored individually (from Conington et al., 2008)

The SBF ewes were scored once in each year, between 26 July and 17 October in 2005 and 2006. Lambs were born in April, weaned in mid-August and were scored on 26 September or 18 November 2005. The mules were scored twice in both years, with the first score between 24 July and 14 September and the second one between 13 September and 20 October, with 30 to 80 days between successive scores on the same animal. There were a total of four scorers, two of whom scored in both years. Generally, sheep in the same management group were scored on the same day or 2 consecutive days. On the occasions when scoring of a management group spanned a longer period of time, the group was split accordingly for the purpose of the analysis.
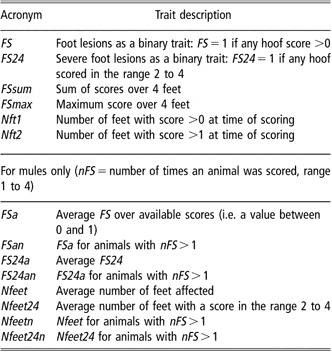
Various traits were derived from the hoof scores, which are explained in detail in Table 2. For mules, an additional set of traits was defined to include scores on the same sheep at different times (Table 2).
Foot lesion traits derived from raw scores

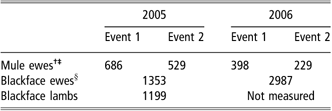
Table 3 gives an overview of the numbers of animals scored at various times. Amongst the mule ewes, there were 389 second scores following a first score of no footrot, comprising 319 ewes. A total of 7381 animals were in the SBF pedigree, and 8356 ewes were in the mule pedigree.
Numbers of foot lesion score observations
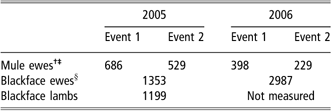
†498 ewes were scored twice in 2005 and 217 were scored twice in 2006.
‡Across both years, 710 ewes had a first score and 537 a second score.
§1071 ewes were scored twice.
Statistical analysis
For SBF, footrot score data were linked to performance and pedigree records held by Meat and Livestock Commission’s Signet breeding services and each derived footrot trait on a ewe was analysed in three ways, based on different datasets:
(A) Repeated measures over time of the same trait on a ewe (1 or 2 observations per animal).
(B) Traits measured in 2005 and 2006 treated as separate traits.
(C) Repeated measures of the same trait on each of the four hooves of a ewe and over time (4 or 8 observations per animal).
Further, scores on lambs were analysed as:
(D) Measures on lambs, one observation per animal.
For mules, footrot traits were analysed as follows:
(E) Repeated measures over time of the same trait on an animal (up to 4 observations per animal).
(F) Each scoring event treated as a separate trait.
(G) As F but with censored traits; second scores valid only if no footrot was observed at the first score within each year.
Method G was used because second scores may be affected by earlier cases of footrot, especially when animals were treated for footrot after the first score.
After initial investigation with the generalised linear model procedure of SAS (1989), an appropriate statistical model was determined by stepwise elimination of non-significant interactions and main effects using ASReml (Gilmour et al., Reference Gilmour, Cullis, Welham and Thompson2002) with an animal model for all traits, as well as a sire model with logit link function for univariate analysis of binary traits. The results presented are based on the model that contains all significant (P < 0.05) main effects and interactions for that dataset.
Based on this analysis, the standard model used for genetic analysis of SBF ewes (sets A, B and C) was:

where Yijklmn = footrot trait measured on animal m, groupi = management group within flock, scorerj = scorer (j = 1 to 4), agek = age at scoring in years, with 6, 7 and 8 years considered as one class, lsrl = litter size reared by the ewe in the year of scoring, l = 0, 1, ⩾2 and Am = additive genetic effect of animal m or its sire.
In some datasets, additional effects were of significant size and included:

where animal_envm = permanent environmental (i.e. non-genetic) effect associated with animal m, footo = permanent environmental effect of the foot.
Note that management group is different for each scoring event, so that no separate effect for scoring event is required.
For lambs (set D) the model was:

where b 1 = regression of footrot on age (age in days), b 2 = regression of footrot on scan weight and swt = scan weight (weight at approximately 20 weeks of age).
For the mules the following models were used:Dataset E:

where Yijklm = footrot trait measured on animal l, yeari = year of birth, groupj = management group within flock, scorerk = scorer and animall = additive genetic effect of the animal.
And datasets F, G:

where scorem = scoring event (m = 1,2 or m = 1 to 4 depending on the dataset).
The analysis of the additional persistency scores was based on the model used for dataset E with an extra fixed effect for the number of scoring events the trait was based on.
In mules, for some of the multivariate analyses of traits scored at different points in time, parameter estimates approached the boundaries of the parameter space and did not converge. In these instances, genetic and residual variances were fixed at the values obtained from univariate analysis. Consequently, standard errors of heritabilities and genetic correlations could not be estimated.
Results
Data summary
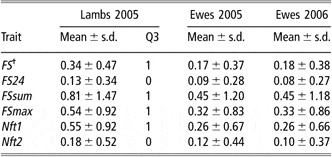
Table 4 shows the distribution of the foot lesion scores in SBF. The averages for FS and FS24 are the presumed prevalence of footrot and severe footrot, respectively, bearing in mind that individual animal diagnoses of footrot were not made. More lambs than ewes were affected, and the infection in lambs appeared to be more severe in terms of scores and number of feet involved. There was very little difference in mean scores between the two years for ewes. Because foot lesion scores were skewed to the right, log transformed values of FSsum and FSmax were included in the analyses, but this had no noticeable effect on results and is not reported here.
Mean, standard deviation (s.d.) and third quartile (Q3) for derived foot lesion score traits in SBF lambs and ewes§

†Acronyms are explained in Table 2.
§For lambs all first quartiles and medians are 0; for ewes all first quartiles, medians and third quartiles are 0 in both years.
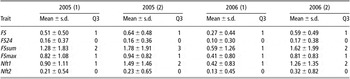
The average prevalence of foot lesion scores in mules (i.e. FS > 0) was 51%, ranging from 27% in 2006 (1) to 64% in 2005 (2) (Table 5), and from 42% in one flock to 59% in another. The average raw score on a foot basis over the four events showed no significant differences between feet and ranged from 0.32 (s.d. 0.65) for the left hind foot to 0.34 (0.65) for the left front foot, and was only marginally higher for front feet (0.337) than rear feet (0.322).
Mean, standard deviation (s.d.) and third quartile (Q3) for derived foot lesion score traits in mules at the different scoring events†

†First quartile is equal to 0 for all traits at all events, median is 1 for Q3 > 0, and 0 otherwise.
Heritability of foot lesion scores in ewes
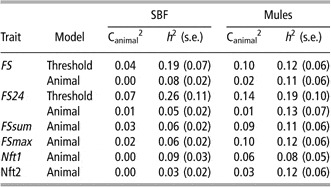
Estimates of genetic parameters based on the assumption that subsequent foot lesion scores are expressions of the same trait are given in Table 6 for SBF ewes in the two consecutive years (dataset A) and also for mules for up to four scores in 2 years (dataset E). Estimates for the heritabilities of FS and FS24 in a threshold sire model were low to moderate (i.e. less than 0.3), and all other traits showed a smaller genetic component. In SBF, the permanent (i.e. non-genetic) animal effect was close to 0, and the repeatability (i.e. the sum of the heritability and the permanent animal effect) ranged from 0.03 to 0.33. In mules, heritabilities ranged from 0.08 to 0.19, with the permanent environmental animal effect being slightly lower, resulting in repeatabilities ranging from 0.13 to 0.33.
Estimates of permanent animal effect and heritability (standard error, s.e.) in datasets A (SBF) and E (mules), depending on model (threshold sire or animal)

Based on datasets B and F, Table 7 shows that the heritability for FS was reasonably constant over various scoring events, varying from 0.10 to 0.26 in the two populations, but for FS24 the range was much larger; 0 to 0.61. For the other traits heritabilities were low to moderate, although they did vary across time.
Heritabilities (standard errors, s.e.) for ewe traits measured in SBF in 2005 and 2006 (dataset B) and successive scores in mules (dataset F). FS and FS24 based on threshold sire model, other traits from animal model

A trend emerged from close scrutiny of the SBF flocks analysed, showing a relationship between flock-level prevalence of lesions and heritability, whether estimated using an animal model or a sire threshold model. In 2006, in the two flocks with highest prevalence of lesions, average prevalence was 0.30 and in the three flocks with lowest prevalence it was 0.10. In these two groups, threshold model heritabilities for FS were estimated as 0.36 (0.14) and 0.06 (0.13), respectively, with similar differences for sire and animal models, while estimates for FSsum and FSmax were similar to each other and to estimates based on all five flocks.
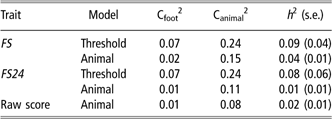
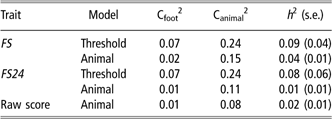
Comparing analyses at the level of the hoof rather than an animal in SBF (dataset C), lower estimates of heritabilities were obtained than at the level of the animal. However, permanent environmental animal effects were slightly higher (Table 8).
Estimates of variance components on a per foot basis in SBF ewes (dataset C) and depending on model. Standard error (s.e.) of heritabilities in brackets
Correlations between successive scores
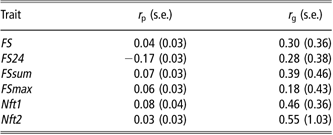
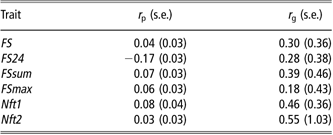
Table 9 shows that the genetic correlations between the same trait in SBF in the two years are far from unity, albeit with large standard errors. The phenotypic correlations are close to 0 or negative.
Estimates from the animal model of correlations (standard errors, s.e.) between SBF ewe traits measured in 2005 and 2006 (dataset B)
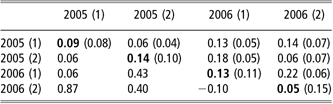
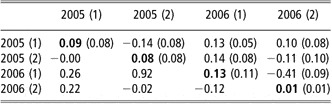
Multivariate analyses of FS in mules, using an animal model (Tables 10 and 11), revealed phenotypic correlations close to 0 and a large range of genetic correlations. There was no indication that adjacent scores were more strongly genetically correlated, or that a first (or second) score in a year had a higher genetic correlation with the first (or second) score in the other year. Removal of animals affected (and treated) at the first scoring from the second scoring in the same year (dataset G) resulted in a large increase in the estimates of genetic correlations between 2005 (2) and 2006 (1), but an opposite effect was found for the correlation between 2005 (1) and 2006 (2).
Multivariate analysis of FS in mules (dataset F) in an animal model. Heritabilities on, phenotypic above and genetic correlations below diagonal. Genetic variances, heritabilities and their standard errors based on univariate analyses
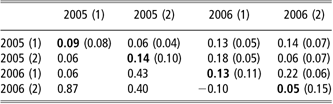
Multivariate analysis of FS in mules excluding second scores where the first score was not 0 (dataset G). Heritabilities on, phenotypic above and genetic correlations below diagonal. Genetic variances, heritabilities and their standard errors based on univariate analyses

The univariate animal model estimates for heritabilities for FS24 in 2005 (1) through to 2006 (2) were 0.01, 0, 0 and 0.25, therefore multivariate genetic analyses of these traits are not meaningful.
Genetic analysis of persistency in mules
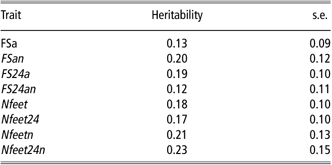
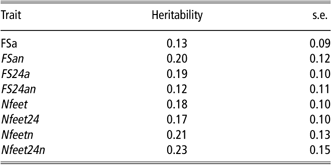
Estimates of the heritability for various traits that combine scores from successive observations in mules, shown in Table 12, were generally higher than heritability estimates based on only one score.
Heritabilities and standard errors (s.e.) for traits describing average scores over time in mules
Footrot in SBF lambs
The risk of foot lesion scores of 1 or more increases with higher weight at scanning (around 20 weeks of age) and, to a lesser extent with lower age, indicating that faster growing animals are most at risk. In a model without the age effect, the relative risk of FS and FS24 increased at a rate of 0.12 and 0.08 per kg live weight, respectively (P < 0.05 in both cases). There was no effect of the size of the litter in which an animal was raised.
All heritability estimates for footrot traits in SBF lambs were 0. Residual correlations between lamb and ewe traits were estimated on the 330 animals with observations in both classes, and ranged from −0.08 to 0.01.
Discussion
In this study, the heritability and repeatability of lesion scores in two populations of ewes and in lambs were investigated. While for the latter all estimates of heritability were 0, some medium heritabilities were found in ewes, especially when footrot or severe footrot was defined as a binary character and analysed using a threshold model, or when more than one measurement was taken on an animal. Repeatabilities were generally little higher than heritabilities, which is in line with low phenotypic correlations between successive scores on the same animal. As a result, heritabilities for traits increase if information from successive scores is combined.
Published estimates of the prevalence of footrot in ewes of about 6% (GrogonoThomas et al., Reference GrogonoThomas, Cook and Johnston1998; Wassink and Green, Reference Wassink and Green2001; Clements et al., Reference Clements, Mellor and Fitzpatrick2002) are based on farmer surveys, and rely on farmers’ opinions or observations of lame sheep, rather than clinical examinations of hooves from upturned animals, as reported in this study. The prevalence of severe lesions in this study (i.e. scores 2 to 4) ranged from 9% to 15% in SBF ewes and mules. Although these figures may not be directly comparable, they are of a similar magnitude. Apart from differences in observation methods, there are effects of breeds and environments, including the time of year. In this study, animals were all scored in summer and autumn when warm and damp conditions favour spread of footrot more than in other times of the year. The low repeatability of scores, even within the same year, highlights the high sensitivity to time and frequency of scoring for the identification of susceptible animals.
Although scorers were trained by the same person, the analysis found significant effects of the scorer and scorer by group effects for most traits as well as additional interactions of scorer (with litter size and age) for a number of traits. This means that any genetic improvement programme that includes foot scoring to predict genetic susceptibility to footrot should identify the scorer and attempt to use the same personnel across several flocks to avoid confounding with flock. It should be noted that the management group effect is confounded with the score date (with a group only scored on 1 or 2 successive days), so that the scorer by group effect may partly be a time effect. The repeatability of scorers has been investigated in a separate analysis (Conington et al., 2008) showing high consistency between scorers and between subsequent scores by the same scorer on the same day.
Lesion prevalence did not differ between feet, which is in line with conclusions from Parker et al. (Reference Parker, Cross and Hamilton1985) who found an apparently insignificant small difference in prevalence between front and rear hooves and Raadsma et al. (Reference Raadsma, Egerton, Nicholas and Brown1993) who found no difference in prevalence of footrot among the four feet.
The estimate of the heritability of lesions scores in SBF lamb was 0, for all traits defined. To test whether or not this result was an artefact of the data structure, the heritability of weaning weight for the same lamb population was estimated. The resulting estimate of 0.35 does not support the suggestion that the footrot results may be an artefact the data structure. The zero heritability contrasts with results for footrot presented by Skerman et al. (Reference Skerman, Johnson, Kane and Clarke1988) and Raadsma et al. (Reference Raadsma, Egerton, Wood, Kristo and Nicholas1994) who found low to medium heritabilities in lambs, although the lambs in these two studies were older, i.e. 8 to 10 months at the start of trial, than in the current study where they were an average of 5 months at time of scoring. If genetic variation in footrot is a function of acquired immune responses to infection, it may be possible that lambs in this study were simply too young or had had insufficient exposure to footrot-causing bacteria for genetic differences between animals to be apparent.
Within the current study there was a trend for heritabilities for the binary trait FS to increase with increasing prevalence. Such an effect can be expected in a linear analysis, where variances depend on the mean, but it also existed in the threshold models. However, a simple biological reason may be hypothesised: certain genes that affect resistance to footrot, and hence the development of lesions, are possibly not expressed at low infection pressures, hence at a low prevalence. This, if correct, would also explain the difference in estimated heritabilities in lambs between the current study and that by Skerman et al. (Reference Skerman, Johnson, Kane and Clarke1988) and Raadsma et al. (Reference Raadsma, Egerton, Wood, Kristo and Nicholas1994), in which animals were deliberately infected and the resulting prevalences were as high as 57% (Skerman et al., Reference Skerman, Johnson, Kane and Clarke1988) and over 50% and 80%, respectively, in two trials pre-vaccination (calculated from data used in Raadsma et al., Reference Raadsma, Egerton, Wood, Kristo and Nicholas1994).
Even in ewes where heritable variation in lesion scores was seen, low phenotypic and genetic correlations between subsequent scores were observed in this study, and similarly low correlations were also found by Raadsma et al. (Reference Raadsma, Egerton, Wood, Kristo and Nicholas1994). This may be the result of various factors including the strain of D. nodosus involved, the prevailing weather, prevalence of footrot and build up of acquired resistance in animals following successive challenges or as they age. Given this range of possible influences, it is encouraging that genetic correlations were positive, although it would be useful to have a better insight in the reasons for the low genetic correlations.
In this study, we considered populations of ewes from two different genetic backgrounds. Although differences in heritability estimates for lesion scores were found across the breeds, these estimates do not differ greatly from each other or from previously published values for resistance to footrot. In SBF, the heritability for foot lesions was estimated to be 0.19 and in mules 0.12, this is comparable to 0.16 and 0.31 estimated by Raadsma et al. (Reference Raadsma, Egerton, Wood, Kristo and Nicholas1994) in Merino lambs and 0.28 for Romney (Skerman et al., Reference Skerman, Johnson, Kane and Clarke1988, trait defined as footrot or scald), especially when taking into account the effect of prevalence. The respective figures for severe lesions are SBF 0.26, mules 0.19, Merino (1), 0.21, Merino (2) 0.16 and Romney 0.17 (footrot only). The heritabilities for the number of feet affected or severely affected in SBF (0.09, 0.03) and mules (0.08, 0.12) are close to estimates by Raadsma et al. (Reference Raadsma, Egerton, Wood, Kristo and Nicholas1994; 0.09 to 0.14).
Estimation of heritabilities relies on the assumption that similarities among relatives are due to genetic and not environmental effects, unless environmental covariances between relatives (e.g. litter effects) are specifically fitted. The data structure in the current study comprised mainly half sibs (with no parent–offspring pairs being scored); however, additional pedigree relationships will be accounted for when an animal model is used, as such relationships are included in the relationship matrix. The threshold model required use of a sire model, so that a risk of overestimation of genetic effects existed. In this context, the highest risk of overestimating genetic effects existed for the scores in lambs where full sibs were raised as littermates; littermates share the same micro-environment and any protection provided by their mother, even after weaning when the lambs were scored. However, it was verified that in these data the litter effect was non-significant and since the estimates for the genetic variance for lamb traits were all 0, these were clearly not overestimated.
From a practical perspective, this study shows that because certain footrot scores are estimated to have a medium heritability, it is possible to increase resistance to footrot in ewes through selective breeding. However, since the heritability of footrot in lambs is estimated to be 0, selection in lambs is not expected to lead to any progress, nor will selection in ewes lead to any direct genetic effect in lambs (but there may be an effect of more resistant ewes lowering the pathogen challenge faced by lambs).
The results indicate that the foot scoring of sheep does not need to be comprehensive, with a simple binary trait indicating lesions (or not) or severe lesions (or not), depending on the breeding goal and prevalence, being at least as effective as scoring individual feet on a 0 to 4 scale. Importantly, because of the medium to low heritability and repeatability of the footrot score, the use of repeated observations on the same animal is recommended. Care should be taken that animals have a similar history of footrot within the season, and scoring may therefore best be undertaken at the earliest period of high prevalence within a season. Further, the between-flock comparisons in this study suggest that the heritability of resistance to footrot depends on the prevalence, with heritabilities being higher at higher prevalence. This means that selection will be more effective in those flocks with higher levels of footrot.
In practice, with differences in heritabilities depending on prevalence and time, as well as low repeatability, selection for resistance to footrot across flocks and within a commercial setting (i.e. with limited recording) may be complex. Therefore, the development of effective genetic markers for resistance to footrot would be very useful to the industry to complement conventional breeding.
Acknowledgements
The authors wish to thank SAC technicians Laura Nicoll, Claire Brockie, Kirsty McLean and John Gordon for their technical help, and Ron Lewis and Mervyn Davies for access to the longwool flocks and data. This study was funded by Defra, the Scottish Government, Eblex, HCC, QMS and Innovis, through LINK Sustainable Livestock Production.