Introduction
With the end of nearly 70 years of socialism, Mongolia experienced striking changes in its period fertility rates. The total fertility rate (TFR) dropped from 4.57 children per woman in 1989 just before the transition to democracy and market economy to 2.53 in 1993 and reached 1.95 children per woman in 2005 (National Statistical Office of Mongolia & UNFPA, 2004, p. 45; 2006, p. 78). This decline, as impressive it is (the TFR reduced by 44.7% over five years between 1989 and 1993), received only limited analysis in the demographic literature (Neupert, Reference Neupert1994, Reference Neupert1996; Aassve & Gereltuya, Reference Aassve and Gereltuya2002; Gereltuya et al., Reference Gereltuya, Falkingham and Brown2007; Gereltuya, Reference Gereltuya2008). These studies have linked the dramatic recent fertility decline to the economic and social transition that took place in the early 1990s. The dislocation of the centrally planned economy and the transition to democracy and market economy in Mongolia gave couples a feeling of insecurity and uncertainty about the future. Facing a complete redefinition of their daily life (economic and financial difficulties, but also sudden openness of society), people changed and adapted their fertility behaviour to the new circumstances (Spoorenberg, in press). However, these studies have also shown that the fertility decline should not be seen solely as the byproduct of the transition. Indeed, the onset of fertility decline arose during the 1970s and seems to coincide with the relaxation of the pro-natalist policy. The transition to democracy and market economy in 1990 acted more as a catalyst for the ongoing fertility changes.
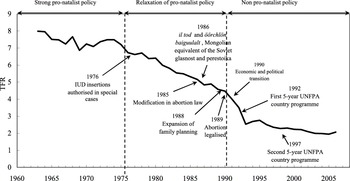
As in most socialist countries, population was considered a central variable in the planning and development of the Mongolian economy. However, it was only with the third Five-Year Plan (1961–65) that official and explicit pro-natalist policies were implemented in Mongolia. Child, maternal and couple allowances were allocated to support and promote fertility and large families. At the same time, contraception, sterilization and abortion were prohibited or restricted only to medical cases. As a result, with 7–8 children per woman in the 1960s to early 1970s, Mongolian fertility was high. Whether the fertility and family supports and incentives have maintained fertility at artificially high levels is hard to assess. But the simultaneity between the relaxation of the pro-natalist policy and the onset of fertility decline partly gives confidence in such consideration (Fig. 1). The onset of fertility decline can also be attributed to the more classic model of the demographic transition postulating a ‘reproductive’ adjustment in response to the earlier mortality decline. In Mongolia, mortality transition started at the end of the 1940s; 30 years later, in the 1970s, the onset of fertility decline can thus be considered a response to this initial mortality ‘perturbation’ in the demographic system. There is, however, no space here to discuss such issues.
Period total fertility rate (TFR) and population policy in Mongolia, 1963–2006. Figure adapted from Gereltuya et al., Reference Gereltuya, Falkingham and Brown2007. Sources: Neupert, Reference Neupert1994; National Statistical Office of Mongolia, 2006.

Starting in 1976 and lasting until the end of 1989, all restrictions on abortion and contraceptive access, use, distribution and importation were progressively removed (for a more detailed account of the pro-natalist policy and its relaxation in Mongolia, see Neupert, Reference Neupert1996; National Centre for Health Development of Mongolia & UNFPA, 2001; Gereltuya et al., Reference Gereltuya, Falkingham and Brown2007; Gereltuya, Reference Gereltuya2008). In the relaxation of the pro-natalist policy, the openness (il tod – Mongolian glasnost) and restructuration (őőrchlőn baiguulalt – Mongolian perestroika) launched at the 19th Party Congress of the Mongol Ardyn Huv'sgalt Nam (the Mongolian People's Revolutionary Party) in 1986 certainly contributed to relaxing further the restrictions on access to, and use of, contraceptives and abortion. Since 1992, with the first 5-year programme of the United Nations Population Fund (UNFPA) in Mongolia, contraceptive means were largely diffused throughout the country. As a result, in 1994, 25% of women of reproductive age used a contraceptive method against 11% 4 years earlier in 1990 (Neupert, Reference Neupert1996, p. 41; Pandey, Reference Pandey1997). Moreover, since 1997 and the second 5-year UNFPA programme in Mongolia, all women have free access to any contraceptive means through the local official reproductive health centres. The contraceptive prevalence rate among women of reproductive age reached 33.4% in 1998 and 45.3% in 2003 (National Statistical Office of Mongolia & UNFPA, 1999, 2004).
Previous studies (Neupert, Reference Neupert1993, Reference Neupert1994, Reference Neupert1996) have shown that among the classic intermediate fertility variables (female proportion married, use of contraception, induced abortion and postpartum infecundability), induced abortion has played a major role in Mongolian fertility decline. Whereas abortion is usually used to postpone childbearing in the majority of countries, it has been practised for spacing and stopping childbearing in Mongolia (Neupert, Reference Neupert1996; Pandey, Reference Pandey2002; Rak & Janes, Reference Rak and Janes2004). Mongolian women considered and made use of abortion more as a primary fertility regulation method than as the ultimate solution to contraceptive failure. The low reliability of modern contraceptive methods developed and provided throughout the USSR (even if Mongolia was never a member of the USSR, but a privileged partner/satellite), coupled with the restriction on access to contraceptive methods (the use of oral contraceptives was prohibited in the Soviet Union in 1974; already in 1969 in Mongolia (Neupert Reference Neupert1994, p. 18)), played an important role in the use of abortion as a contraceptive method both in Mongolia and in the Soviet Union (Popov, Reference Popov1991; Popov et al., Reference Popov, Visser and Ketting1993; Avdeev, Reference Avdeev, Lutz, Scherbov and Volkov1994; Pandey, Reference Pandey2002). Despite recognition of the importance of abortion as a contraceptive method in Mongolia (Neupert, Reference Neupert1996; Pandey, Reference Pandey2002; Gereltuya et al., Reference Gereltuya, Falkingham and Brown2007; Gereltuya, Reference Gereltuya2008), the evolution of its contribution to Mongolian fertility decline, as well as the other proximate determinants of fertility, has not been formally evaluated. Neupert (Reference Neupert1993, Reference Neupert1994) discussed the proximate determinants of fertility and their changes between 1970 and 1990 in Mongolia, but does not present the results in the form of conventional Bongaarts indices. His studies (referred to later in the paper) are, however, very valuable for putting in perspective the most recent data and together give a broad picture of the changes over the last 30 years of the fertility-inhibiting effect of the proximate fertility determinants in Mongolia.
The present study aims to contribute to a better understanding of the contribution of the proximate determinants of fertility decline to the changes in fertility in Mongolia during the 1990s and the beginning of the 21st century, hence completing the work previously conducted by Neupert in the early 1990s at a time of economic and social transition.
Model and Methods
In their classic work, Davis & Blake (Reference Davis and Blake1956) presented ‘a classification of the intermediate variables through which any social factors influencing the level of fertility must operate’ (p. 211). The eleven intermediates factors (and their modalities) proposed by Davis and Blake were later reduced by Bongaarts (Reference Bongaarts1978, Reference Bongaarts1982; Bongaarts & Potter, Reference Bongaarts and Potter1983) and identified as proximate determinants of fertility. To understand the variation in fertility levels, Bongaarts suggested a list of eight intermediate factors: female proportion married, contraceptive use and effectiveness, prevalence of induced abortion, duration of postpartum infecundability, fecundability, spontaneous intrauterine mortality (spontaneous abortion), prevalence of sterility and duration of the fertile period. Among those, the last four variables, which are biological determinants, are considered as secondary because their variation affects the level of fertility to a lesser extent. The first four variables, namely the female proportion married, contraceptive use and effectiveness, prevalence of induced abortion and duration of postpartum infecundability, are the most important in the analysis of fertility, because of their higher inhibiting effect on fertility. Bongaarts (Reference Bongaarts1978) proposed in his model that the maximum level of fertility (total fecundity rate (TF)) is reduced by an increased age at first marriage and marital dissolution, contraception, induced abortion and postpartum infecundability resulting from breast-feeding and postpartum abstinence. Tested on 41 populations from developing countries and historical records of developed countries, the proximate determinants of fertility framework accounted for 96% of the variation in the observed fertility rates (Bongaarts, Reference Bongaarts1982, p. 184). Although some criticisms have been formulated against the Bongaarts model (Reinis, Reference Reinis1992; Wood, Reference Wood1994), the proximate determinants of fertility framework is one of the most widely tools applied to study fertility and fertility change.
Four indices were originally developed by Bongaarts (Reference Bongaarts1978). These allow the fertility-inhibiting effect of the principal proximate determinants to be quantifyed: C m, the index of female proportion married; C c, the index of contraception; C a, the index of induced abortion; and C i, the index of postpartum infecundability. Each index ranges between 0 and 1, with 0 indicating a complete fertility-inhibiting effect and 1 no fertility-inhibiting effect. The observed fertility level in a population (total fertility rate (TFR)) is achieved as a multiplication of the four indices and the total fecundity rate (TF):

Due to the fertility-inhibiting effect of the proximate variables, the observed fertility rate (TFR) is lower than the estimated theoretical maximum level comprised between 13 and 17 children per woman (with an average of 15.3). In the absence of the fertility-inhibiting effect of the proximate determinants (i.e. all indices equal 1 (all women of reproductive age are married (C m=1); contraception and induced abortion are removed (C c and C a=1); and breast-feeding is not practised (C i=1)), the observed fertility rate (TFR) will reach the theoretical maximum level of fertility (TF).
A fifth index (Bongaarts et al., Reference Bongaarts, Frank and Lestheaghe1984) and small changes in the computation of each index (Stover, Reference Stover1998) were added to the original model. However, these later developments require quite accurate and detailed data to be correctly applied. Because such data are not available for Mongolia, these more recent advances will not be considered here.
The fertility-inhibiting effects of the intermediate variables can be estimated by an aggregate model or an age-specific model. In opposition to the former, the latter provides weighted indices and measures, as well as age-specific fertility measures and proximate determinants allowing the variation of fertility and its proximate determinants among women of different age groups to be considered (Bongaarts & Potter, Reference Bongaarts and Potter1983; Erfani & McQuillan, Reference Erfani and McQuillan2008). However, due to data limitation (survey raw data available only for 2003) and consistency through time, only the aggregate model will be applied in this study.
Data
The fertility-inhibiting effects of the intermediate variables are measured based on the Reproductive Health Survey of Mongolia data collected in 2003 (hereafter 2003 RHSM) by the National Statistical Office of Mongolia with technical and financial help of the United Nations Population Fund (UNFPA) (National Statistical Office of Mongolia & UNFPA, 2004). The 2003 RHSM is the second country representative Reproductive Health Survey (RHS) conducted in Mongolia (the first RHS was conducted in 1998). Based on a selection of 8400 households (8399 households were actually surveyed), corresponding to 1.47% of all households in the country, 9382 women of reproductive age (i.e. aged 15–49) who were present the night prior to the date of the survey in the household were selected for individual face-to-face structured interview (9314 women were actually surveyed) (National Statistical Office of Mongolia & UNFPA, 2004, p. 9). Because the interest is to assess the changes in the contribution of the proximate determinants to Mongolian fertility decline over time, there is a need to have data covering the longest time period possible. For this reason, and also because the 1998 RHSM is too close to the other data that will be used to estimate the Bongaarts indices for 1994, the second RHSM (2003 RHSM) was selected.
So far, while the first Reproductive Health Survey of Mongolia (1998 RHSM) was used in two published studies only (Aassve & Gereltuya, Reference Aassve and Gereltuya2002; Gereltuya et al., Reference Gereltuya, Falkingham and Brown2007), the 2003 RHSM remains underexploited and has never been used (except in the official commanded survey reports).
The fertility-inhibiting model (or Bongaarts model) is first applied to the most recent data. Each index is computed based on the 2003 RHSM data. The 2003 results are then put in perspective with estimates for 1994 based on data taken from the first demographic survey of Mongolia (DSM) (PTRC, 1996). The 1994 DSM (the first large-scale demographic survey ever conducted in Mongolia) took place in October and November 1994. A total of 1763 households were selected and 2030 women and 1026 men aged 15–49 years were successfully interviewed. The first DSM was conducted in a randomly selected number of aimags (provinces) (namely Hovd, Uvurkhangai, Arkhangai, Dundgobi and Khentii) and the capital city Ulaanbaatar. For additional details concerning this survey, the reader can refer to the main report (PTRC, 1996). The original dataset being hard to find, the data published in the report are used here to estimate the Bongaarts indices for 1994.
Application of the proximate determinants of fertility to the 2003 RHSM
Index of proportion married (Cm)
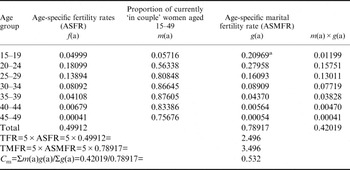
The C m index, the index of proportion married, is estimated as a weighted average of the proportions currently married by age, with the weights given by the age-specific marital fertility rates. The C m index is the proportion by which the total fertility rate (TFR) is smaller than the total marital fertility rate (TMFR) due to the proportion of women of childbearing age who are not married:

where m(a) is the age-specific proportion married and g(a) is the age-specific marital fertility rate. The index takes the value of 1 when all women of reproductive age are married and 0 when no women are married.
The 2003 RHSM distinguishes six different marital status: ‘single’, ‘married’, ‘separated’, ‘divorced’, ‘widowed’ and ‘living together’. ‘Married’ and ‘living together’ statuses are re-grouped into the same category, ‘in couple’, because couples living together present identical risks of conception to married couples and should therefore not be excluded from the proportion married.
Table 1 presents the details of the calculation of the index C m for both surveys. The g(a) values were computed based on the 36-month period before the survey. The 2003 RHSM was conducted between September and December. So, for each woman, the number of births taking place in the 36-month period before the survey was computed. The month of interview was excluded from the computation since it does not represent a full month but is censored by the date of interview. The proportion ‘in couple’, m(a), was computed at the time of the survey. The m(a) values give proportion of women who were living in a couple at the time of the survey and not at the time of the birth, assuming that the marital status observed at the time of the survey is equal to the marital status at the time of the birth. This choice introduces a small element of inaccuracy into the analysis, because it does not reflect the marital status at the occurrence of birth. However, in Mongolia, most births still occur within formal or informal union. It is true that the number of female-headed households is increasing, but this is mainly due to separation and/or marriage dissolution resulting in single (in the case of informal union) or divorced women in charge of the children.
Calculation of the index of proportion married, C m, Mongolia 2003

a As suggested by Bongaarts (Reference Bongaarts1978, p. 130), the value of g(15–19) was calculated as 0.75×g(20–24).
The values of f(a) were calculated based on the births that occurred in a 36-month period before the survey. The m(a) values are calculated based on the number of women ‘married’ and ‘living together’ at the time of the survey.
Source: all values computed from 2003 RHSM.
Index of contraception (Cc)
The index of contraception (C c) depends on the prevalence of contraception, the degree of use and the effectiveness of the contraceptive methods. When the proportion of married women of reproductive age currently using a contraceptive method (u) and the average use-effectiveness of contraception (e) are known, the aggregate index of contraception can be calculated as:

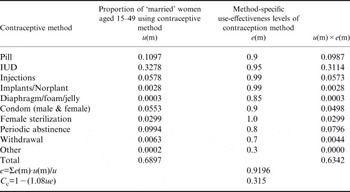
where 1.08 is a sterility correction factor, and e is estimated as: Σe(m)u(m)/u. Since estimates of contraceptive effectiveness are difficult to obtain and thus rarely available, the values measuring the use-effectiveness of the contraceptive methods are taken from Bongaarts & Potter (Reference Bongaarts and Potter1983, p. 84): 0.9 for the pill, 0.95 for IUD, 0.99 for injections, 1.00 for sterilization, 0.8 for periodic abstinence (rhythm method), 0.9 for the condom, 0.7 for withdrawal and 0.3 for other (traditional) methods. The details of the computation are given in Table 2. The C c index value was estimated to be 0.315 in 2003.
Calculation of the index of contraception, C c, Mongolia 2003

The values of u(m) were calculated based on the number of ‘married’ and ‘living together’ women aged 15–49 at the time of the survey.
Index of abortion (Ca)
The index of abortion, C a, measures the reduction in fertility due to induced abortion. It equals 1 in the absence of abortion. Spontaneous abortions are not taken into account in this index; they are included in the original estimate of total fecundity (TF), since they are considered a purely biological occurrence. The C a can be defined as the ratio of the observed total fertility rate (TFR) to the estimated TFR without induced abortion and can be computed using the formula:

where TA is the total abortion rate (i.e. the number of abortions an average Mongolian woman could be expected to have in her lifetime if the abortion rate remains at the prevailing levels throughout her reproductive period), and b is the births averted per induced abortion. In the original proximate framework, b=0.4 (1+u). In the absence of contraception, u=0 and b reaches 0.4; with moderately effective contraception practice, u=1 and b=0.8. Indeed, u should be computed as the proportion of married women who had an induced abortion and are currently using contraception. Since this information is almost never available, the value of u is taken to equal the proportion of all married women who are currently using contraception (Bongaarts, Reference Bongaarts1978, p. 114). Modification of the original model suggests multiplying the contraceptive prevalence (u) by the contraception effectiveness (e) in order to describe more accurately the proportion of women who are protected by contraception (Stover, Reference Stover1998, p. 258). Thus b is estimated by 0.4(1+ue). Because this modification of the original model does not require additional data, it is applied here.
In most applications of the Bongaarts model, the index of abortion C a is rarely computed due to limited information on abortion practice. The index C a is thus equal to 1 in the proximate framework of fertility, signifying that abortion is not practised. However, as noted earlier, abortion as a contraceptive method was widely practised in Mongolia (Neupert, Reference Neupert1994, Reference Neupert1996; Pandey, Reference Pandey1997, Reference Pandey2002). Fixing the index C a to 1 in the model is equivalent to missing an important fertility intermediate variable; to negate a full part of Mongolian fertility behaviours.
In the 2003 RHSM women were asked about their abortion experience since January 1998 (i.e. in the 5-year period preceding the survey). Based on these data, the total abortion rate (TA) was computed and reached 0.510. Integrated in the calculation of the index of abortion (eqn (4)), it gives an estimated C a of 0.882.
Index of postpartum infecundability (Ci)
The fertility-inhibiting effect of lactation operates through delaying the next conception and hence increasing the length of birth interval and reducing natural fertility. The lactational fertility-inhibiting effect is estimated by comparing average birth-interval lengths in the presence or absence of lactation. The birth interval can be decomposed into four components (Bongaarts, Reference Bongaarts1978, p. 115):
(1) An infecundable interval follows each birth. In the absence of lactation, the period between birth and the first postpartum menses averages about 1.5 months; in the presence of prolonged lactation, this period can last up to 24 months.
(2) With the first ovulation which follows a birth starts the waiting time to conception. This period ends in a conception. On average, the waiting time to conception ranges from about 5 months to a maximum of 10 months, with common values around 7.5 months.
(3) But a conception does occasionally not end in a live birth and is interrupted by spontaneous abortion. On average, a spontaneous abortion adds 2 months to the birth interval.
(4) Each ‘successful’ (i.e. not ended by spontaneous abortion) conception is followed by a gestation period of nine months.
In the proximate determinants of fertility framework, the birth interval without lactation is estimated to reach a 20-month duration (=1.5+7.5+2+9), and with lactation, an 18.5-month duration (=7.5+2+9) plus the average duration of the infecundable period. The index of postpartum infecundability can hence be estimated as the ratio of the average birth intervals without and with lactation:

where i is the mean duration (in months) of postpartum infecundability from birth to the first postpartum ovulation (menses). If C i equals 1.0 (absence of lactation), i reaches 1.5 months; this means that the total natural marital fertility is equal to the total fecundity (TNMFR=C i×TF). Hence, C i declines only if the lactation period lengthens.
In the absence of a direct estimate of i, it can be estimated from the mean duration (in months) of breast-feeding practice (BF) (Bongaarts, Reference Bongaarts1982, p. 188):

However, Mongolian data on duration of breast-feeding are not reliable; they present strong attractions on 12, 18 and 24 months. If these data were used, the resulting i would be overestimated and the denominator in eqn (5) would be too high. The index C i would hence be artificially low, giving too much importance to that parameter in the estimation of the total fertility rate. In other words, employing the data on the duration of breast-feeding overestimates the effect of postpartum infecundability. To avoid this bias, the mean duration of postpartum amenorrhoea (i.e. the time after birth a woman experienced without having her period) is used here. According to the 2003 RHSM, mean duration of postpartum amenorrhoea reaches 5.95 months. Based on these data, the fertility-inhibiting effect of postpartum infecundability (index C i) is estimated to be 0.818 in 2003.
Multiplicative effects of the proximate determinants of fertility
As aforementioned, the model proposed by Bongaarts is a multiplicative fertility model, which allows the proportionate fertility-inhibiting effects of four proximate determinants to be estimated.
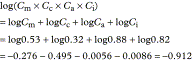
The total fertility rate of Mongolia in 2003 can thus be computed as the outcome of the product of the four indices and the total fecundity (TF) (eqn (1)):

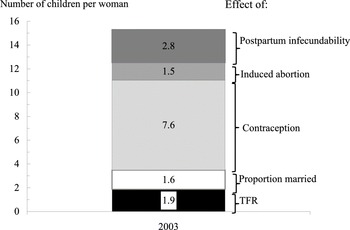
Among the proximate determinants, marriage (C m) and contraception (C c) contribute the most to explaining the fertility level observed in Mongolia in 2003 (Fig. 2). On the other hand, postpartum infecundability and abortion play only a residual role in the determination of current fertility level in Mongolia. To assess more precisely the relative importance of each proximate variable of fertility, a logarithmic transformation can be used:
Proximate determinants of fertility, Mongolia 2003. Source: 2003 RHSM.

The use of contraception is the major fertility-inhibiting factor of the four proximate determinants and contributes 54.2% to the reduction in the fertility level (−0.495/−0.912). This result indicates that contraception has played the more important role in the recent decline in fertility rate in Mongolia. Mongolian marriage pattern is the next factor contributing to the fertility decline, accounting for 30.2% (−0.276/−0.912). Finally, postpartum infecundability and induced abortion together contribute around 15%: 9.4% (−0.086/−0.912) and 6.1% (−0.056/−0.912) respectively.
The results obtained for 2003 show that the importance of abortion as a determinant of Mongolian fertility has decreased and significant changes in the proximate determinants took place after the political and economic transition of the early 1990s. The impact of these changes on the proximate fertility determinants is discussed in the next section.
Changing contribution of the proximate determinants in Mongolian recent fertility decline
In the early 1970s, Mongolian fertility started to decline. In 1990, the end of socialism and the transition to democracy and market economy acted as powerful accelerators to the decline of Mongolian fertility (see Fig. 1). What were the contributing factors to this ‘reproduction collapse’?
After introducing the works of Neupert in the early 1990s, this section aims to identify changes in the fertility-inhibiting factors over time. Based on the 1994 DSM data (PTRC, 1996), the fertility proximate determinants are reconstructed for 1994 in order to put in perspective the results computed from the 2003 RHSM and understand the main factors that have contributed to the decline of fertility in post-socialist Mongolia.
In a series of papers (1993, 1994, 1996), Neupert addressed the changes in the contribution of the proximate determinants to the fertility decline in Mongolia between 1970 and 1990. Applying the Bongaarts model to the sparse Mongolian data available for 1970 and 1990 (but his results are presented unfortunately using a decomposition analysis and not the classic Bongaarts indices (C m, C c, C a and C i)), Neupert showed that induced abortion was the most significant variable that contributed to the decline of fertility in Mongolia between 1970 and 1990. In comparison to other developing countries, in Mongolia ‘[t]he contribution of contraceptive prevalence is somewhat small … [and] [t]he contribution of marital patterns (decline in the proportion who ever married and increase in age at marriage) is also comparatively low’ (Neupert, Reference Neupert1993, p. 453). These results also indicate that the length of breast-feeding declined, pointing out that without the offsetting effects of the other factors, fertility would have risen moderately. It is important to mention that the data used by Neupert were official data on induced abortion and contraceptive distribution gathered in governmental institutions (hospitals or health centres), implying that only public contraceptive distribution and legal abortions were recorded. Both contraception and abortion figures undoubtedly underestimate the number of contraceptives used and abortions performed at that time and ultimately the computation of the fertility-inhibiting effect of these two proximate determinants of fertility. To account for such effects (illegal abortion, private access to modern contraception and use of traditional contraceptive methods), Neupert introduced a fifth factor that contributed as much as one-third to the fertility level. Indeed it is likely that the contribution of induced abortion to the decline in fertility in Mongolia was more important than Neupert's studies indicated (Neupert, Reference Neupert1993, p. 453).
The work conducted by Neupert in the early 1990s cannot be directly compared with the results computed from the 2003 RHSM. It is possible, however, from the 1994 DSM to compute estimates of the Bongaarts indices. As aforementioned, the 1994 DSM data used in this paper are taken from the main survey report (PTRC, 1996). This reconstruction thus allows a direct comparison of the changes in the contribution of the proximate determinants in the recent phase of Mongolian fertility decline.
Estimation of the Bongaarts model for 1994
Index of proportion married C m. Unfortunately, marital fertility rates are not presented in the 1994 DSM report. However, even without access to the 1994 DSM raw data, the fertility-inhibiting effect of the proportion married (C m) can be estimated using information on the number of infants, infant mortality and the number of married couples of reproductive age.
Indeed, based on the near-linear relationship between the total fertility rate and the general fertility rate (Bogue, Reference Bogue, Bogue, Arriaga, Anderton and Rumsey1993), it is possible to estimate the total marital fertility rate (TMFR) from the general marital fertility rate (Ranjan, Reference Ranjan2005). The general marital fertility rate – defined as the number of live births per 1000 currently married women of reproductive age (15–49 years) – can be computed as the ratio of the total number of live births (estimated from the number of infants and the estimates of the probability of dying in the first year of life (1q 0) (PTRC, 1996, pp. 19 and 45)) to the total number of currently married couples of reproductive age (PTRC, 1996, pp. 21 and 71). The 1994 DSM considered as married or ‘in couple’ both registered and unregistered marriages as well as persons who stated explicitly that they were living together (PTRC, 1996, p. 70).
The application of this procedure to the 1994 DSM data gives a TMFR of 4.14 children per woman and an index of proportion married C m:

The value of C m estimated for 1994 is higher than the 2003 C m of 0.532, indicating that the fertility-inhibiting effect of marriage increased during the 1990s. This result is consistent with the analysis of the fertility development by parity, which indicates that childlessness and illegitimacy were rare in Mongolia during the 1980s and early 1990s (Spoorenberg, in press).
Index of contraception Cc
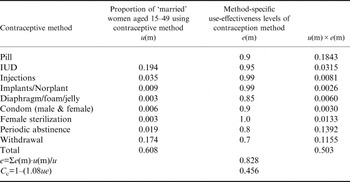
To calculate this, the use of contraceptive method (u) and the average use-effectiveness of contraception (e) are needed. The former was obtained by distributing the contraceptive use according to the use of contraceptive methods surveyed in 1994 (PTRC, 1996, p. 79; Pandey, Reference Pandey1997, p. 89). The values of e(m) listed in Table 2 are used. Table 3 presents the computation of the index of contraception C c and indicates a value of 0.456 for Mongolia in 1994; a value higher in comparison with 2003, indicating that the use of contraception increased during the second half of the 1990s (an index of 0 indicating a complete fertility-inhibiting effect).
Calculation of the index of contraception, C c, Mongolia 1994

The values of u(m) were calculated based on the number of ‘married’ and ‘living together’ women aged 15–49 at the time of the survey.
Index of abortion Ca
In addition to the two estimates used in the computation of the index of contraception (u and e), a total abortion rate (TA) is needed to compute the fertility-inhibiting effect of abortion (C a). In the main report of the 1994 DSM, information on abortion was not analysed because of the poor quality of the response, probably due to the sensitivity of the subject and the absence of privacy during the interview (PTRC, 1996, p. 70).
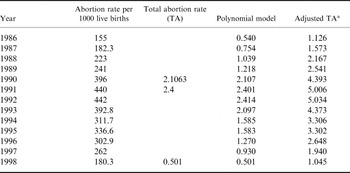
Data on abortion are very sparse for Mongolia and only a few sources mention a TA value: 2.1063 in 1990 (Neupert, Reference Neupert1993, p. 452), 2.4 in 1991 (Neupert, Reference Neupert1996, p. 41) and 0.501 in 1998 (National Centre for Health Development of Mongolia & UNFPA, 2001). However, it is likely that these TA values are underestimated and would thus affect the computation of the index C a by reducing artificially the fertility-inhibiting effect of abortion. While data on TA are difficult to collect, the abortion rate per 1000 live births is available from 1986 to 2000 (National Centre for Health Development of Mongolia & UNFPA, 2001). With the amendment of the law on abortion in 1989 the abortion rate per 1000 live births exploded from 241 in 1989 to 396 in 1990, and reached its peak in 1992 with 442; a value almost the double that recorded three years before.
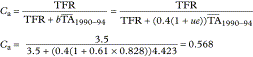
These data on the TA and abortion rate per 1000 live births were used to estimate the index of abortion C a. A polynomial curve was first fitted to the series of TA values, assuming that if the level was underestimated, the general pattern for the 1990s was real. Indeed, this model is coherent with the diffusion of modern contraceptives in Mongolia starting with the first UNFPA country programme (see Introduction). From this model, a TA for each year can be computed; these values are, however, underestimated. The series on the abortion rate per 1000 live births was then used to redress the TA values. A correctional factor was computed as the ratio of the averaged abortion rate per 1000 live births between 1986 and 1989 to the averaged abortion rate per 1000 live births for the period 1990–1993. Table 4 presents the results of the application of this procedure. The index of abortion C a was estimated using a TA averaged for the period 1990–94 reaching 4.423 and an observed TFR of 3.5 for the period 1991–1994 (PTRC, 1996, p. 61):
Adjustment procedure for the total abortion rate, TA, Mongolia

a See text for the computational details of the correctional factor (=2.085).
Sources: Neupert, Reference Neupert1993, p. 452; Neupert, Reference Neupert1996, p. 41; National Centre for Health Development of Mongolia & UNFPA, 2001, p. 11.
The resulting index of abortion reached 0.568; a value lower than the one computed for 2003, indicating that the fertility-inhibiting effect of abortion reduced during the 1990s. In other words, women were less prone to use abortion to control their reproduction.
Index of postpartum infecundability Ci
This can be computed based on the data collected in the 1994 DSM on the postpartum amenorrhoea period. For the same reasons mentioned earlier, these data are more reliable than the information collected on breast-feeding. According to the 1994 DSM, the mean duration of postpartum amenorrhoea reached 6.5 months (PTRC, 1996, p. 75). The effect of the postpartum infecundability (C i) can thus be computed using eqn (5) and reaches 0.800.
Multiplicative effects of the proximate determinants of fertility
As for 2003, the total fertility rate for Mongolia in 1994 can be computed as the outcome of the product of the four indices and total fecundity (TF) (eqn (1)):

Among the proximate determinants, contraception (C c) and abortion (C a) contributed the most to explaining the fertility level observed in Mongolia in 1994. However, the effects of marriage and infecundability were much less important in the determination of Mongolian fertility level in 1994.
Conclusion
The end of the socialist system in Mongolia and the openness of the country to the international community deeply affected the course of fertility. With the transition to democracy and market economy, the total fertility rate dropped from 4.5 children per woman in 1989 to 2.5 four years later in 1993. The objective of this paper was to understand better this ‘reproductive collapse’ by analysing the changes in the proximate determinants of fertility between 1994 and 2003 using survey data.
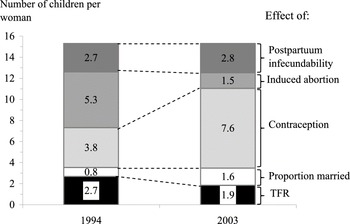
Application of the Bongaarts model to the 1994 DSM and 2003 RHSM data allows the changes affecting Mongolian society in the early 1990s and also the means women used to control their fertility to be considered (Fig. 3). The main changes taking place were the reduction of induced abortion as the main proximate determinant of fertility and the diffusion of contraception during the second half of the 1990s, becoming the main proximate factor.
Changing contribution of the proximate determinants to the Mongolian fertility decline, 1994–2003.

In 1994, the practice of induced abortion contributed to reduce the TF (total fecundity rate of 15.3 children per woman) by more than 5 children per woman (5.3). Within the next 10 years, the contribution of induced abortion to the combined inhibiting effects of the proximate determinants of fertility decreased significantly, and in 2003 it contributed to decrease fertility from its theoretical maximum by only 1.5 children per women. On the other hand, the fertility-inhibiting effect of contraception (expressed in terms of number of children per woman) doubled from 3.8 children per woman in 1994 to 7.6 in 2003. Clearly, the end of socialism and the transition to democracy and market economy, opening the country to the international community, made it possible for couples to access modern efficient contraception. From 1992, the successive five-year UNFPA country programmes have granted free access to modern contraception throughout the country at local official reproductive health centres. The results shown here provide evidence that during the 1990s women increasingly used contraceptive methods to control their reproduction, and the frequent use of induced abortion as a primary fertility regulation method rather than the ultimate solution to contraceptive failure to control fertility has progressively faded in the last decade in Mongolia.
Acknowledgments
This paper was written at the Population Teaching and Research Center, School of Economic Studies, National University of Mongolia, Ulaanbaatar, while the author was on academic leave from the Laboratory of Demography and Family Studies, Department of Econometrics and Department of Economic History, University of Geneva, Switzerland. The author would like to thank warmly the PTRC members for their kind assistance throughout his stay from September 2007 to January 2009. Financial support from the Geneva-Asia Society, the General Fund of the University of Geneva and the Boninchi Foundation is greatly acknowledged.