

1 INTRODUCTION
In this paper we report on a study that uses the Personalized Implicit Association Test (P-IAT, Olson & Fazio, Reference Olson and Fazio2004) to measure attitudes towards regional language variation in Belgian Dutch. The study aligns with a recent wave of methodological innovation in the field of language attitude research, as well as with a renewed interest in attitudes towards (regional) language variation in the Dutch language area (i.e., Flanders, the Dutch speaking part of Belgium, and the Netherlands) (e.g., Grondelaers, Van Hout & Speelman, Reference Grondelaers, van Hout and Speelman2011; Speelman, Spruyt, Impe & Geeraerts, Reference Speelman, Spruyt, Impe and Geeraerts2013; Preston, Reference Preston2016). In that respect, the objectives of the study are twofold: both methodological and descriptive. From a methodological point of view, the study introduces the Personalized Implicit Association Test, an existing social psychological attitude measure, as a new method to measure language attitudesFootnote 1 , while from a descriptive perspective, it aims to contribute to the study of attitudes towards regional variation in Belgian Dutch, which has received very little attention compared to the work that is being carried out on variation in Netherlandic Dutch. In what follows, we will situate the study from both perspectives.
1.1 Methodological Perspective
Quantitative linguistic attitude research has known little methodological innovation in the last few decades compared to social psychology, which has witnessed an explosion of new attitude measures in recent years (Grondelaers, Reference Grondelaers2013; Speelman et al., Reference Speelman, Spruyt, Impe and Geeraerts2013). After a period of limited innovation, linguistic attitude research now seems to be catching up (Preston, Reference Preston2016). Examples of studies providing new impulses for traditional language attitude research are Grondelaers & Speelman (Reference Grondelaers and Speelman2015), who apply new techniques to analyze responses from keyword tasks, Staum Casasanto, Grondelaers & Van Hout (Reference Staum Cassasanto, Grondelaers and van Hout2015), who use images in a forced choice task to replace traditional Likert scale ratings with verbal descriptions of social traits, or Montgomery & Stoeckle (Reference Montgomery and Stoeckle2013), who introduce innovations in processing data collected through ‘draw a map’ tasks. Not only are linguists starting to improve and refine traditional methods, they are also gaining interest in exploring those measures recently developed in social psychology.
Only a few of those social psychological measures have been explored in linguistic attitude research so far, the most popular being the Implicit Association Test (IAT, Greenwald, McGhee & Schwartz, Reference Greenwald, McGhee and Schwartz1998; see Teige-Mocigemba, Klauer & Sherman, Reference Teige-Mocigemba, Klauer and Sherman2010 for a more recent introduction). The IAT is a reaction time based categorization task that measures the association between two binary concepts (e.g., candy/vegetables and good/bad). So far linguists have employed the IAT to study the following aspects of language varieties and linguistic variants: their evaluation (Babel, Reference Babel2010; Redinger, Reference Redinger2010; Pantos & Perkins, Reference Pantos and Perkins2012; Lee, Reference Lee2015; Watt & Llamas, Reference Watt and Llamas2015; Loudermilk, Reference Loudermilk2015; Leinonen, Reference Leinonen2016), their social meaning and indexicality (Campbell-Kibler, Reference Campbell-Kibler2012, Reference Campbell-Kibler2013; Llamas, Watt & MacFarlane, Reference Llamas, Watt and MacFarlane2016; Hilton, Rosseel, Smidt & Coler, Reference Hilton, Rosseel, Smidt and Coler2016), and their salience (Leinonen, Reference Leinonen2016).
The IAT is used very frequently in social psychology and has been successfully applied to the study of a wide variety of topics, ranging from racial stereotypes (e.g., Greenwald et al., Reference Greenwald, McGhee and Schwartz1998) to addictive behaviour (e.g., Houben & Wiers, Reference Houben and Wiers2006) or advertising (e.g., Maison, Greenwald & Bruin, Reference Maison, Greenwald and Bruin2004). One reason for the IAT’s popularity in social psychology is that it has been shown to have good psychometric qualities (Nosek, Greenwald & Banaji, Reference Nosek, Greenwald and Banaji2007). In addition, the measure is quite flexible, for instance in the type of stimuli it allows (written words, images, sound clips, etc.) and the type of associations that can be measured (i.e., not restricted to good/bad associations). An introductory overview of the IAT for a linguistic audience can be found in Rosseel, Geeraerts & Speelman (Reference Rosseel, Geeraerts and Speelman2014). However, the method comes with a number of characteristics which are sometimes considered limitations. One such characteristic is the fact that the concepts studied in the IAT have to be presented as binary categories. To make up for this potential limitation, a number of variants of the traditional IAT have been developed. Measures like the Single Target IAT (Wigboldus, Holland & Van Knippenberg, Reference Wigboldus, Holland and van Knippenberg2004) and the Single Attribute IAT (Penke, Eichstaedt & Asendorpf, Reference Penke, Eichstaedt and Asendorpf2006) allow for non-binary concepts.
Another problem the IAT is claimed to suffer from is the measurement of extra-personal associations instead of personal associations (although this distinction is not uncontroversial. See Gawronski, Peters & LeBel, Reference Gawronski, Peters and LeBel2008). Resonating with Karpinski & Hilton’s (Reference Karpinski and Hilton2001) concept of environmental associations, Olson & Fazio (Reference Olson and Fazio2004: 653) describe these extra-personal associations as ‘associations that are available in memory but are irrelevant to the perceived likelihood of personally experiencing a positive or negative outcome on interaction with the attitude object’. Hence, personal associations refer to preferences endorsed by an individual. Extra-personal associations, on the other hand, are present in memory, because they are frequently encountered in society, but they are not necessarily endorsed by the individual. For example, for someone who dislikes vegetables, a traditional IAT may still return positive associations with vegetables, because this person will have been repeatedly confronted with the information that vegetables are healthy and good for you, for instance in school or through government campaigns. To deal with this potential disadvantage, the Personalized IAT (P-IAT) was developed (Olson & Fazio, Reference Olson and Fazio2004). In this study, the personalized variant of the IAT will be applied for the first time – to the best of our knowledge – in the context of linguistic attitude research.
The P-IAT measures the association between a binary target concept (e.g., language variety: variety A vs. variety B) and a binary attribute concept (e.g. valence: I like vs. I don’t like) by comparing reaction times in a number of computer-based categorization tasks. For each of these four concept categories, a number of stimuli is required that are representative of their respective category.
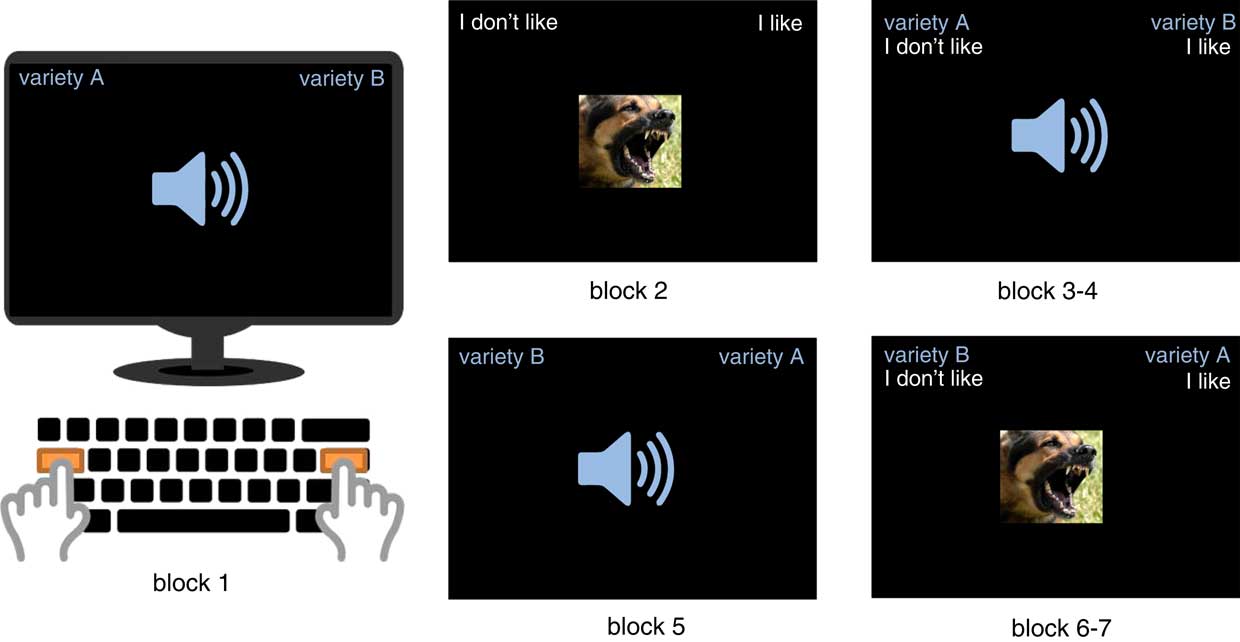
In a P-IAT, participants are asked to categorize the target and attribute stimuli according to the corresponding target and attribute categories respectively. This is done by pressing one of two response keys representing the categories involved in the experiment. The mapping of the categories onto the response keys is indicated with labels in the top corners of the computer screen throughout the experiment, so participants do not need to memorize the mappings (see Figure 1). A P-IAT is made up of a series of trials which each require the categorization of one stimulus. These trials are divided into seven blocks. The first two blocks of trials are practice blocks which aim to familiarize the participant with the stimuli used in the experiment, the categorization task and the mappings of the response keys. The first block consists of target stimulus discrimination: in each trial participants indicate which of the two target categories a stimulus belongs to (see block 1 in Figure 1). The second practice block involves the categorization of attribute stimuli according to the attribute categories ‘I like’ vs. ‘I don’t like’ (see block 2 in Figure 1). The third and fourth block are two identical experimental blocks. They combine the target and attribute discrimination practiced in the first two blocks. Both target and attribute stimuli have to be categorized in these blocks using the response keys on which both a target and an attribute category are currently mapped (e.g. ‘variety A’ + ‘I don’t like’ for the left-hand key, and ‘variety B’ + ‘I like’ for the right-hand key, see block 3-4 in Figure 1). Note that each stimulus belongs to one category only. This set of experimental blocks is followed by another practice block requiring target discrimination. This fifth block is identical to the first block except that the category labels mapped onto the response keys have now swapped sides (see block 5 in Figure 1). If, for example, the left key corresponded to variety A in the first block, it will now correspond to variety B and vice versa for the right key. Note that this block usually contains twice as many trials as the first practice block. This gives participants ample time to get used to the new configuration which should help to avoid compatibility order effectsFootnote 2 (Teige-Mocigemba et al., Reference Teige-Mocigemba, Klauer and Sherman2010; Gawronski et al., Reference Gawronski, Deutsch and Banse2011). The final two blocks are again identical experimental blocks and contain trials in which either target or attribute stimuli are to be categorized. For the target categories, the response key mappings from the fifth block are retained, while the mappings for the attribute categories are kept constant throughout the experiment. This results in a response key mapping in block 6 and 7 that is the reverse of the mapping in block 3 and 4, the other set of experimental blocks (see block 6-7 in Figure 1).
Screenshots with an example of a trial from each block of a P-IAT. The example for block 1 also illustrates the experimental set-up.

This inverse response key mapping in the two sets of experimental blocks is primordial to the mechanism behind the P-IAT. Categorization of the stimuli is assumed to be easier if the responses mapped onto the same key are congruent according to one’s attitudes. Conversely, when the mapping of categories onto the response keys is incongruent with one’s attitudes, categorization of the stimuli will be harder. For instance, for a participant with positive associations with variety A, but negative associations with variety B, stimulus discrimination will be easier if stimuli representing variety A and intrinsically positive stimuli, like pictures of a smiling child or a sunny beach, are categorized with the same key. Yet, it will be more difficult for that person if ‘variety A’ and ‘I don’t like’ are assigned to the same response key. Easier categorization will lead to faster reaction times, while a harder categorization task will slow down responses. By comparing reaction times in the two sets of experimental blocks, we can determine which concepts participants associate more strongly.
In order to personalize the IAT, Olson and Fazio (Reference Olson and Fazio2004) suggest three changes to the traditional IAT that aim to reduce the activation of extra-personal associations. Firstly, the P-IAT uses attribute labels that refer directly to the participant’s opinions, such as ‘I like’ and ‘I don’t like’ instead of more normative options like ‘good’ and ‘bad’ or ‘pleasant’ and ‘unpleasant’. Secondly, corrective error feedback is usually left out in personalized versions of the IAT, because it may suggest to the participants that they are to categorize items according to societal norms, rather than their own attitudes. A third option for reducing the influence of extra-personal associations is the use of attribute stimuli that are not perceived as universally positive or negative, again to avoid conveying the impression that categorization of the attribute stimuli is to be done based on societal norms rather than personally held attitudes. Instead, attribute items are chosen that are not neutral, but whose valence may differ from participant to participant. It was shown, however, that the former two adaptations suffice to personalize the IAT (Olson & Fazio, Reference Olson and Fazio2004: 664).
Except for the studies using the IAT mentioned above, linguists’ exploration of other social psychological measures has been rather limited. One such other measure is affective priming (AP, Fazio, Sanbonmatsu, Powell & Kardes, Reference Fazio, Sanbonmatsu, Powell and Kardes1986). In an AP experiment, participants are asked to categorize target stimuli as positive or negative. These stimuli are preceded by valenced prime stimuli, often presented subliminally. Depending on whether the valence of the prime is congruent with that of the target, categorization will be faster (in case of congruence: positive prime+positive target, or negative prime+negative target) or slower (in case of incongruence: positive prime+negative target, or negative prime+positive target). Reaction times can then be used to determine the valence of the primes under study. So far, the only research we know of that successfully used AP to measure language attitudes is Speelman et al. (Reference Speelman, Spruyt, Impe and Geeraerts2013).
In this paper, we will show that the P-IAT is a promising addition to the range of methods used in linguistics to study the social meaning of language variation. We will do so by comparing the P-IAT to two other measures: one implicit (AP) and one explicit (a rating task using semantic differential scales).
1.2 Descriptive Perspective
Before presenting an overview of the current state of attitudinal studies on varieties of Belgian Dutch and discussing the descriptive aims of this study, let us briefly outline the stratificational structure of Dutch in Belgium. Dutch is the official language in Flanders, the northern part of Belgium. Today, Belgian Dutch is generally taken to represent a situation of diaglossia, to use Auer’s (2005) typology (e.g., Geeraerts & Van de Velde, Reference Geeraerts and Van de Velde2013). This means that the linguistic situation can be described as a continuum with on one extreme the base dialects, and on the other, Standard Belgian Dutch (SBD). Although the standard variety of Dutch in Belgium is perceived today as a distinct variety from Standard Netherlandic Dutch, the former was modelled after the latter and spread top-down during a standardization process which started in the nineteenth century, but only gained momentum after the Second World War (Geeraerts, Reference Geeraerts2017; Marynissen, Reference Marynissen2017). The space between the local dialects and SBD in the diaglossic continuum is filled by a highly heterogeneous variety with a regional flavor, often referred to as tussentaal. This colloquial variety, which we will refer to in this paper as Colloquial Belgian Dutch (CBD), has proven hard to define and delineate and is to be situated somewhere between the local dialects and Standard Belgian Dutch. This explains why the variety is commonly nicknamed tussentaal, which literally translates as ‘in-between language’ (Grondelaers et al., Reference Grondelaers, van Hout and Speelman2011). CBD can be described as ‘a collection of linguistic variables that have a supra-regional distribution on the geographic dimension’ (Geeraerts & Van de Velde, Reference Geeraerts and Van de Velde2013: 532). These variables are phonological, morphosyntactic and lexical in nature. Many of them find their origin in the central Brabant area of Belgium, which is perhaps not surprising given the dominant role of this region in the linguistic history of Belgian Dutch (Goossens, Reference Goossens1970; Geeraerts & Van de Velde, Reference Geeraerts and Van de Velde2013). However, CBD often also includes regional elements, such as lexical items and a regional accent (Geeraerts & Van de Velde, Reference Geeraerts and Van de Velde2013).
Since the 1980s, attitude research towards (regional) varieties of Dutch has mainly focused on Netherlandic Dutch (Grondelaers, Reference Grondelaers2013). Even after 2000, when language attitude research in the Low Countries slowly started to pick up again after diminished interest in the 1990s and focused its attention on variation in the standard language (Grondelaers, Reference Grondelaers2013), most studies tend to concentrate on Dutch variation in the Netherlands (e.g., Van Bezooijen, Reference Bezooijen2001, Grondelaers & Van Hout, Reference Grondelaers and van Hout2010). Recent attitude research towards variation in Belgian Dutch is still scarce and mainly focuses on CBD and its relation to the standard variety and local dialects (Grondelaers, Reference Grondelaers2013). Overall, this research is rather fragmented, focusing on various regional varieties and participant groups. A large-scale survey of the attitudinal landscape in Dutch speaking Belgium is lacking as yet.
The few recent attitudinal studies carried out in Dutch speaking Belgium, all dealing with CBD compared to SBDFootnote 3 , mostly come to the conclusion that SBD is viewed more positively than CBD, specifically regarding perceptions of power, competence and status (Cuvelier, Reference Cuvelier2007; Impe, Reference Impe2006; Impe & Speelman, Reference Impe and Speelman2007; Speelman et al., Reference Speelman, Spruyt, Impe and Geeraerts2013). The amount of CBD features plays a mediating role in this trend: the more features, the less status (Impe & Speelman, Reference Impe and Speelman2007). On the other hand, CBD is perceived more positively on the solidarity dimension (Cuvelier, Reference Cuvelier2007; Impe & Speelman, Reference Impe and Speelman2007). Yet, some studies report findings that nuance this picture and present some neutral (Lybaert, Reference Lybaert2014), less negative (Cuvelier, Reference Cuvelier2007; Grondelaers & Speelman, Reference Grondelaers and Speelman2013) or inconsistent (albeit rather low, Vandekerckhove & Cuvelier, Reference Vandekerckhove and Cuvelier2007) perceptions of CBD on the level of competence and status. Grondelaers et al. (Reference Grondelaers, van Hout and Speelman2011), who did not include a comparison with SBD in their study, even report a certain level of speaker prestige and accent status for CBD, especially for the central Brabant variety in comparison to more peripheral varieties. The influence of sociodemographic variables on these attitudes towards SBD and CBD is still unclear. For instance, certain studies found (some) influence of listeners’ age (Vandekerckhove & Cuvelier, Reference Vandekerckhove and Cuvelier2007; Ghyselen, Reference Ghyselen2009), while others did not (Impe & Speelman, Reference Impe and Speelman2007, who did not find any gender differences either). Impe & Speelman (Reference Impe and Speelman2007) and Grondelaers et al. (Reference Grondelaers, van Hout and Speelman2011) also report no influence of listeners’ regional background, while this does seem to be the case in Speelman et al. (Reference Speelman, Spruyt, Impe and Geeraerts2013). It has also been shown that the regional origin of the CBD variety influences perceptions: in Impe & Speelman (Reference Impe and Speelman2007), the Brabant variety of CBD receives the most positive evaluations on the solidarity dimension. It is important to keep in mind though, that the methods, designs, and varieties of CBD investigated differ between these studies, so a direct comparison of results is difficult.
A complementary perspective with regard to these findings is provided by Van Gijsel, Speelman and Geeraerts (Reference Van Gijsel, Speelman and Geeraerts2008). In their study, the use of CBD and SBD in Belgian radio and television commercials is investigated. Perceptions towards both varieties turn out to be deliberately exploited in advertisements: not only are commercials containing CBD usually directed towards a younger audience, there also is a division of labour between both varieties. CBD tends to be used for staging informal everyday conversations, while serious and factual information is delivered in SBD. These findings from production research seem to correspond with the ones obtained in the perception studies on CBD and SBD.
All perception studies mentioned above take a more holistic perspective and study attitudes towards CBD without distinguishing between different types of features, except for Grondelaers & Speelman (Reference Grondelaers and Speelman2013) and Speelman et al. (Reference Speelman, Spruyt, Impe and Geeraerts2013). The former takes into account phonological, morphological and lexical features, while the latter focuses on regional pronunciation. Grondelaers & Speelman (Reference Grondelaers and Speelman2013) found that evaluations of CBD differ depending on the nature of features presented to the listener-judges. CBD lexis and morphology are both downgraded on the prestige dimension, and so are morphological features for dynamism (a dimension not taken into account by other studies). Yet, CBD phonology is not downgraded on either prestige or dynamism and CBD lexis is even upgraded on the latter dimension.
Although our study does not allow us to distinguish between different dimensions of language attitudes, we will confirm the positive evaluation of SBD compared to CBD reported by previous work. We will also be able to demonstrate that the interaction between regional origin of the participants and the variety of CBD is of relevance to the language attitudes under study.
1.3 Research Questions and Hypotheses
Against the methodological and descriptive background sketched in 1.1 and 1.2, we can now specify the aims of the present study with regard to both dimensions. From a methodological perspective, we explore the P-IAT as a measure of language attitudes and show how the measure can be a useful tool for linguists. We opted for the personalized variant of the IAT, because it has been demonstrated to reduce the risk of measuring extra-personal associations while still sporting good psychometric qualities comparable to those of the traditional IAT (Gawronski, Deutsch & Banse, Reference Gawronski, Deutsch and Banse2011). Additionally, we aim to compare the performance of the P-IAT as a measure of language attitudes to affective priming (AP). The latter method has been successfully applied to measure language attitudes by Speelman and colleagues (Reference Speelman, Spruyt, Impe and Geeraerts2013), yet social psychologists have shown that AP does not do so well psychometrically, especially when it comes to reliability (Spruyt, Gast & Moors, Reference Spruyt, Gast and Moors2011). Hence, in this study we set out to explore whether we can obtain similar results using the more reliable P-IAT. In order to do so, we applied the P-IAT to study the same regional varieties of Belgian Dutch that were investigated in Speelman et al. (Reference Speelman, Spruyt, Impe and Geeraerts2013) using identical stimuli to guarantee maximal comparability between the two studies. Additionally, we collected explicit ratings about the language varieties under study, so the P-IAT results can be compared with these as well. As the results will show, the attitudinal patterns observed largely coincide between the three measures, but are not identical. In the discussion section, we will consider a number of potential explanations of why there is no perfect overlap.
From a descriptive point of view, this paper aims to contribute to a picture of the attitudinal landscape of Belgian Dutch, which is far from complete. We measured attitudes towards SBD and two regional varieties of Belgian Dutch, one central variety and one peripheral variety. The choice of specific regional varieties, Antwerp as the central variety and West-Flemish as the peripheral variety, was based on Speelman et al. (Reference Speelman, Spruyt, Impe and Geeraerts2013) in order to be able to compare results. Choosing a central and a peripheral variety is also interesting from a theoretical point of view: CBD features from the central area are claimed to spread to the peripheral area, and, as indicated above, perceptual research found some evidence that central varieties may be more positively evaluated than peripheral ones (Impe & Speelman, Reference Impe and Speelman2007; Grondelaers et al., Reference Grondelaers, van Hout and Speelman2011).
Our study focuses on regional accent, which is an important feature of CBD varieties. The reason we decided to study regional accent in isolation is both theoretically, practically and descriptively motivated. Firstly, apart from Speelman et al. (Reference Speelman, Spruyt, Impe and Geeraerts2013) no recent work on the attitudinal landscape of Belgian Dutch has focused purely on the evaluation of accent. Yet, as Grondelaers & Speelman (Reference Grondelaers and Speelman2013) found, CBD features on different linguistic levels may carry different social meaning and for regional accent variation, this is virtually unexplored. Secondly, accent variation may be the most obvious type of variation to implement in the P-IAT as the measure requires its stimuli to be as short as possible. Hence, accent variation presented itself as a good starting point for exploring the P-IAT as a language attitudes measure. Even so, we hope future research will experiment with the possibilities of including, for example, lexical and syntactic variation in the IAT paradigm (to the extent that the method allows this, see section 4.3). Thirdly, the participants that took part in our experiments came from the central Antwerp area and peripheral West-Flanders. Choosing these two groups guarantees comparability with the Speelman et al. (Reference Speelman, Spruyt, Impe and Geeraerts2013) study, but it also allows us to further investigate whether language attitudes show regional stratification on the side of the listeners as reported in previous work (Impe & Speelman, Reference Impe and Speelman2007; Grondelaers et al., Reference Grondelaers, van Hout and Speelman2011).
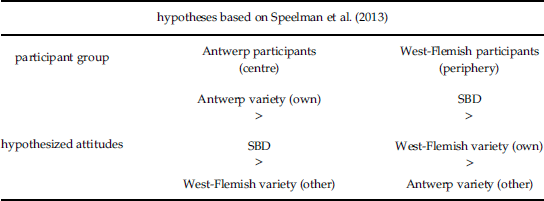
If the P-IAT measures attitudes in a similar way as AP, we expect to find the following pattern in the data, based on what was reported by Speelman and colleagues (Reference Speelman, Spruyt, Impe and Geeraerts2013): all participants prefer the standard variety and their own regional accent over the other group’s regional variety. However, participants from the central Antwerp area are more positive about their own regional accent than about SBD, while the opposite is true for participants from the peripheral area. These hypotheses are summarized in Table 1.
Hypotheses

2 METHOD
The study consisted of two parts: a P-IAT and a questionnaire. After giving informed consent, participants were asked to take part in a P-IAT experiment measuring implicit attitudes. The indirect attitude measurement was followed by a direct one using semantic differential scales and a short questionnaire collecting basic demographic information. Afterwards, participants were fully debriefed about the aims of the research project and the experiment they took part in.
2.1 Participants
In total 192 participants were recruited at a university campus in Kortrijk, West-Flanders, and at a university campus in the city of Antwerp. We decided to use university students as participants in an attempt to introduce a certain level of control over age and social background as these factors are known to have a potential influence on language attitudes (e.g. Ghyselen, Reference Ghyselen2009 for age; Impe & Speelman, Reference Impe and Speelman2007 and Vandekerckhove & Cuvelier, Reference Vandekerckhove and Cuvelier2007 for gender). All participants originated from West-Flanders or Antwerp and were still living there. No linguistics or psychology students were allowed to take the experiment to avoid participants with previous experience with either the method or the topic of the study.
Data of 14 participants had to be discarded, because they came from regions other than West-Flanders or Antwerp. Additionally, 2 outliers were removed from the dataset. Despite the fact that they satisfied the requirements to take part in the study, leaving their data in the analysis influenced results so that effects became significant which otherwise were notFootnote 4 . Hence we deemed it justifiable to remove these participants from the dataset. Data obtained from these two students is excluded from all results reported below. Of the 176 participants included in the analyses, 102 were male and 74 were female with an average age of 20 (SD=1.79, MIN=18, MAX=25).
2.2 P-IAT: Task, Materials, Procedure and Design
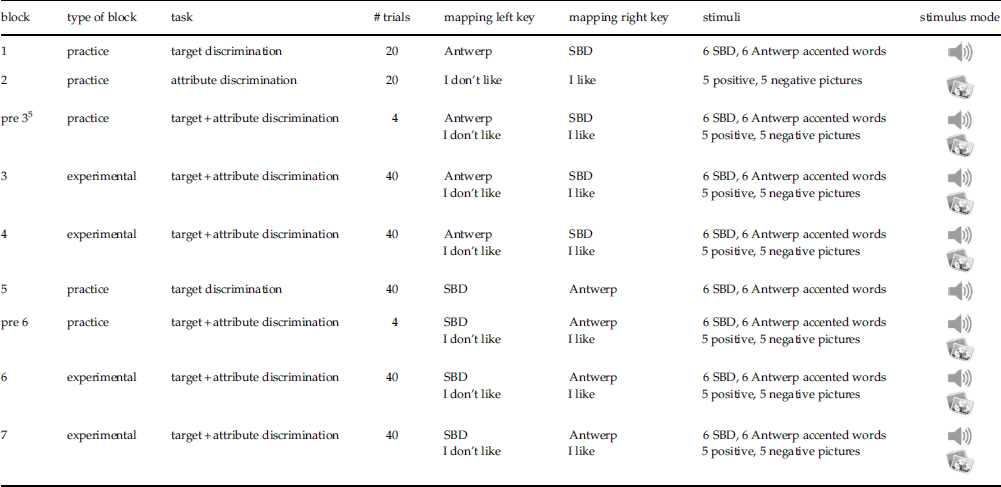
The P-IAT measures the association between a binary target concept and a binary attribute concept by comparing reaction times in a series of categorization tasks. The test used in this study was designed as described in section 1.1 with language variety (regiolect vs. SBD) as the target concept and valence (I like vs. I don’t like) as the attribute concept. A schematic overview of the structure of the P-IAT as used in this experiment can be found in Table 2. The aspects personalizing the P-IAT in this study were, on the one hand, the use of attribute labels referring to the participant’s subjective opinion, and on the other, the omission of error feedback for the attribute stimuli. With these adaptations, we aimed to make sure participants categorized the attribute stimuli based on their personal opinions rather than according to a normative distinction between good and bad. Note that error feedback was retained for the target stimuli. This was done for two reasons. Firstly, we wanted participants to pay attention to the sound samples and the varieties they represented rather than guess. Secondly, participants may have experienced the task of classifying the language varieties under study based on their own opinion as artificial and counterintuitive. Most non-linguists in Belgium conceptualize the standard variety of Dutch as a neatly delineated, codified and homogenous variety (e.g. Lybaert, Reference Lybaert2014). Hence, respondents may have reacted surprised or confused if they had been told to categorize the regional and standard variety in the experiment according to their personal inclination, given that in their conceptualization there is no discussion about what constitutes the standard variety, rendering personal opinions irrelevant.
Schematic overview of the structure of the P-IAT using experiment A (see Table 4) as an example

The reaction times recorded in a P-IAT are traditionally analysed using a scoring algorithm that produces so-called D scores, which are average difference scores between the reaction times in the experimental blocks of the P-IAT (Greenwald, Nosek & Banaji, Reference Greenwald, Nosek and Banaji2003). We calculated D scores using the IAT package in R (Martin, Reference Martin2014) which is based on the algorithm described in Greenwald et al. (Reference Greenwald, Nosek and Banaji2003). D scores were analysed using multiple linear regression. This method was deemed most robust given the slightly unbalanced sample (see Table 4).
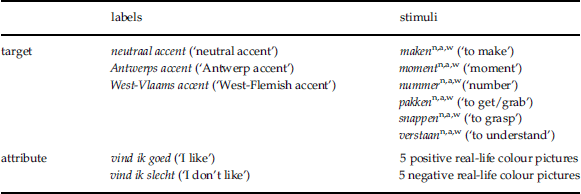
The stimuli and category labels used in the study are summarized in Table 3. All stimuli were selected from the stimulus set used in Speelman et al. (Reference Speelman, Spruyt, Impe and Geeraerts2013). The set of auditory target stimuli consisted of 6 neutral words, each produced in both regiolects and SBD by two professional male speakers matched for age and social background. Both speakers originated from and still live in the region of which they produced the accent. They both have a clear and pleasant voice, which is neither nasal, creaky, whispery nor harsh (Laver, Reference Laver1994; Impe, Reference Impe2010). No differences in speech rate were found between the speakers (Street, Brady & Lee, Reference Street, Brady and Lee1984; Impe, Reference Impe2010) and the recordings were made in a professional radio studio in order to ensure good sound quality. The target stimuli were controlled for duration (M=606.13 ms, SD=29.58), length (two syllables), frequency (based on the Corpus of Spoken Dutch, Schuurman, Schouppe, Hoekstra & Van de Wouden, Reference Schuurman, Schouppe, Hoekstra and van der Wouden2003, and the Football Corpus), familiarity (based on ratings by 94 Belgian students), valence (based on ratings by 35 participants) and degree of colloquiality (measured through phonetic distance between the standard stimuli and the regional stimuli, see Impe (Reference Impe2010) for a detailed description). To ensure the target stimuli were representative for their respective varieties, a small panel of native speakers was consulted (see Impe, Reference Impe2010). Furthermore, no participants had to be excluded from the study based on high error rates or slow responses in the categorization of the target stimuli (see Greenwald et al., Reference Greenwald, Nosek and Banaji2003 for exclusion criteria based on error rates and fast/slow latencies). This suggests that the stimuli were readily identifiable as belonging to the three varieties under study. No participants reported any problems regarding representativeness of the audio stimuli when given the opportunity to comment on any aspect of the experiment at the end of the study. Note that the target stimuli only differ in the accent with which they are produced. Only standard lexical items commonly found in both SBD and CBD were used. No regional or dialectal words figured in the stimulus set.
Stimulus set

arealised with an Antwerp accent
nrealised with a SBD accent
wrealised with a West-Flemish accent
For the attribute stimuli, we used 5 positive and 5 negative real life colour pictures for which norm data have been collected (Spruyt, Hermans, De Houwer & Eelen, Reference Spruyt, Hermans, De Houwer and Eelen2002). All pictures were equal in size (410x308 pixels). The experiment was run on a laptop with a screen resolution of 1366x768 using Affect 4.0 (Spruyt, Clarysse, Vansteenwegen, Baeyens & Hermans, Reference Spruyt, Clarysse, Vansteenwegen, Baeyens and Hermans2010). For the auditory target stimuli, a Jabra UC VOICE 150 MS Duo headset was used.
The labels we selected for the attribute categories are vind ik goed/slecht (literally ‘I find it good/bad’). This is the main feature that personalizes our IAT, in addition to leaving out corrective feedback for the attribute stimuli. For the target categories, the labels Antwerps accent (‘Antwerp accent’), West-Vlaams accent (‘West-Flemish accent’) and neutraal accent (‘neutral accent’) were used. We chose not to label SBD as ‘standard accent’ to avoid normative associations as much as possible.Footnote 6
The experiments were conducted individually in a quiet, dimly lit room. Participants were briefly informed about what was expected of them and signed a consent form if they agreed to participate. They were told that the experiment investigated how people process images and sound. After completing the P-IAT and the explicit attitude measurement, participants were fully debriefed.
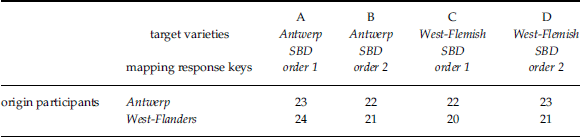
The study comprised four P-IAT experiments which included pairings of SBD with each of the regiolects. The Antwerp variety was included in experiments A and B, while the West-Flemish regiolect featured in experiments C and D (see Table 4). The reason why two experiments were included for each pairing of SBD and one of the regiolects is that the IAT is known to suffer from block order effects: if the first set of experimental blocks are the congruent blocks then the IAT effect tends to be larger (Teige-Mocigemba et al., Reference Teige-Mocigemba, Klauer and Sherman2010). Because in this study we don’t known in advance which is the congruent block for each participant and because it may not be same for all of them, we decided to counterbalance the order of the experimental blocks. In the analysis, results from experiments A and B will be pooled and treated as one experiment, and so will the results from experiments C and D.
Between subject design of the implicit attitude measurement including participant numbers

In the between subject design, summarized in Table 4, each participant was randomly assigned to one of the four experiments. Because the IAT and its variants have been reported to suffer from practice effects (Gawronski et al. Reference Gawronski, Deutsch and Banse2011), we decided to limit the number of P-IATs per participant to a single one.
2.3 Explicit Attitude Measurement and Basic Demographic Information
After completing the P-IAT, participants were presented with two 10 point semantic differential scales. First they were asked to rate the regiolect that featured in their P-IAT. Next, they were presented with a scale to rate SBD. In order to ensure maximal comparability with the association measured in the P-IAT, the adjectives used on either side of the scale were Dutch equivalents of ‘good’ and ‘bad’ and the varieties were labelled in the same way as in the P-IAT experiment. To mimic the personalized aspect of the P-IAT, the question was phrased as ‘What do you think about an [Antwerp accent/West-Flemish accent/neutral (standard) accent]?’
The final element of the study before debriefing was a short questionnaire asking for basic demographic information (gender, age, region of origin, etc.). With the exception of participants’ region of origin, this information was not collected to include in the analyses, but solely to be able to control the demographic background of the participants.
Note that we chose to start the study with the P-IAT rather than with the explicit rating task. This was done in order to avoid the possibility that the rating task would activate certain (normative) associations before participants started the P-IAT, as well as to conceal the aim of the study as much as possible. Respondents were told that they were participating in an experiment about the processing of images and sound in the brain. However, given the fact that the target and attribute categories are clearly communicated during the P-IAT and the direct nature of the explicit rating task that followed afterwards, no doubt many participants will have had some idea of the aim of the study. Nonetheless, multiple participants expressed surprise when given more information about the goal of the study at the end of the experiment. A potential disadvantage of presenting the P-IAT and rating task in this order is a diminished correlation between the results of both experimental tasks. We will come back to this issue in Section 4.2 below.
3 Results
3.1 Implicit Attitude Measurement
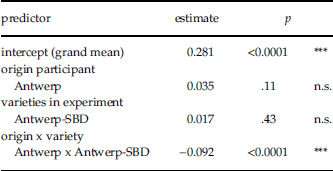
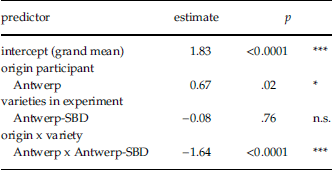
After computing D scores based on the reaction times measured in the experimental blocks, we entered these difference scores into a linear regression analysis as the response variable and participants’ region of origin and language varieties included in the P-IAT as the predictor variables. The resulting model is summarized in Table 5. Note that sum coding was used, so the estimate for the intercept represents the grand mean.
Summary linear regression model of D scores using sum coding

significance codes: 0 ‘***’ .001 ‘**’ .01 ‘*’ .05 ‘.’ .1 ‘n.s.’ 1
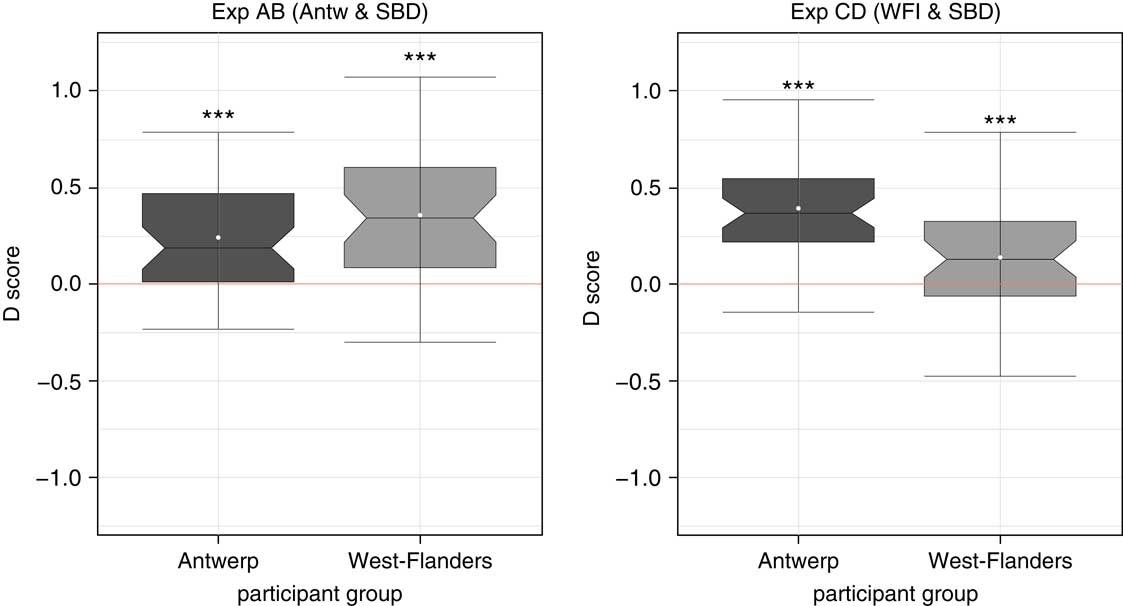
The grand mean reported in Table 5 is significantly different from 0. Its positive value indicates that overall, there is a preference for SBD, given that positive D scores in this experiment represent a stronger association between SBD and liking. This trend is also clearly visible in Figure 2, which summarizes the data per experiment. T-tests with Bonferroni correction confirm that both participant groups in all experiments significantly prefer SBD compared to the regiolects (i.e. for each group, the mean D score is significantly higher than 0. For Antwerp participants in experiment AB: M=0.24, SE=0.04, t(44)=5.88, p<0.0001; for West-Flemish participants in experiment AB: M=0.36, SE=0.05, t(44)=7.43, p<0.0001; for Antwerp participants in experiment CD: M=0.39, SE=0.04, t(44)=10.30, p<0.0001; for West-Flemish participants in experiment CD: M=0.14, SE=0.05, t(40)=2.92, p<0.0001).
Boxplots of D-scores in experiment AB and experiment CD. Positive D-scores indicate a preference for the standard, negative D-scores a preference for the regional variety included in the experiment.
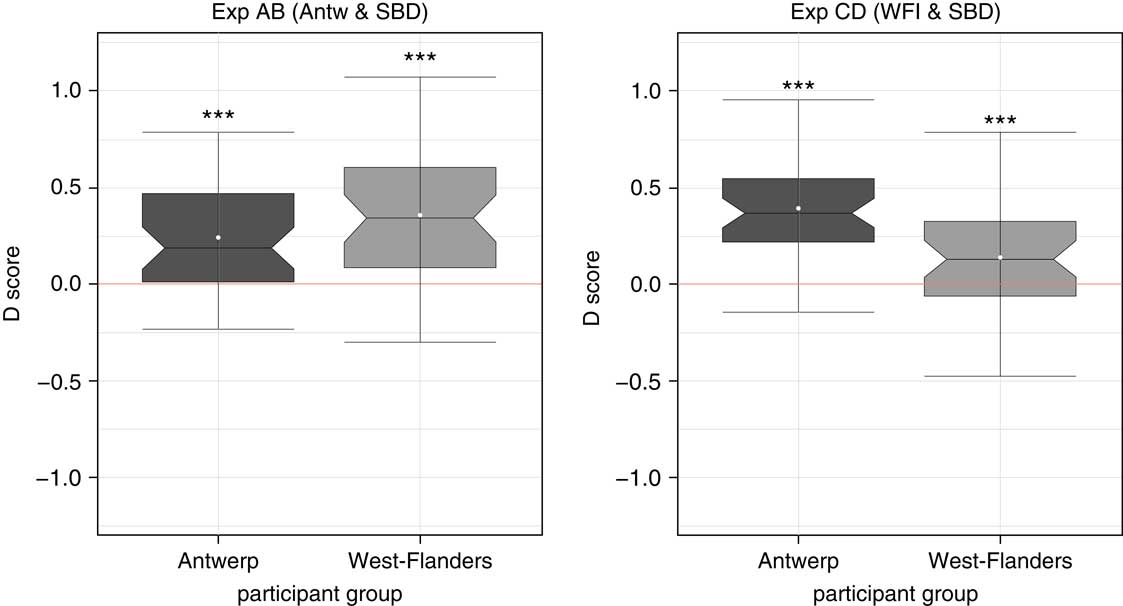
In this study, we are mainly interested in whether there are any differences in attitudes between the Antwerp and West-Flemish participants towards the three varieties presented in our experiments. In other words, our focus lies on the interaction term in the regression analysis (origin x variety), which shows a significant effect (see Table 5). If we tease apart the interaction using post hoc tests (t-tests with Bonferroni correction), we find that Antwerp participants show a stronger preference (M=0.39, SE=0.04) compared to their West-Flemish counterparts (M=0.14, SE=0.05) in the CD experiment which contained the standard variety and West-Flemish regiolect, t (78.83)=4.21, p<0.0001. The difference in D scores between the two participant groups in experiment AB does not reach significance. When the attitudes of the participant groups are compared across experiments, they show a significant pattern of smaller D scores in the experiment containing participants’ own regiolect compared to the experiment containing the other group’s regiolect for both Antwerpians (experiment AB: M=0.24, SE=0.04; experiment CD: M=0.39, SE=0.04; t (87.52)=−2.70, p<0.05) and West-Flemings (experiment AB: M=0.36, SE=0.05; experiment CD: M=0.14, SE=0.05, t(40)=2.92; t (83.94)=−3.27, p<0.01). This pattern can be described as a decrease of participants’ preference for SBD when presented with their own regiolect and hence can be interpreted as an indication of in-group preference. However, the pattern can just as well be characterized as an increase in preference for the standard variety when presented alongside another group’s regiolect which is then perceived as dialectal and triggers a normative reflex. This shows how the results of a P-IAT are essentially contextualized by the specific comparisons of target concepts included in the experiment.
To summarize, the most prominent finding to come out of the implicit attitude measurement is the overall appreciation for the standard variety. In addition, there was a significant pattern of in-group preference (which was also found in the AP study from Speelman et al., Reference Speelman, Spruyt, Impe and Geeraerts2013). However, we did not find any evidence of Antwerp participants preferring their own variety over SBD as was the case in Speelman et al. (Reference Speelman, Spruyt, Impe and Geeraerts2013). Potential explanations for this partial divergence between both studies are explored below, in section 4.1.
3.2 Explicit Attitude Measurement
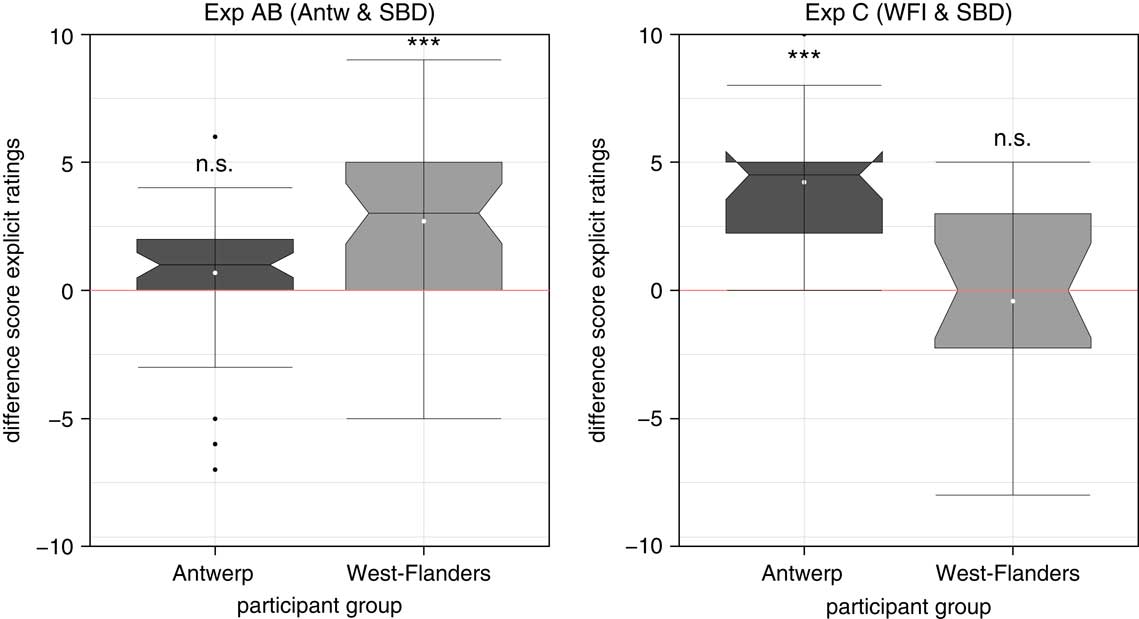
The results of the explicit attitude measurement are summarized in Figure 3 and show a similar pattern to the one in the implicit measurement. Note that due to a technical problem with the display of the question accompanying the rating scale, the explicit attitudes of participants taking the D experiment were not recorded correctly. Hence, the analysis for attitudes towards West-Flemish vs. SBD will solely be based on the data collected in experiment C. Because the D scores used to analyse the implicit attitudes in the P-IAT are a relative measure, a difference score was computed between the rating of SBD and the regional variety presented in the experiment, in order to make both measures as comparable as possible.
Boxplots displaying the difference scores between the explicit ratings for SBD and the regional variety in experiments AB and C. Positive scores indicate a preference for the standard, negative scores a preference for the regional variety included in the experiment.

As for the implicit measurement, the outcome of the explicit measurement was modeled using linear regression (with sum coding). The summary of the linear regression model (see Table 6) shows that the grand mean is significantly larger than 0 which is an indication of a general preference for the standard variety. However, if we break up this grand mean and test whether the means per group in each of the experiments show a significant preference for SBD (using t-tests with Bonferroni correction), we see that this is only the case for West-Flemish participants in experiment AB (M=2.71, SE=0.46, t(44)=286, p<0.0001) and Antwerp participants in experiment C (M=4.06, SE=0.62, t(17)=286, p<0.0001). In other words, we only see explicit attitudes favouring SBD in participants who were presented with the other group’s variety, which could be interpreted as in-group preference or a normative reflex when presented with the other group’s regiolect, just as we observed for the P-IAT results.
Summary linear regression model of explicit attitude ratings using sum coding

significance codes: 0 ‘***’ .001 ‘**’ .01 ‘*’ .05 ‘.’ .1 ‘n.s.’ 1
In the regression model presented in Table 6 Footnote 7 , the interaction between variety and participant origin is highly significant. A closer inspection of the interaction effect using post-hoc tests (t-tests with Bonferroni correction) shows a pattern similar to the P-IAT results. The differences between the two participant groups in both experiment AB (Antwerpians: M=0.78, SE=0.39; West-Flemings: M =2.71, SE=0.46, t(85.51)=−3.20, p<0.01) and experiment C (Antwerpians: M=4.23, SE=0.51; West-Flemings: M=-0.4, SE=0.84, t(31.74)=4.68, p<0.001) are significant. Comparing groups across the experiments, we find that participants from either region show a significantly weaker preference for SBD when presented with their own regiolect, or alternatively, a stronger preference for the standard when confronted with the other group’s variety. (Antwerp participants: M AB =0.78, SE AB =0.39; M C =4.23, SE C =0.51, t(44.96)=−5.35, p<0.0001; West-Flemish participants: M AB =2.71, SE AB =0.46; M C =-0.4, SE C =0.84, t(30.91)=3.23, p=0.01). This pattern can again be interpreted as either evidence for in-group preference or as a normative reflex when presented with the other group’s regiolect.
3.3 Correlation Analysis Implicit-Explicit Attitude Measurement
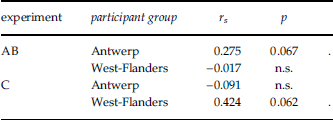
Spearman’s rho was used to compute the correlation between the D scores obtained in the P-IAT experiment and the difference scores collected through the direct ratings of the varieties. Implicit and explicit attitude measurements show a moderate correlation for participant groups which were presented with their own variety (Antwerpians in experiment AB and West-Flemings in experiment C, see Table 7). In both cases the correlation just misses conventional significance levels of p =.05. In conditions where participants were presented with the other group’s variety compared to SBD, results from the implicit and explicit measurements were not correlated.
Correlations between implicit and explicit attitude measures

significance codes: 0 ‘***’ .001 ‘**’ .01 ‘*’ .05 ‘.’ .1 ‘n.s.’ 1
4 DISCUSSION
In this section, we will have a closer look at the results (4.1 and 4.2), as well as take a step back and review the potential of the P-IAT as a measure for language attitudes (4.3). The discussion of the results will be approached in two steps. First, in section 4.1, we will compare the results of both implicit measures, the P-IAT and AP, and discuss why it is that these results do not fully overlap. Secondly, in section 4.2, we focus on the comparison between the implicit and explicit measurements and discuss the correlation between the two. For this last step, we are restricted to the data collected in our own study, so we can only directly compare the P-IAT outcome with the explicit ratings.
4.1 The Implicit Attitude Measurements: P-IAT vs. AP?
When we compare the results of our implicit measurement using the P-IAT to the AP results reported in Speelman et al. (Reference Speelman, Spruyt, Impe and Geeraerts2013), we find that they mostly converge: in both studies participants are more positive towards their own regional variety than that of the other group, and West-Flemish participants prefer SBD over their own regiolect. However, results diverge on one point: we found a general preference for the standard variety over and above any regional varieties in both participant groups, while Speelman and colleagues report Antwerp participants to be slightly more positive towards their own regiolect than towards SBD. No evidence of the latter pattern was found in our data. We discuss three methodological issues that may contribute to this difference, two of them of relating to the structure of the P-IAT and one of a more general nature.
Firstly, despite the use of highly similar participant groups and identical stimuli in both studies, the fact remains that the two studies rely on fundamentally different methods, which may explain the partially diverging results. It has been shown that techniques from the IAT paradigm (such as the P-IAT) and priming methods measure different types of constructs (Gast & Rothermund, Reference Gast and Rothermund2010). While AP measures attitudes towards stimuli (in Speelman et al., Reference Speelman, Spruyt, Impe and Geeraerts2013: auditory fragments representing actual language use), the IAT measures attitudes towards both the stimuli in the experiment (in our study: the same auditory fragments) and the labels representing the target and attribute concepts (in our study: ‘Antwerp accent’, ‘West-Flemish accent’ and ‘neutral accent’). Previous linguistic attitude research has already shown that measuring attitudes towards actual language use and conceptual language varieties represented by a label may not yield the same results (e.g. Bishop, Coupland & Garrett, Reference Bishop, Coupland and Garrett2005; Kristiansen, Reference Kristiansen2010; Grondelaers & Kristiansen, Reference Grondelaers and Kristiansen2013). Coupland & Bishop (Reference Coupland and Bishop2007:85) suggest that attitudes towards labeled varieties are ‘broad language-ideological structures’, but that these can interact with many factors in contexts of actual language use, potentially resulting in different attitudes.
Secondly, and related to the above, there is another structural aspect of the P-IAT that may explain why our results do not exactly match the ones reported in Speelman et al. (Reference Speelman, Spruyt, Impe and Geeraerts2013), namely the measure’s comparative nature. Both AP and the P-IAT measure associations with a certain category in comparison to another category. However, in the P-IAT this is more perceptible because of the labels present in the top corners of the screen throughout the experiment. Hence, it is not unlikely that the continuous presence of the category labels in the P-IAT make this comparative perspective more salient. Considering this explicit comparison of varieties against the background of the normative nature of SBD that resulted from the top-down standardization history of Dutch in Flanders and led to its celebration as the only best language variety (Geeraerts & Van de Velde, Reference Geeraerts and Van de Velde2013), it is possible that the presence of SBD as an explicit category in both experiments AB and CD prevented measuring any positive attitudes towards the regiolects (even though an attempt was made to use a less normative label for SBD). This issue has also been raised by Grondelaers et al. (Reference Grondelaers, van Hout and Speelman2011) and Grondelaers and Speelman (Reference Grondelaers and Speelman2013) in the context of the speaker evaluation paradigm. In that respect, it would have been interesting to compare the results of experiments AB and CD to those of a P-IAT comparing only the regiolects, leaving out SBD. This is something we would like to take up in future research.
Finally, there is always the possibility that the partial divergence of results is not (exclusively) due to the structural nature of the P-IAT compared to AP. There may be hidden variability on the side of the participants that we have no means of controlling for. Additionally, there is a gap of approximately five years between both studies. Even though we would not expect attitudes towards the varieties under study to have shifted dramatically in this time frame, it is another variable that is out of our control.
4.2 Correlations Between the Implicit (P-IAT) and Explicit Attitude Measurements
Overall, the implicit and explicit measurements in this study lead to very similar results. However, we found only moderate correlations or no correlation at all between our implicit (P-IAT) and explicit attitude measurements. Weak correlations between IAT based measures and explicit attitude measures are frequently found in the social psychological literature. Usually correlations between .24 and .37 are reported (e.g. Hofmann, Gawronski, Gschwendner, Le & Schmitt, Reference Hofmann, Gawronski, Gschwendner, Le and Schmitt2005a; Nosek, Greenwald & Banaji, Reference Nosek, Greenwald and Banaji2005; Teige-Mocigemba et al., Reference Teige-Mocigemba, Klauer and Sherman2010). There are several ways to interpret or explain our modest correlations: there could be a number of methodological issues, in addition to an explanation relating to the degree of social sensitivity of the domain under study.
Firstly, the order in which the implicit and explicit measures are presented may influence the strength of the correlation between their outcomes. Bosson, Swann & Pennebaker (Reference Bosson, Swann and Pennebaker2000) report a stronger correlation if the explicit measure precedes the implicit one. In our study, the measures were presented in the opposite order, which may explain why correlations were moderate at best. However, other studies have failed to find such order effects, yet suggest they may occur in case of new, unstable or ambivalent associations, which may or may not apply to the associations measured in our study (Hofmann et al., Reference Hofmann, Gawronski, Gschwendner, Le and Schmitt2005a; Hofmann, Gschwendner, Nosek & Schmitt, Reference Hofmann, Gschwendner, Nosek and Schmitt2005b; Nosek et al., Reference Nosek, Greenwald and Banaji2005). Not only the order of the tasks can influence correlations, approaches to deal with the IAT’s block order effects may play a role as well. Counterbalancing block order to control for block order effects, as was done in this study, can introduce additional error variance in the results which may diminish correlation with explicit measures (De Houwer, Heider, Spruyt, Roets & Hughes, Reference De Houwer, Heider, Spruyt, Roets and Hughes2015).
A second and perhaps more important methodological issue complicating the comparison of the P-IAT results and the explicit rating task is ‘structural fit’ (Payne, Burkley & Stokes, Reference Payne, Burkley and Stokes2008). This term refers to whether or not two methods measure the same type of construct. As pointed out in 4.1, the P-IAT measures attitudes towards both the stimuli and labels used in the experiment, while in our explicit rating task, only labels were evaluated. Hence, the fit between both is not ideal. In addition to structural fit, there may be an issue with the conceptual similarity (Hofmann et al., Reference Hofmann, Gawronski, Gschwendner, Le and Schmitt2005a: 1380) of both our measurements: as discussed earlier, the P-IAT is a relative attitude measure comparing two attitude objects. Our explicit rating task, on the contrary, required absolute evaluations of the varieties.
A third methodological aspect relating to the correlation between our implicit and explicit attitude measurement concerns the phrasing of the question in the explicit rating task: how meaningful was that question for the participants? They were asked how good or bad they thought each of the varieties in the experiment was. Even though none of the participants protested when presented with the rating task or commented on it when given the opportunity after the experiment, it is not inconceivable that this question was not meaningful for them or might have been interpreted in various ways by different participants, leading to small or no correlations between the implicit and explicit measurements.
Another explanation for the modest or lacking correlations between the implicit and explicit measurements may reside in the degree of social sensitivity of the domain under study. Greenwald, Poehlman, Uhlmann & Banaji (Reference Greenwald, Andrew Poehlman, Uhlmann and Banaji2009) have reported differences in implicit-explicit correlations dependent on the domain of research, which they linked to the degree of social sensitivity of those domains. For instance, they report lower correlations for studies in the domain of racial prejudice (black vs. white), which is much more socially sensitive and hence, can lead to impression management on the side of the participants, compared to a domain like consumer preferences, where social sensitivity is much less at play. Unfortunately, not much is known about correlations between IAT results and explicit measures for language attitude studiesFootnote 8 . Besides, social sensitivity of attitudes towards certain language phenomena will be highly dependent on the speech community under study. Yet, social sensitivity could potentially explain why we found moderate correlations for participants rating their own variety, but no correlation whatsoever when measuring their attitudes towards another group’s accent: evaluating the in-group may be less socially sensitive and require less impression management than judging an out-group. This hypothesis would need to be investigated further in future research though.
To conclude this discussion of the correlation between our implicit and explicit attitude measurements, we would like to emphasize that one needs to be careful drawing conclusions about the nature of implicit vs. explicit attitudes based on (lacking) correlations between measures (cf. Gawronski & De Houwer, Reference Gawronski and De Houwer2014). Although a (lack of) correlation between measures could have theoretical significance, the discussion above clearly shows that methodological explanations cannot be excluded.
4.3 The P-IAT as a New Measure for Language Attitudes?
To conclude this discussion we may, with due caution, evaluate the P-IAT as a measure for language attitudes. Based on what is known about the method so far and its use in the current study, what can we conclude about its usefulness as an addition to the traditional array of methods used in linguistic attitude research? This evaluation of the P-IAT will be embedded in a discussion of the IAT paradigm at large.
First and foremost, previous social psychological research has shown that the P-IAT is a reliable and valid measure of implicit attitudes (Nosek et al., Reference Nosek, Greenwald and Banaji2005; Gawronski et al., Reference Gawronski, Deutsch and Banse2011). It is also difficult to ‘fake’ an IAT (although not completely impossible; Steffens, Reference Steffens2004; Fiedler & Bluemke, Reference Fiedler and Bluemke2005; Cvencek, Greenwald, Brown, Gray & Snowden, Reference Cvencek, Greenwald, Brown, Gray and Snowden2010), which makes it an interesting option to study associations participants are unwilling to share explicitly or not aware of. Additionally, in this study, we have been able to use the P-IAT successfully with language stimuli. This gives the method reasonably positive prospects as a new measure for sociolinguists. However, as has already been touched upon earlier in the paper, there are a number of limitations to the P-IAT, some of them shared with the traditional IAT, and certain aspects of the method need further investigation. Issues to be discussed in the following pages include the comparative structure of the P-IAT, practical restrictions on large-scale P-IAT experiments, the selection of suitable stimuli, the need for further research on the categorization mechanisms at play in the IAT paradigm, the relevance of (extra)personal associations for language attitude research, and the importance of the notion of structural fit for attitude research in general.
From both a practical and theoretical point of view, it is important to be fully aware of the P-IAT’s inherently comparative structure. First of all, the IAT only offers relative attitudes without reference to a neutral benchmark. Secondly, the method requires binary target and attribute concepts, which can be inconvenient when, for instance, one wants to study attitudes towards a single language variety without comparison to other varieties. There are alternative methods in social psychology such as the Single Target IAT (Wigboldus et al., Reference Wigboldus, Holland and van Knippenberg2004) and Single Category IAT (Karpinski & Steinman, Reference Karpinski and Steinman2006) which allow non-binary target categories. However, these are incompatible with the use of auditory target stimuli without running into the problem of recoding based on the modality of the stimuliFootnote 9 (Gawronski et al., Reference Gawronski, Deutsch and Banse2011). To avoid this problem, these measures require target and attribute stimuli of the same modality. Yet, if both target and attribute stimuli are presented in auditory form, it is not clear to participants whether they need to be categorized as targets or attributes. To make that clear, there would have to be a difference between both types of spoken stimuli. However, that would create a confound in the experiment. For instance, if you want to measure attitudes towards a single regional variety, you would have to present the spoken attribute stimuli in a different accent. But this second accent would evoke associations of its own, since there is no such thing as an attitudinally neutral language variety.
Despite the P-IAT’s comparative nature being framed above as potentially inconvenient, we do not believe that it necessarily is a bad characteristic, as it may well be a more ecologically valid way of measuring attitudes than using absolute measures. Judgments about language varieties/variants would seem to be intrinsically relative anyway: when an individual judges a certain variety or variant, it will always be against the background of other varieties/variants that individual is familiar with. For example, one may think badly of one’s own regional variety compared to the standard variety, yet in comparison to another regional variety, one’s own variety may be perceived quite positively. Similarly, language users may have positive associations with a certain variety in context A or used for function X, but not in context B or for function Y. Although we have not controlled for that type of contextual factors in the present study, they should certainly be explored in future research. The advantage of the P-IAT’s comparative structure then is that it forces the researcher to make explicit this comparative nature of attitudes which lurks in the background in absolute measurements. When using an absolute measure, participants may well be evaluating a variety compared to another variety, but the researcher has no way of controlling what participants are implicitly comparing that variety against. From this perspective, the P-IAT allows us to get a better grip on the contextual nature of language attitudes.
Fully exploiting the comparative nature of the P-IAT means dealing with certain practical restrictions. If one desires to study more than two languages, varieties or variants, the binary structure of the P-IAT will lead to a multiplication of the number of comparisons and hence experiments to be conducted. This entails the added complication of practice and fatigue effects. That is why it is not recommended to have one participant complete multiple consequent experiments, as there is a risk of the P-IAT effect diminishing or disappearing as a result of these practice and fatigue effects in the second and subsequent tests (Gawronski et al., Reference Gawronski, Deutsch and Banse2011). This means that the number of participants needed for an experiment measuring attitudes towards more than two languages, varieties or variants quickly adds up. These reaction time based tests are traditionally conducted in laboratory settings where participants take the experiment individually in a quiet room in order to avoid any distraction, which means that the use of these measures rapidly becomes highly time-consuming and unattractive for large-scale studies. Yet, previous work in social psychology has shown that it is possible to take the IAT paradigm out of the laboratory and conduct the experiments online (e.g. Friese, Bluemke & Wänke, Reference Friese, Bluemke and Wänke2007; Xu, Nosek & Greenwald, Reference Xu, Nosek and Greenwald2014). Admittedly, the uncontrolled conditions of online P-IATs will entail a number of additional difficulties such as potential distraction due to external, environmental features. But for certain studies, these drawbacks may be outweighed by the advantages, like the potential to reach a larger and more diverse sample of participants and the relative ease of conducting such larger-scale studies (Nosek, Banaji & Greenwald, Reference Nosek, Banaji and Greenwald2002a, Reference Nosek, Banaji and Greenwald2002b).
Another potentially problematic aspect of the P-IAT, both from a practical and a theoretical point of view, involves the stimuli used in the measure. Despite the relative freedom to use any modality of stimuli one desires, it is hard to select suitable stimuli. From a practical perspective, stimuli need to fulfil many requirements: in addition to being good exemplars of the language phenomenon under study, they have to be controlled for several aspects (e.g., valence or any other aspect that may create a confound with the target or attribute categories or can be used for recoding strategies). Fortunately, for several languages norm data are available for concepts like valence or familiarity (see for instance Moors, De Houwer, Hermans et al., Reference Moors, De Houwer, Hermans, Wanmaker, van Schie, Van Harmelen, De Schryver, De Winne and Brysbaert2013 for Dutch). Additionally, it is important that IAT stimuli are very short. The longer the stimuli, the more likely it is that the implicit character of the test will be diminished: participants may respond in a less automatic way, if they get more time to process the stimuli (for a discussion of implicitness defined in terms of automaticity, see De Houwer, Teige-Mocigemba & Spruyt, Reference De Houwer, Teige-Mocigemba, Spruyt and Moors2009). The necessity to use short stimuli also makes it challenging to use the IAT paradigm to study phenomena like syntactic variation which may require longer stimuli. When working with the IAT paradigm, it is also vital to keep in mind that the linguistic phenomena under study have to be represented by small set of short stimuli. This means the stimuli have to be selected and pretested very carefully if one wants to be certain they are representative for the phenomenon under study, especially if the stimuli represent an entire variety as was the case in the study reported here.
The length restriction also entails a theoretical-issue: the language stimuli in a P-IAT are completely decontextualized. Hence, one could question the validity of a language attitudes measure if the language presented in the experiment is decontextualized to such a high degree. However, if a memory component of attitudes is assumed—as it is by many psychologists (Albarracín, Wang & Noguchi, Reference Albarracín, Wang, Li and Noguchi2008) as well as linguists (Preston, Reference Preston2015)—one could argue that what is being measured here is a type of association that functions as a starting point for, or that feeds into the formation of an evaluation of an attitude object in a certain context. Depending on the context in which the attitude object is encountered, the associations measured with the P-IAT can enter into competition with other information present in that context or in memory, and may or may not play a role in the formation of a final evaluation (see for instance Campbell-Kibler, Reference Campbell-Kibler2009, Reference Campbell-Kibler2012: 761-762 for a similar point of view). In that respect, the associations measured with the P-IAT can provide valuable information for sociolinguistic research despite the high degree of decontextualization. Yet, it would be interesting and make the P-IAT even more appealing as a method for sociolinguistic research, if contextual factors could somehow be incorporated into the experiment. The interaction between the social meaning of language phenomena and certain types of contexts of use could be studied more systematically. The limited research available in social psychology on this topic seems encouraging (e.g., Gschwedner, Hofmann & Schmitt, Reference Gschwendner, Hofmann and Schmitt2008 for racial attitudes and the IAT as an anxiety measure), and we are currently conducting experiments to explore the possibility of including situational context in the P-IAT as a language attitudes measure.
An aspect of the P-IAT that is not entirely understood yet is the influence of the category labels used in the test. As indicated above, it has been suggested that the (standard) IAT measures associations towards a combination of stimuli and labels (Gast & Rothermund, Reference Gast and Rothermund2010). However, little is known about the categorization processes at work during the P-IAT. A crucial question in this respect is whether the P-IAT measures associations with categories as represented in participants’ mind or whether it measures attitudes towards ad hoc constructed categories imposed by the labels used in the experiment. This is a topic worth exploring further, if we want to be able to get a better grip on how the IAT works and how/whether it can help us to understand how the social meaning of language variation is processed and represented in the brain.
As noted above, the discussion of the P-IAT in this section is part of a discussion of the IAT paradigm at large. This is justified given that most of the structural and procedural aspects discussed in this section are highly similar for the P-IAT and the traditional IAT. For a discussion of the aspects that set the former apart from the latter, we refer to section 1.1 above where it was explained that the P-IAT aims to avoid measuring extra-personal associations. However, given that this is the first study to apply the P-IAT to measure language attitudes, not much is known about the role of extra-personal vs. personal associations in the domain of language attitudes. Hence, we propose that future research further investigates the role of these concepts in the light of sociolinguistic attitude research, which could be accomplished by comparing results from P-IAT and traditional IAT experiments. Such studies would both enhance our methodological understanding of the linguistic P-IAT compared to the linguistic non-personalized IAT, as well as our theoretical understanding of the concept of (extra-)personal associations and their role in the perception of language variation.
A final issue we would like to come back to is structural fit, which was introduced in section 4.2. We consider structural fit of crucial importance to attitude research. It is vital in order to understand what each attitude measure is most suitable for and how its results compare to other measurements. If we put the measures considered in this paper on a continuum based on what type of construct they measure, we get a picture that matches the trends observed in the results from those respective measures quite nicely. On one extreme of the continuum, we could place AP which measures attitudes towards a collection of stimuli. Somewhere in the middle we find the P-IAT in which these stimuli play a role as well, but the category labels are a very substantial part of the construct that is being measured too. Our explicit rating task would then be the other extreme of the continuum focusing exclusively on labels. However, maybe we should review the position of the rating task slightly, given that participants had just been presented with multiple stimuli during the preceding P-IAT. This means that the structural fit between the P-IAT and explicit rating task is perhaps slightly better than that between the P-IAT and AP. This observation seems to be reflected in the results: those obtained with the P-IAT and explicit ratings show more similar trends than the those from the AP experiment. We believe all attitude research, whether it uses recently developed social psychological measures or more traditional sociolinguistic methods, should consider structural fit carefully when choosing the appropriate methodology for its purposes or comparing results from different measures.
In conclusion, it seems fair to say that the P-IAT (and the IAT paradigm in general) has considerable potential as a measure for language attitudes. Like any method in the field, the P-IAT comes with a number of intrinsic limitations and certain aspects of the method are not yet fully understood. Further exploration of the P-IAT’s possibilities and characteristics is certainly required. Yet, with due caution pending further research, we venture that the P-IAT is a promising new method to add to the (socio)linguist’s toolbox. In no way do we mean to suggest that this social psychological method could replace the existing array of methods at the disposal of the language attitudes researcher, but we firmly believe it can provide interesting insights when used with due consideration of its limitations. As Garrett (Reference Garrett2005: 1257-1258) indicates, the best insights into a language attitude landscape can be obtained by combining a diverse range of methods. We have presented evidence that the P-IAT can be one of those in future language attitude research.
Acknowledgments
The first author holds a PhD Fellowship with the Research Foundation – Flanders (FWO).
We want to thank Adriaan Spruyt for his indispensable advice on both the theoretical and technical side of the experiment design for this study and his feedback on the interpretation of the results. Additionally, we would like to express our gratitude to all participants for their cooperation, as well as to our colleagues in Leuven, Kortrijk and Antwerp for facilitating the practical aspects of the experiments.