Conservation efforts rely on timely assessments of biological diversity in space and time (May Reference May1988). Institutional resources are often insufficient to survey entire communities (Chazdon et al. Reference Chazdon, Colwell, Denslow and Guariguata1998; Chao et al. Reference Chao, Chazdon, Colwell and Shen2005) and alternatives are needed (Kerr et al. Reference Kerr, Sugar and Packer2000). Citizen science, a method rapidly gaining in popularity, can address this problem.
Citizen science consists of scientists collaborating with citizens that do not have the required scientific training to conduct the research themselves (Bonney et al. Reference Bonney, Cooper, Dickinson, Kelling, Phillips and Rosenberg2009). In conservation biology, citizen science is valuable as volunteers can generate large amounts of information in a short period and over large spatial scales. These volunteer-based programs typically undergo data-quality checks and all records are vetted by regional experts prior to approval.
Adequate sampling protocols are key to successful citizen science and must balance data quality and appeal to volunteers. A few decades ago, a standard butterfly surveying technique was developed to increase the scientific value of butterfly surveys conducted by amateurs and scientists – the Pollard transect.
Pollard transects have been extensively used in butterfly ecology to survey butterfly diversity in a standardised fashion (Pollard and Yates Reference Pollard and Yates1993; Sutcliffe et al. Reference Sutcliffe, Thomas and Moss1996; Warren et al. Reference Warren, Hill, Thomas, Asher, Fox and Huntley2001; Kuefler et al. Reference Kuefler, Haddad, Hall, Hudgens, Bartel and Hoffman2008). They enable researchers to control monitoring effort through time and space. However, Pollard transects constrain surveyors within predefined linear transects and limit the number of microhabitats covered to those along the transect. This regimented approach can act as a deterrent to volunteer participation and reduce the rate at which information can be acquired through citizen science.
An unconstrained general microhabitat survey (GMS) is likely to be more appealing to citizen science participants because of its nonrestrictive nature. Surveyors are free to explore neighbouring microhabitats without having to follow a straight path maximising the number of microhabitats visited to detect the largest number of species possible within a locality.
Here, we compare butterfly species richness and species composition obtained by Pollard transects and GMSs to assess whether GMSs yield data comparable to those obtained by Pollard transects.
Ten butterfly hotspots of eastern Ontario and western Québec, Canada were surveyed three separate times with modified Pollard transects immediately followed by GMSs from 13 May 2009 to 7 August 2009. The surveying methods were always carried out under similar weather conditions ideal for butterflies (Kerr et al. Reference Kerr, Sugar and Packer2000). The modified Pollard transects had a size of 200 m by 6 m (Grill and Cleary Reference Grill and Cleary2003) and were walked by two observers always looking inward, one on each side of the transect, at a 10 m per minute pace (Davros et al. Reference Davros, Debinski, Reeder and Hohman2006).
The GMSs covered a radius of ∼500 m and were carried out by two surveyors for 30 minutes during which all distinguishable microhabitats were sampled. For butterflies, changes in plant composition, nectar sources, soil type, and moisture greatly affect their distribution (Natuhara et al. Reference Natuhara, Imai and Takahashi1999). Thus, surveyors carrying out GMSs assessed the subtle changes in these characteristics to determine different microhabitats. Surveyors could survey in any direction within the 500 m radius area without any restriction.
Surveys were always conducted by the same qualified expert lepidopterist and trained research technician on all sampling occasions. Butterfly species were caught with an entomological net, tallied, and identified by sight using field guides. Specimens difficult to identify were compared with specimens from the Canadian National Collection of Insects, Arachnids and Nematodes in Ottawa, Canada and confirmed by the authors of the Butterflies of Canada (Layberry et al. Reference Layberry, Hall and Lafontaine1998). Vouchers were deposited in the collection of the Canadian Facility for Ecoinformatics Research at the University of Ottawa.
We used individual-based species accumulation curves to compare estimated asymptotic species richness by both methods (Chazdon et al. Reference Chazdon, Colwell, Denslow and Guariguata1998; Buddle et al. Reference Buddle, Beguin, Bolduc, Mercado, Sackett and Selby2005). All asymptotes, denoted Sob or Mao Tau (Colwell et al. Reference Colwell, Mao and Chang2004), were computed using EstimateS (Colwell Reference Colwell2009). The asymptotes from each sampling method were compared using a general linear model in R (R Development Core Team 2010) to control for richness differences among sites and the effect of total number of captures on asymptotic richness. Equation (1) represents the linear model for the ANCOVA with random effects for Sob . Site was considered a random effect. Since calculating denominator degrees of freedom in F-statistics for models containing both fixed and random effects is unclear, we used a generally accepted alternative method where likelihood ratios (χ 2) are calculated to report the significance of each effect by sequentially dropping terms from the model. Hence, one model with no variable “Method” was tested against the full model:
 $$ \[{S_{ob}} = {\log _{10}}(Number\,of\,captures) + Method + Site + {\log
_{10}}(Number\,of\,captures) \times Method\] $$
We also considered the identity of the species detected between the surveying methods by comparing the number of species only detected by the GMS and the number of species only detected by the Pollard transect while controlling for the number of captures and the site. Equation (2) represents the linear model for the ANCOVA with random effects for the number of species only detected by one method (denoted U species):
 $$ \[{U_{species}} = {\log _{10}}(Number\,of\,captures) + Method + Site +
{\log _{10}}(Number\,of\,captures) \times Method\] $$
These models were used to assess the significance of their respective terms, notably the surveying technique, for their ability to explain the response variable (Sob or Uspecies ) and its corresponding variability. We used the packages “car” (Bates et al. Reference Bates, Maechler and Bolker2011) and “lme4” (Fox and Weisberg Reference Fox and Weisberg2010) to adjust the linear models.
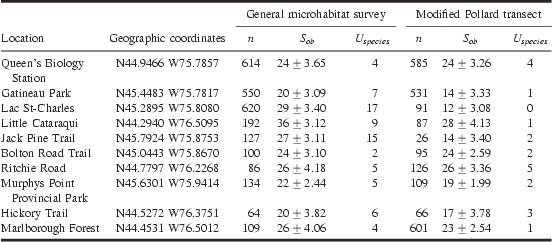
A total of 4913 specimens were observed and 65 butterfly species were detected (Table 1). The GMS detected an average of 25 ± 4.4 (SD) butterflies species while the Pollard transect detected 20 ± 4.5 (SD) species. On average, the GMS detected 8.7 ± 0.3 (SD) species of butterflies that the Pollard transect did not detect and the Pollard transect detected 2.1 ± 0.5 (SD) species of butterflies that the GMS did not detect.
EstimateS outputs for data from the modified Pollard transect and the general microhabitat survey of 10 eastern Ontario and western Québec, Canada sites sampled in 2009.

Sob is the butterfly species richness estimate and the asymptote reached from the corresponding accumulation curve. Uspecies is the number of species only detected by its respective surveying method. Values are means ± SD.
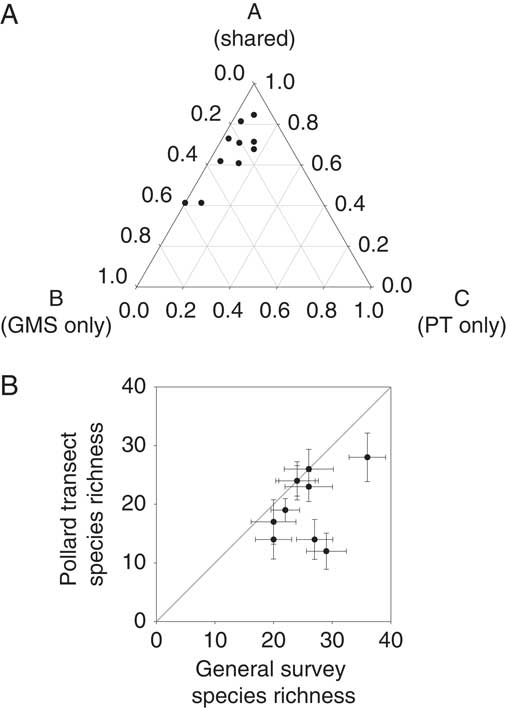
Richness differed between surveying methods (χ 2 = 12.070, df = 1, P < 0.001). We observed higher richness in GMSs compared with Pollard transects for most sites (Fig. 1A). At four of the survey sites, up to 60% of all species detected were only discovered by carrying out a GMS. The GMSs detected marginally more species for three sites and detected comparable estimates of butterfly species richness to the Pollard transect for the remainder of the sites. The interaction between surveying methods and the total number of captures was not significant and was removed from the full model. The total number of captures was significantly related to richness (χ 2 = 8.005, df = 1, P = 0.005).
(A) Estimated butterfly species richness from 10 eastern Ontario and western Québec, Canada sites recorded by general surveys (x-axis) and Pollard transects (y-axis) in 2009. Error bars are SDs and the diagonal line represents unity. (B) Proportions of species recorded in both surveys (A), only in general microhabitat surveys, GMS (B) and only in Pollard transects, PT (C), such that A + B + C for any point on the plot sums to one. Axis labels are located at the maximum value for that axis.
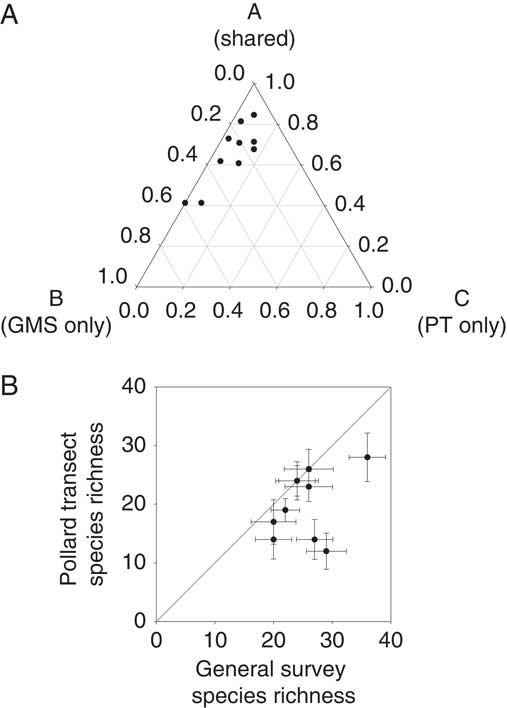
The number of species only detected at a given site by one surveying method differed between the Pollard transect and the GMS (χ 2 = 10.866, df = 1, P < 0.001). Note that the majority of species are shared between surveys at most sites, but for some sites, large proportions are found only using GMSs (Fig. 1B). The interaction between the number of species only detected at a given site by one surveying method and the total number of captures was not significant and was removed from the full model. The total number of captures was significantly related to the number of species only detected at a given site by one surveying method (χ 2 = 4.562, df = 1, P = 0.032).
In this paper, we show that GMSs generally found more species per individual detected compared with standard Pollard transects. GMSs also consistently detected a more complete portrait of local butterfly richness for the same number of individuals captured.
The realised search area covered by GMSs was likely comparable to or slightly larger than the area of the modified Pollard transects given their similar time constraints. However, higher species detection of GMSs was likely achieved by enabling surveyors to go in all cardinal directions in order to visit a greater variety of microhabitats and detect more species of butterflies as opposed to restricting the surveyors to the microhabitats along a transect line.
Despite the fact that the surveys were carried out by a lepidopterist and a trained technician, these results can apply to volunteers. Citizen scientists tend to be very capable surveyors and often have years of experience. Taxonomic identification of certain species requires expertise, but there are numerous user-friendly butterfly keys and field guides available. There is evidence that volunteers can perform just as well as professionals, although one must be cautious about data quality (Crall et al. Reference Crall, Newman, Stohlgren, Holfelder, Graham and Waller2011). Using years of experiences of the surveyors as a covariate to assess the importance of experience in species detection could also be valuable for data quality control, beyond vetting procedures (Burke et al. Reference Burke, Fitzsimmons and Kerr2011).
These results are pertinent in light of current large-scale citizen science efforts monitoring butterflies addressing the impacts of global changes on butterfly distributions (Kühn et al. Reference Kühn, Feldmann, Harpke, Hirneisen, Musche and Leopold2008; Opler et al. Reference Opler, Lotts and Naberhaus2011). The execution of such large-scale research requires a strong volunteer base and reducing survey requirements while simultaneously yielding more species may increase efficiency and public participation.
Ecological assessments relying on the participation of volunteers could benefit greatly from using GMSs because they detect more species, are less restrictive, and thus more appealing to amateurs than Pollard transects. We suggest the use of GMSs in citizen science projects as they are not restrictive, they encourage more participation by appealing to a wider audience, and the quality of the data collected meets the standards of large-scale research using citizen science data. However, through time and familiarity of this process, volunteers should be encouraged to use modified Pollard transects thus allowing researchers to address additional ecological research questions.
Acknowledgements
The authors would like to thank Jeremy Kerr for providing project resources as well as Ryan Burke and Peter Hall for their effort during fieldwork over the 2009 summer. The authors extend their thanks to Ross Layberry and Donald Lafontaine for butterfly identifications. Fieldwork for this project was funded by an Early Researcher Award from the Ontario Ministry of Research and Innovation to Jeremy Kerr. This manuscript is greatly benefited from comments by Christopher Hassall and Thomas Hossie.