





1. Introduction
One of the primary methods for plasma heating is the injection of high-energy atomic beams through a magnetic confinement field (see Hemsworth & Boilson Reference Hemsworth and Boilson2017). Currently, neutral atoms are obtained by passing ion beams of hydrogen isotopes through a gas target. At energies exceeding 200 keV particle–1, a rapid decrease in the neutralisation efficiency of positive ions is observed, dropping to nearly zero (see Koch Reference Koch2004; Hopf et al. Reference Hopf, Starnella, den Harder and Fantz2021). In contrast, for negative ions, a high neutralisation efficiency, of around 60 %, is maintained even in the high-energy range (see Koch Reference Koch2004; Toigo et al. Reference Toigo2015). Consequently, negative ions are considered the primary ion type for use in experimental thermonuclear reactors (see Hemsworth & Boilson Reference Hemsworth and Boilson2017).
The neutralisation efficiency directly determines the energy balance of a fusion reactor. According to estimates in Pamela et al. (Reference Pamela, Bécoulet, Borba, Boutard, Horton and Maisonnier2009), for DEMO, the recirculating power can reach hundreds of megawatts – more than a third of the total electricity generated. Given the low efficiency of power supplies (20 %–30 %), the overall efficiency of ITER does not exceed 30 % (see Starnella, Hopf & Maya Reference Starnella, Hopf and Maya2022). This makes the gas neutraliser unacceptable for DEMO and ITER. Therefore, the development of alternative neutralisation methods, including photoneutralisation, is essential for future fusion reactors.
Due to the limited efficiency for high-energy beams, alternative neutralisation methods are being actively investigated. One possible approach is a plasma neutraliser, the development of which is being carried out, in particular, at the Budker Institute of Nuclear Physics of the Siberian Branch of the Russian Academy of Sciences (BINP SB RAS). The neutralisation efficiency of this method can reach values of approximately 85 % (see Dimov, Ivanov & Roslyakov Reference Dimov, Ivanov and Roslyakov1980). This approach is based on the passing of a beam of negative ions through a target of dense low-temperature plasma. The main advantage of plasma over a gas target lies in the significantly higher cross-sections for the detachment of the excess electron, which ensures the increase in the neutralisation efficiency.
The most promising approach considered is the photoneutralisation method, based on the photodetachment of an electron from a negative hydrogen ion (see Fink Reference Fink1975). This method eliminates parasitic ionisation processes of neutral atoms. Theoretically, this allows a neutralisation efficiency close to 100 % to be achieved, since there is no fundamental upper limit. Consequently, the efficiency of converting accelerated ions into fast atoms is significantly increased. Hence, the overall energy efficiency of the injection systems for a fusion reactor also increases (see Hemsworth & Boilson Reference Hemsworth and Boilson2017). Currently, various configurations of photon traps are being developed, each employing its own principle for confining laser radiation.
The first photon traps were based on the principle of multiple radiation enhancement in an optical cavity, implemented as a Fabry–Pérot interferometer (see Chaibi et al. Reference Chaibi, Simonin, Blondel, Cabaret, Delsart and Drag2009; Fassina et al. Reference Fassina, Pretato, Barbisan, Giudicotti and Pasqualotto2015; Simonin et al. Reference Simonin2019). Structurally, these systems were realised as resonators composed of highly reflective mirrors. Laser radiation is confined within the resonator, where it intersects the negative ion beam. The efficiency of the interaction is determined by the stored intracavity power
 $P_{\rm{stored}}$
. For photoneutralisation of high-power beams (energy
 $\sim$
1 MeV, current
 $\sim$
several tens of amperes), characteristic of fusion reactors such as ITER or DEMO, the required stored power is of the order of megawatts. Given a typical available input laser power
 $P_{\rm{in}} \sim 100\,W$
, the necessary power amplification of the resonator is
 \begin{align} G = \frac {P_{\text{stored}}}{P_{\text{in}}} \approx \frac {10^7}{10^2} = 10^5 .\end{align}
According to the theory of passive optical resonators, under resonance conditions, the maximum amplification is determined by the mirror reflectivity
 $R$
and is given by
 $G_{max}=1/(1-R)$
(see the derivation in Friedl, Borkenhagen & Fantz Reference Friedl, Borkenhagen and Fantz2025). From the requirement
 $G \geqslant 10^5$
, we obtain
 \begin{align} \frac {1}{1-R} \geqslant 10^5 \implies 1-R \leqslant 10^{-5} \implies R \geqslant 0.99999 .\end{align}
The experimental feasibility of this approach is confirmed in Friedl et al. (Reference Friedl, Borkenhagen and Fantz2025), where, with a mirror reflectivity of
 $R = 0.99995$
(giving a theoretical amplification limit of
 $G_{max} \approx 20\,000$
), a stable power amplification of 7000 was achieved, along with an intracavity power of 1.67 kW at an input power of only 240 mW. This demonstrates the fundamental feasibility of creating ultra-high-finesse resonators for photoneutralisation; however, to achieve the megawatt-level powers required in fusion reactors, mirrors with even higher reflectivity (
 $R\gt 0.99999$
) are necessary.
Furthermore, stringent requirements for laser spectral stability
 $(\Delta \lambda / \lambda \lt 10^{-13})$
were imposed (see Fiorucci & Fassina Reference Fiorucci and Fassina2022), where
 $\lambda$
is the wavelength of the laser radiation and
 $\Delta \lambda$
is the change (instability) of the wavelength (deviation from the set value). This is necessary to maintain resonance conditions over a high number of passes. Additional technological complexities are associated with the need to ensure high spatial and thermal stability of the entire optical system (see Fiorucci et al. Reference Fiorucci, Feng, Pichot and Chaibi2015).
As a more practical alternative, researchers at BINP SB RAS proposed the concept of a non-resonant trap with adiabatic photon confinement (see Popov et al. Reference Popov, Burdakov, Ivanov and Kotelnikov2015). This approach offers the key advantage of significantly less stringent requirements for laser spectral stability and optical quality, greatly simplifying technical implementation and paving the way for a high-efficiency photoneutraliser.
2. Non-resonant photon trap with adiabatic confinement
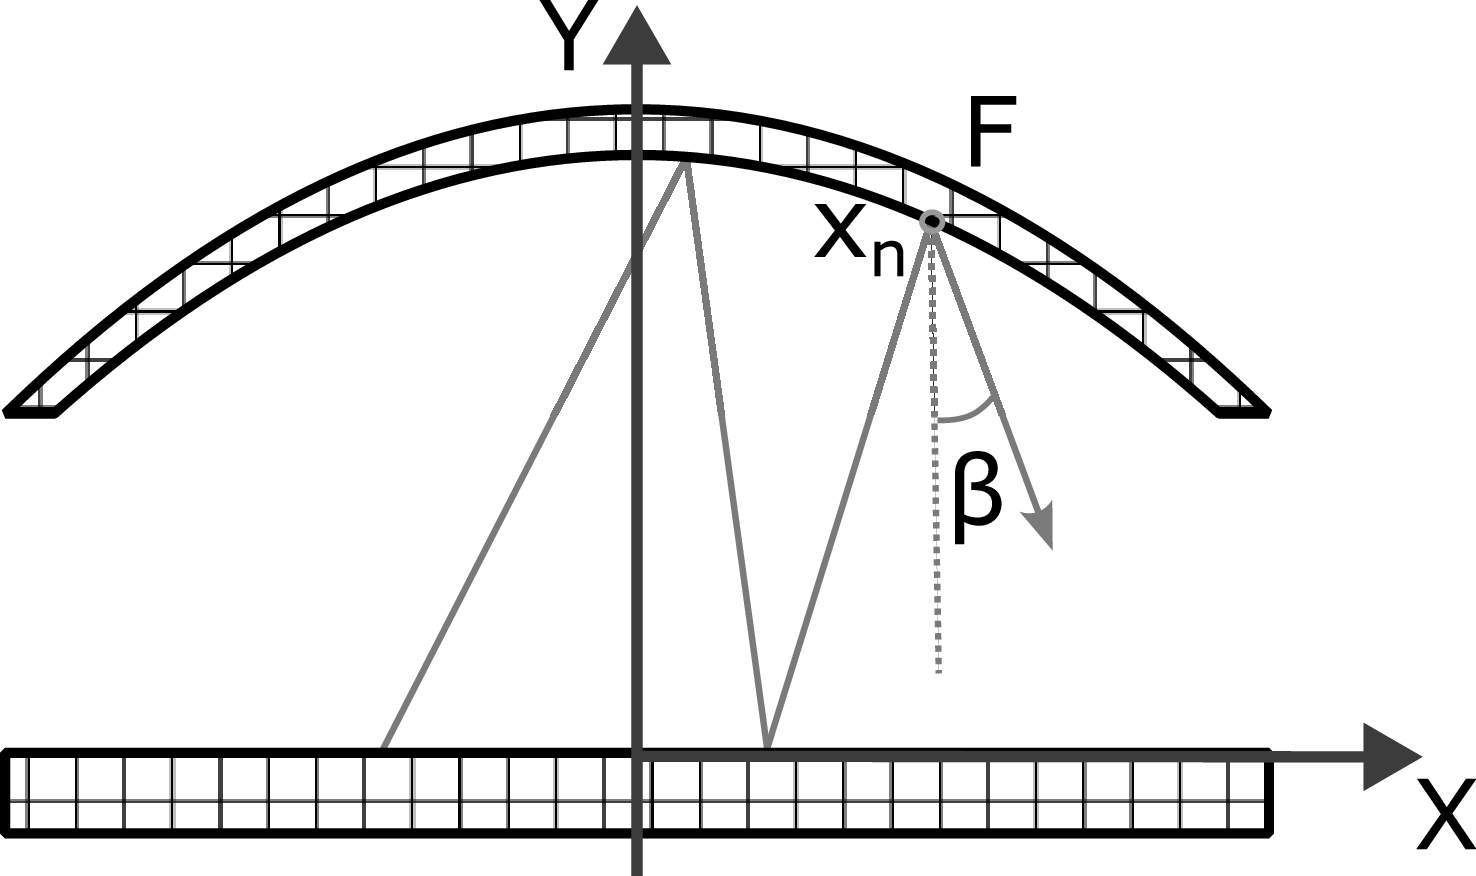
The concept of a non-resonant photon trap is based on the principle of multiple reflections of laser radiation in a system of mirrors with complex geometry. The confinement principle is demonstrated in figure 1. Due to the curvature of the upper mirror, a photon, upon reflection from the mirror, receives an increment of horizontal momentum directed toward the
 $Y$
-axis. The small distance between the mirrors compared with the radius of curvature ensures adiabatic motion along the lower mirror and confinement of photons near the common normal to the mirrors. A detailed theoretical substantiation of this confinement model is presented in Popov et al. (Reference Popov, Burdakov, Ivanov and Kotelnikov2015, Reference Popov, Atlukhanov, Burdakov and Ushkova2016, Reference Popov, Atlukhanov, Burdakov, Ivanov, Kasatov, Kolmogorov, Vakhrushev, Ushkova, Smirnov and Dunaevsky2018a
).
Schematic diagram of a non-resonant adiabatic photon trap.

The region accessible to a photon is determined by the condition of conservation of the adiabatic invariant, which is expressed by the following relation:
 \begin{align} F(x) \cos (\beta ) = \text{const}. ,\end{align}
where
 $F(x)$
is the local distance between the mirrors, and
 $\beta$
is the angle of deviation from the common normal. This relation ensures quasi-periodic motion of the photon in the direction perpendicular to the Y-axis (see figure 1).
The first stage of experimental validation of the concept was performed using two dielectric mirrors (see Popov et al. Reference Popov, Atlukhanov, Burdakov and Ushkova2016). Their reflecting surfaces had a spherical shape with a radius of curvature of 250 mm and a diameter of 25 mm. According to manufacturer’s data, the mirror reflectivity was
 $R$
= 0.999. Experimental measurements showed that the highest photon accumulation efficiency achieved, defined as (1 –
 $R$
), was 3
 $\times$
10
 $^{-3}$
. The remaining mirror parameters were not characterised in this study.
To further investigate the principle of photon confinement, an improved set-up was used, consisting of two mirror modules measuring
 $250 \times 50$
mm. The design of each module comprised a combination of segments with different geometries: the central part had a cylindrical shape, while the edge regions were made in the form of spherical surfaces. This geometry was developed to create the conditions necessary for efficient multiple reflections of the laser beam.
In parallel, pioneering studies of the photoneutralisation efficiency for negative hydrogen (
 $H^{-}$
) and deuterium (
 $D^{-}$
) ion beams were conducted using this system. During the experiments, record-high neutralisation coefficients were achieved: 93 % for
 $H^{-}$
and 98 % for
 $D^{-}$
at a beam energy of
 $6.5$
keV (see Popov et al. Reference Popov, Atlukhanov, Burdakov, Ivanov, Kasatov, Kolmogorov, Vakhrushev, Ushkova, Smirnov and Dunaevsky2018a
). These results clearly demonstrated the high potential for applying non-resonant photon traps.
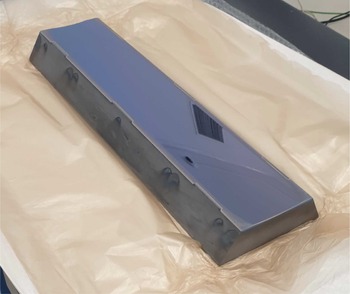
Following these pioneering studies, an upgraded, larger-scale trap was developed for operation with high-energy beams. The key element of this upgrade was the creation of a monolithic mirror structure, shown in figure 2.
Monolithic mirror of the upgraded photon trap.

The mirrors were fabricated on a substrate of single-crystal silicon. This material exhibits a low thermal expansion coefficient (4.15
 $\times$
10
 $^{-6}$
K
 $^{-1}$
), which ensures geometric stability when heated in the range of 20–300
 $^\circ$
C. With high thermal conductivity (1.38 W m
 $^{-1}$
K
 $^{-1}$
), the material facilitates efficient heat dissipation. Finally, the material exhibits excellent polishability, which is necessary to achieve low surface roughness and high precision of the optical surface. Due to this combination of properties, single-crystal silicon is a promising material for high-precision optical systems operating under high thermomechanical loads.
A distinctive feature of the new design is the modified geometry of the reflecting surface, which integrates a central cylindrical zone (radius of curvature 1000 mm) with smoothly transitioning peripheral sections of toroidal shape (the minor radius of the torus is also 1000 mm). This configuration, in contrast to the composite prototype, ensures a more uniform distribution of the photon flux density across the entire working surface. This enhances confinement efficiency by eliminating local optical inhomogeneities at the segment interfaces.
A through hole with a diameter of 500
 $\unicode{x03BC}$
m is made in the mirror to allow laser radiation to be introduced into the optical system of the trap. The reflecting surface is coated with a specialised multilayer dielectric coating consisting of more than 20 alternating thin-film layers. According to the manufacturer’s specifications (NPO ‘LUCH’), this coating provides a reflectivity of up to
 $R \approx$
0.9995 in the spectral range near the operating wavelength of 1070 nm.
The transition to a monolithic mirror structure with optimised toroidal–cylindrical geometry is aimed at improving the stability, efficiency and scalability of the system. This is necessary for operation with charged particle beams (energy range of 30–130 keV), where prolonged confinement and intense interaction of optical radiation are required.
3. Method of measurement of the laser radiation accumulation efficiency
A fundamental characteristic of a photon trap is the integrated accumulation efficiency, defined as the ratio of the radiant power stored in the trap to the power of the injected radiation. In the non-resonant confinement model, this parameter, the accumulation coefficient
 $B$
, directly depends on the integrated optical losses per reflection (1 –
 $R$
), where
 $R$
is the reflectivity.
The corresponding dependence is given by
 \begin{align} B = \frac {1}{1-R} .\end{align}
It should be noted that, unlike the mechanisms of resonant (see Fiorucci et al. Reference Fiorucci, Feng, Pichot and Chaibi2015) or nonlinear (see Fassina et al. Reference Fassina, Fiorucci, Giudicotti and Vincenzi2020) energy accumulation, the presented dependence does not require accounting for the influence of the frequency and spatial spectra of the injected radiation (see Kovari & Crowley Reference Kovari and Crowley2010). In this model, the accumulation efficiency is determined solely by reflective losses in the cavity. For comparison, in resonant accumulation mechanisms, it depends significantly on the frequency detuning and the modal structure of the field. In the case of nonlinear confinement, the parameters of the nonlinear response of the medium play a critical role.
To measure (1 –
 $R$
), we employed a technique based on recording the steady-state level of stored power and analysing the temporal dynamics of radiation decay after injection ceases. The key point is the introduction of an attenuator with a known attenuation coefficient
 $\alpha$
into the optical path, which makes it possible to vary the total losses in the system and separate the contribution of additional losses (from the attenuator) from the intrinsic losses of the trap.
The first approach, measurement of the steady-state level, is based on the inverse proportionality between the radiation power in the trap (photon density
 $n(z)$
) and the total losses per pass (1 –
 $R$
) under steady-state conditions. By sequentially introducing attenuators with different attenuation coefficients (
 $\alpha _s$
and
 $\alpha _k$
) and measuring the corresponding steady-state power levels (proportional to
 $n(z,\alpha _s)$
and
 $n(z,\alpha _k)$
), the intrinsic reflectivity
 $R$
can be calculated from the power balance relation (see Popov et al. Reference Popov, Atlukhanov, Burdakov and Ushkova2018b
)
 \begin{align} 1-R = \frac {n(z,\alpha _s)\alpha _s - n(z,\alpha _k)\alpha _k}{n(z,\alpha _s) - n(z,\alpha _k)} .\end{align}
The second approach is the analysis of temporal decay. After abrupt cessation of radiation injection, the evolution of the stored photon density is described according to the filling model
 \begin{align} n(z,t) \propto \exp \left (-\frac {t}{\tau }\right )\!, \end{align}
where
 $\tau$
is the characteristic decay time, which is inversely proportional to the total losses per pass:
 $\tau \propto$
1/(1 –
 $R$
). Here,
 $\alpha$
is the additional fractional power loss per pass introduced by the attenuator. By comparing the decay times
 $\tau$
(without an additional attenuator) and
 $\tau _a$
(with attenuator
 $\alpha$
), the contribution of the intrinsic trap losses can be isolated
 \begin{align} 1-R = \frac {\alpha }{({\tau }/{\tau _a}) - 1 + \alpha } .\end{align}
The combined technique proposed in Popov et al. (Reference Popov, Atlukhanov, Burdakov and Ushkova2018b
) ensures accurate and self-consistent determination of the integral reflectivity
 $R$
. Furthermore, it enables a detailed analysis of the loss structure in the system. These dependencies are universal in nature under the condition of small losses per longitudinal quasi-period (see Popov et al. Reference Popov, Atlukhanov, Burdakov and Ushkova2018b
). Moreover, they are applicable for the diagnostics of optical traps of various geometries. They make it possible to determine the critical parameters of a photon trap prior to its use in experiments.
4. Experimental stand
The mirror assemblies are mounted on a common massive duraluminium base, which rests directly on the optical table and is secured using slots matching the M6 threaded holes. The distance between the reflecting surfaces of the assemblies is
 $L=380$
mm and is determined by the base geometry. This value is dictated by the limited free space on the optical table, as well as the need to accommodate additional elements of the laser input system and its monitoring. During experiments aimed at determining the integral reflection coefficient, the distance between the mirrors remained unchanged. The alignment was performed using the base with a calliper; the uncertainty in setting the distance was
 $\pm 0.05$
mm. The mirror positions did not vary during the measurements.
For conducting the experiments, a specialised experimental set-up was developed, the general optical scheme of which is shown in figure 3.
Optical scheme of the experimental set-up: 1 – fibre laser; 2,5 – polariser; 3 – Pockels cell; 4 – alignment mirrors; 6 – periscopic beam elevator; 7,14 – fast avalanche photodetectors; 8,10 – cameras; 9 – beam expander; 11 – focusing lens; 12 – photon trap; 13 – wire attenuator.

Photon trap: general view of the assembled mirror structure on the optical table (side view). Two mirror modules (left and right) are visible, each mounted on its own stand. The laser radiation is introduced from the right side (not shown in this view) and is confined between the mirrors.

The experimental technique is based on the use of a high-speed electro-optical switch to interrupt the injection of radiation into the trap. The radiation source was an ytterbium fibre laser ‘YLS-U’ (1), generating at a wavelength of 1074 nm with a maximum output power of up to 4 kW.
Laser radiation (1) was passed through a polariser (2) with a working angle of approximately 45
 $^\circ$
. The polarised radiation was then directed into a Pockels cell (3) and reflected by a high-reflection mirror (4) positioned directly behind it.
With zero voltage applied to the Pockels cell electrodes, the polarisation state of the radiation on the return path remained unchanged. As a result, the radiation completely passed through the polariser (2) in the reverse direction, preventing radiation from entering the trap.
When a high-voltage pulse was applied and the Pockels cell was switched to the quarter-wave plate mode, a double polarisation transformation occurred. Linearly polarised radiation was converted into circularly polarised radiation on the path to the mirror and back into linearly polarised radiation, but with the polarisation plane rotated by 90
 $^\circ$
relative to the original. This orthogonally polarised radiation was deflected by the polariser (2) and directed into the trap. A subsequent polariser (5), installed in the beam path, increased the switch contrast ratio to several thousand.
Injection of laser radiation into the photon trap (12, see figure 4) is performed through a special entrance hole in one of the mirrors. To match the trajectory of the beam with the geometry of the set-up and ensure precise positioning, a periscopic system (6) based on alignment mirrors (4) is used. Subsequent transformation of the beam includes its modification by an adjustable beam expander (9) and focusing by a lens (item 11). This lens reduces the beam diameter to a value not exceeding 500
 $\unicode{x03BC}$
m, which is a necessary condition for efficient radiation injection into the confinement region.
Visual monitoring is performed by two cameras of the same model, ‘DAHENG IMAGING’ MER2-503-23GM/C-P series. Camera (10) monitors the position of the laser spot relative to the entrance hole. Camera (8) records the intensity distribution of the radiation on the surface of one of the mirrors.
Diagnostics of the processes in the trap are provided by a detection system based on high-speed avalanche photodiodes ‘APD-430’ (Thorlabs) (7, 14). Photodiode (7), installed on the radiation input line, records the turn-on and turn-off edges of the injecting beam. On the opposite side of the trap, photodiode (14), positioned behind an aperture, detects a fraction of the stored radiation, allowing the temporal dynamics of the radiant power in the system to be measured.
A wire attenuator (13) (figure 5) was used as a controllable loss element, which could be positioned in the intermirror gap of the trap. It is made in the form of a metal frame with a stretched tungsten wire of 17
 $\unicode{x03BC}$
m in diameter.
Wire attenuator positioned in front of the trap mirror, showing the general view of the attenuator frame and a close-up of the tungsten wire.

The attenuation coefficient (
 $\alpha$
) in the geometrical approximation is defined as the ratio of the wire diameter (
 $d_w$
) to the grating pitch (
 $D$
)
 \begin{align} \alpha = \frac {d_w}{D} .\end{align}
To perform the measurements, three attenuators were manufactured, each with a different grating pitch
 $D$
between the wire elements. According to (4.1), these pitches provided a set of different values of the attenuation coefficient. Their calculated and measured parameters are given in table 1.
Measured attenuation coefficients for different attenuator configurations.

Table 1. Long description
A table comparing attenuation coefficients for different attenuator configurations. The table has three rows and two columns. The columns are labeled ‘Attenuator’ and ‘Value x 10^-4’. The row labels under the ‘Attenuator’ column are alpha subscript 1, alpha subscript 2, and alpha subscript 3. The values under the ‘Value x 10^-4’ column are 14.28, 13.94, and 5.58 respectively.
5. Measurements of the retention time of laser radiation in a mirror trap
To investigate the photon confinement efficiency, we performed a series of experiments to record the stored radiation using wire attenuators. The measurements were carried out at different angular apertures of the focused laser beam. The size of the confinement region was monitored using camera (8) (figure 3), which recorded the spatial distribution of radiation in the aperture of one of the mirrors.
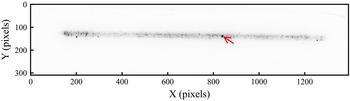
Figure 6 shows an image of the studied region with a characteristic scattering pattern. The sharp boundaries of the light trajectories are caused by the existence of an adiabatic invariant in the system. Local dark spots may be associated with parasitic scattering on microdefects of the surface, caused by imperfections in the optical coating and substrate roughness. Additionally, pattern formation may be influenced by effects related to the laser beam waist.
Parasitic light scattering on the mirror surface.

Photon accumulation was recorded by an avalanche photodiode (13), both with and without the use of attenuators, at a constant laser power (of the order of 150 W). The duration of the injection pulse was set by a high-voltage pulse generator, which ensured the formation of pulses with sharp edges. Figure 7 shows the temporal dynamics of the signal from this photodiode, as well as the signal from photodiode (7) (the purple curve in figure 7), visualising the turn-on and turn-off edges of the injected laser radiation.
Oscillograms reflecting the photon accumulation process in the trap:  — accumulated radiation without attenuator;
 — accumulated radiation with
 $\alpha _1$
;
 — accumulated radiation with
 $\alpha _2$
;
 — accumulated radiation with
 $\alpha _3$
;
 — laser monitor signal.

On the plateau of the injected radiation signal (line ‘Laser’, figure 7), oscillations are observed, caused by the non-stationary pump of the storage device. These fluctuations affect the recorded signal differently for different absorption levels. Consequently, direct comparison of signal amplitudes to estimate the stored power density is incorrect, since the measured response contains both a contribution from the confinement efficiency and modulation of the laser radiation.
With this in mind, a method based on the analysis of the radiation decay decrement after the cessation of injection was chosen to evaluate the accumulation efficiency. As shown in figure 7, after the laser is turned off, a region of exponential signal decay is observed on the oscillograms. This region is free from artefacts associated with source instability, which makes it possible to directly determine the intrinsic photon decay time constant in the trap. The insertion of an attenuator, as can be seen in the same figure, reduces the steady-state level of stored radiation according to its absorption coefficient, without affecting the nature of the exponential decay. Thus, comparing the exponential decay rate of the signal when using different attenuators provides a quantitative estimate of their contribution to the total losses, excluding the influence of injection power fluctuations. To avoid any influence of the laser shut-off transient, the exponential fitting was performed after the laser monitor signal had returned to zero.
The exponential nature of the decay is confirmed by the data presented in figure 8, where, on a logarithmic scale, the time dependence of the signal is approximated by a straight line. The approximation results (indicated by markers) are superimposed on the original oscillograms; good agreement is observed between the experimental data and the linear model.
Oscillograms of photon decay on a logarithmic scale. Experimental curves are shown by lines of different types; the exponential approximation results are indicated by markers.

Figure 8. Long description
A line graph showing signal amplitude on a logarithmic scale over time with different attenuators and their approximations. The horizontal axis represents time in microseconds, ranging from 7 to 13 microseconds. The vertical axis represents signal amplitude on a logarithmic scale, ranging from 10^-5 to 10^0. The graph includes five data series: one without an attenuator, and four with different attenuators (alpha 1, alpha 2, and alpha 3) and their approximations. The data series without an attenuator is represented by a solid blue line with circular markers, showing a gradual decrease in signal amplitude over time. The data series with attenuator alpha 1 is represented by a dashed yellow line with diamond markers, showing a steeper decrease in signal amplitude. The data series with attenuator alpha 2 is represented by a dashed red line with square markers, showing an even steeper decrease. The data series with attenuator alpha 3 is represented by a dash-dot green line with triangular markers, showing the steepest decrease. The approximations for each attenuator follow similar trends to their respective experimental curves but with slight deviations. The graph illustrates how different attenuators affect the signal amplitude over time, with higher attenuations resulting in steeper declines in signal amplitude.
Within the framework of this technique, the decay time constants
 $\tau$
of the trap were measured, and relation (3.4) was used for their analysis, relating
 $\tau$
to the mirror reflectivity
 $R$
and the losses introduced
 $\alpha _s$
. Comparison of the values of
 $\tau$
(without an attenuator) and
 $\tau _s$
(with an attenuator) allowed the estimation of the effective integral losses 1 –
 $R$
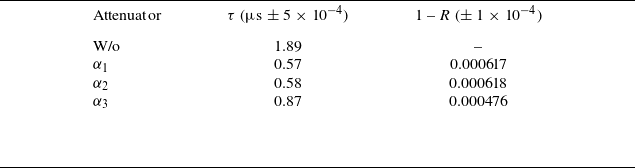
at the mirrors – the main parameter that determines the efficiency of confinement. The measured decay times and the parameters calculated on their basis are presented in table 2.
Measured decay times (
 $\tau$
) and absorption coefficient (1 –
 $R$
).

Table 2. Long description
A table comparing decay times and absorption coefficients with different attenuators. The table has four rows and three columns. The columns are labeled ‘Attenuator’, ‘τ (μs ± 5 x 10^-4)’, and ‘1 - R (± 1 x 10^-4)’. The rows are labeled ‘W/o’, ‘α1’, ‘α2’, and ‘α3’. Row 1: W/o, 1.89, blank. Row 2: α1, 0.57, 0.000617. Row 3: α2, 0.58, 0.000618. Row 4: α3, 0.87, 0.000476. The table presents measured decay times and calculated absorption coefficients for different attenuators, showing variations in these parameters based on the presence and type of attenuator.
As can be seen in the table, the calculated values of the mirror reflectivity demonstrate satisfactory agreement with the specification value declared by the manufacturer (
 $R$
= 0.9995, i.e. 1 –
 $R$
= 0.0005).
To investigate the dependence of trap losses on the angular aperture of the incoming radiation, the laser beam aperture was reduced using a telescopic lens. This narrowed the focusing cone, resulting in a twofold reduction in the spatial filling of the mirror aperture along the vertical axis compared with the initial configuration (figure 6). This configuration is shown in figure 9.
Scheme of laser beam aperture reduction.

Due to the small scattering area, a pronounced contrast spot, indicated by an arrow, is observed in the obtained image. It is located in the same region as the analogous spot in figure 6. In terms of its geometric position, this spot corresponds to the technological hole in the mirror. This hole is used to record the accumulated radiation power in the trap.
The increase in the amplitude of the accumulation signals observed in figure 10 for the new input configuration indicates an increase in the density of photons adiabatically confined between the mirrors.
Oscillograms obtained when studying the effect of sharp focusing of laser radiation on the efficiency of photon accumulation in an optical trap:  — accumulated radiation without attenuator;
 — accumulated radiation with
 $\alpha _2$
;
 — accumulated radiation with
 $\alpha _3$
;
 — laser monitor signal.

The observed increase in density is associated with a smaller photon confinement region and a reduction in its effective volume inside the trap. Thus, the experimental data confirm the possibility of controlling the spatial photon density in an adiabatic trap by varying the parameters of radiation injection, in particular, its angular aperture.
The logarithmic plots in figure 11 also demonstrate the exponential nature of the decay of the accumulated photons.
Exponential fitting of photon decay oscillograms for the modified configuration (logarithmic scale). Experimental curves are shown by lines; approximation results are shown by markers.

The results of this approximation are superimposed on the original oscillograms, demonstrating good agreement with the proposed mathematical model.
The corresponding decay time constants
 $\tau$
were obtained and the effective mirror losses 1 –
 $R$
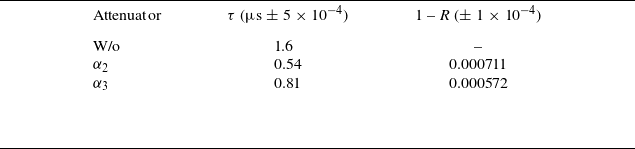
were calculated. The results are presented in table 3.
Measurement and calculation results for a narrow focusing cone (i.e. small angular spread of the injected radiation).

Table 3. Long description
The table presents measurement and calculation results for a narrow focusing cone, specifically for small angular spread of the injected radiation. It consists of three columns and four rows, including the header row. The columns are labeled Attenuator, τ (μs ± 5 x 10^-4), and 1 - R (± 1 x 10^-4). The row labels under Attenuator are W/o, α2, and α3. The values in the table are as follows: Row 1: W/o, 1.6, -. Row 2: α2, 0.54, 0.000711. Row 3: α3, 0.81, 0.000572.
As can be seen in the table, the experimentally measured decay times in this configuration are shorter than those in the original configuration (e.g. from 1.89 to 1.60
 $\unicode{x03BC}$
s for the case without attenuator, a reduction of approximately 15 %, see table 2).
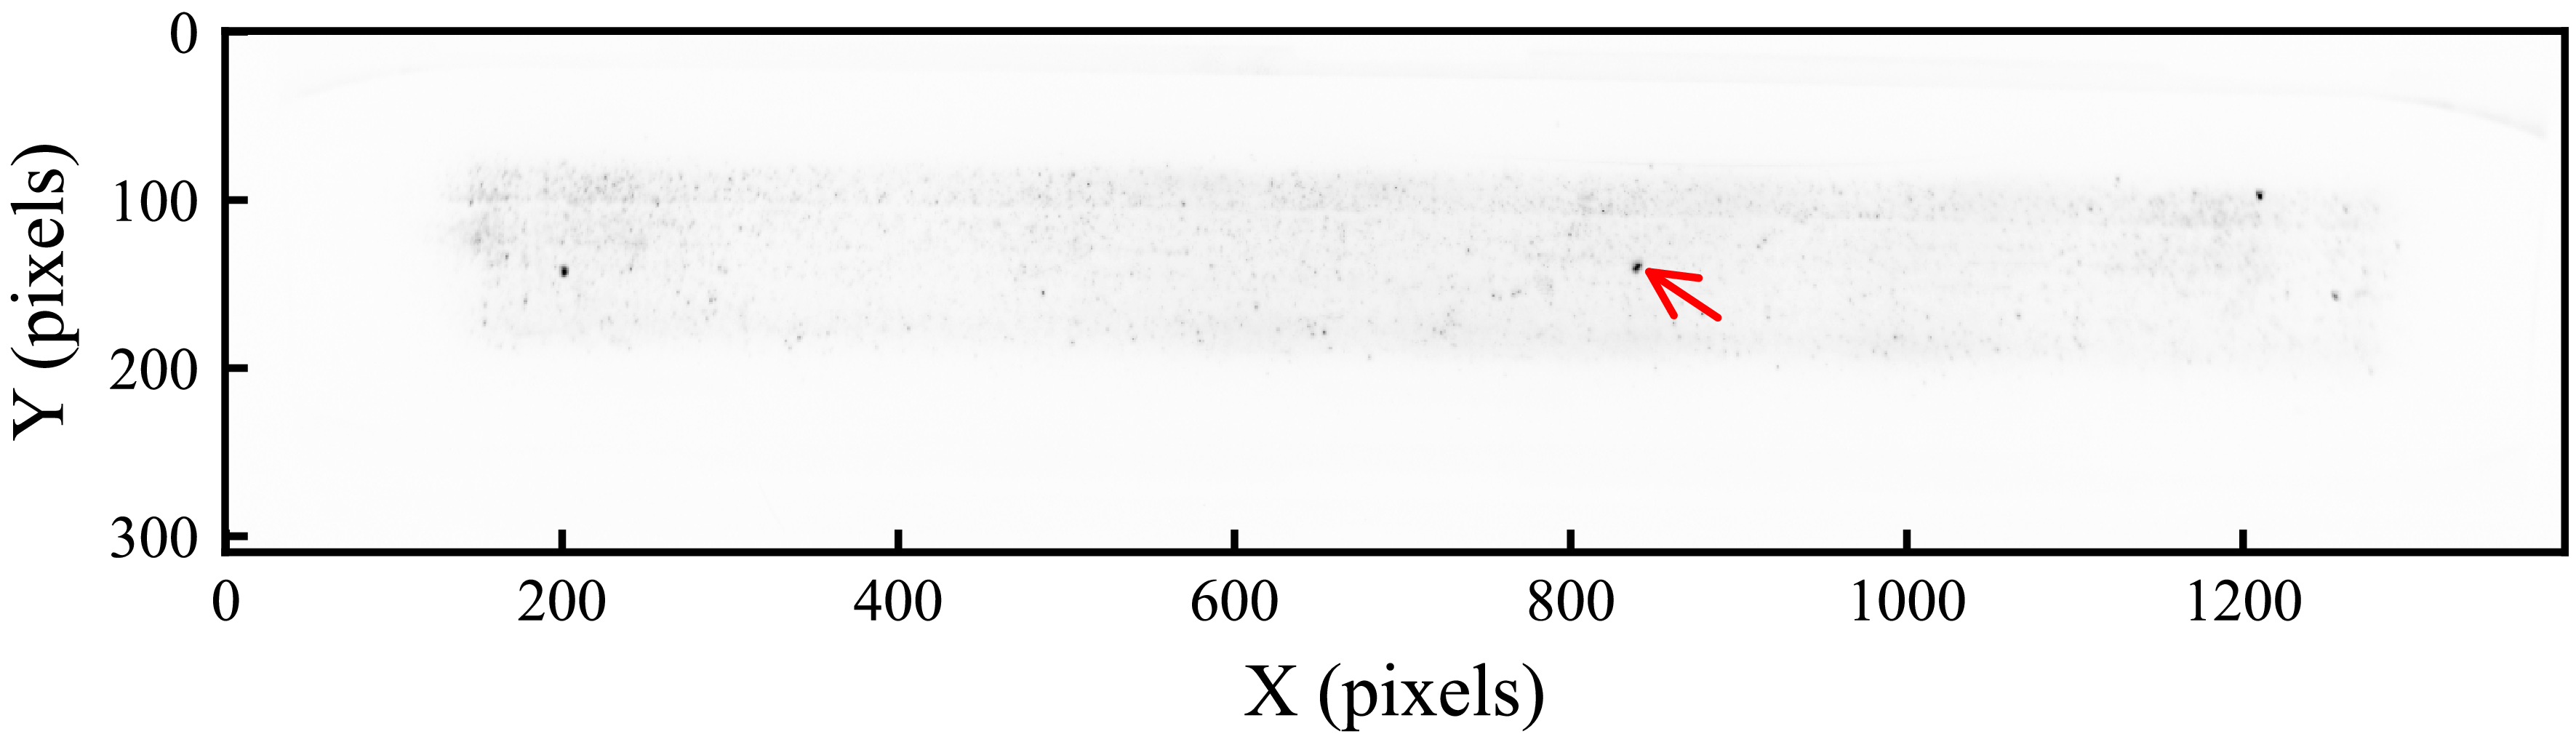
At the next stage, we increased the angular aperture of the focusing cone, resulting in a twofold increase relative to the same initial configuration (figure 6).
Parasitic light scattering on the mirror surface observed with an increase in the angular spread of the injected radiation. The arrow indicates the location of the technological hole.

Analysis of the images obtained in this configuration (figure 12) allows two key conclusions to be drawn. First, the position of the dark spot corresponding to the technological hole for radiation detection remains unchanged. Second, in addition to it, other pronounced dark spots are observed, whose spatial position also remains the same in all images.
The nature of these additional inhomogeneities is similar to that of the previously observed local coating defects; however, a more detailed investigation of the mirror surface is required to accurately identify their origin. Since no statistically significant effect of the observed defects on the radiation accumulation efficiency was found, their detailed analysis was not performed. Within the framework of the present study, the main focus was on investigating the radiation decay time in the trap.
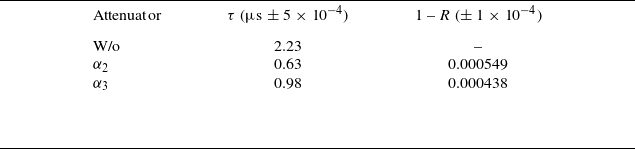
As can be seen from the oscillograms in figure 13, the power of the accumulated radiation recorded by the detector decreased in this configuration. The logarithmic plots of these data (figure 14) demonstrate that the time dependence obtained from the oscillograms is well approximated by a straight line, indicating the preservation of the exponential decay law, which is consistent with the results of previous experiments. The key difference in this configuration, however, is an increase in the measured decay time constant, as summarised in table 4.
Measurement and calculation results for a wide focusing cone (i.e. large angular spread of the injected radiation).

Table 4. Long description
A table summarizing measurement and calculation results for a wide focusing cone. The table has four rows and three columns. The columns are labeled Attenuator, τ (μs ± 5 x 10^-4), and 1 - R (± 1 x 10^-4). The rows are labeled W/o, α2, and α3. Row 1: W/o, 2.23, -. Row 2: α2, 0.63, 0.000549. Row 3: α3, 0.98, 0.000438.
Oscillograms obtained when studying the effect of an increase in the angular spread of the injected radiation on the efficiency of photon accumulation in an optical trap: — accumulated radiation without attenuator; — accumulated radiation with
 $\alpha _2$
; — accumulated radiation with
 $\alpha _3$
; — laser monitor signal.

Exponential fitting of photon decay oscillograms for the modified configuration (logarithmic scale). Experimental curves are shown by lines; approximation results are shown by markers.

6. Discussion
Analysis of the results for different laser radiation injection modes revealed a special case with the minimum focal spot size. In this configuration, the value of the integral mirror losses (
 $1-R$
), calculated using relation (3.4) for the attenuator
 $\alpha _2$
(see table 3), was
 $7.11 \times 10^{-4}$
. This value exceeds the manufacturer’s specification (
 $5 \times 10^{-4}$
) by 42 %, is 15 % higher than the losses for
 $\alpha _2$
in the standard configuration (
 $6.18 \times 10^{-4}$
, table 2) and 30 % higher than those for
 $\alpha _2$
in the increased injection angle configuration (
 $5.49 \times 10^{-4}$
, table 4). The observed deviation can be explained by a combination of factors related to changes in the spatial distribution of radiation inside the trap.
The specification value of the reflectivity is an integral average over the entire mirror surface. Under sharp focusing, the laser beam interacts multiple times with a limited, localised region. It is likely that, with a small aperture filling area, the relative role of local inhomogeneities increases, for example, absorption at the technological hole for diagnostics. With high probability, a narrow beam repeatedly crosses the region near this hole, which may cause additional losses. The technique interprets these as a reduction in the integral reflectivity of the mirrors.
The decrease in the photon lifetime
 $\tau$
in this configuration (table 3) is a direct consequence of the increase in total losses. The data obtained show that the effective optical losses in an adiabatic trap have not only an integral but also a local geometric character. This practical conclusion emphasises the need to take into account the spatial distribution of radiation and the possible inhomogeneity of mirror coatings when optimising the accumulation efficiency.
7. Conclusion
Using an original technique based on the analysis of exponential radiation decay after switching off the pump, the key parameters of the system were measured: the decay time constant
 $\tau$
and the integral optical losses (1 –
 $R$
). It was established that the decay of the photon ensemble has a clear exponential character, which confirms the adequacy of the theoretical model of quasi-periodic drift. The obtained values of mirror losses (1 –
 $R$
) ranging from 4.4
 $\times$
10
 $^{-4}$
to 6.2
 $\times$
10
 $^{-4}$
are in good agreement with the reflectivity of the specification (
 $R \approx$
0.9995) and indicate the high quality of the optical components fabricated. An important result is the conclusion that varying the angular aperture of the focusing cone and the angle of incidence does not lead to a radical change in the integral parameters of the system, indicating the promise of the proposed concept. The decay time
 $\tau$
is set by the trap alone, independent of the laser pulse duration. Under continuous-wave or long-pulse operation, the stored power would reach a steady-state level determined by the same
 $\tau$
. Therefore, no extrapolation beyond the measured parameters is required – the results are directly applicable to realistic Neutral Beam Injection conditions.
On this experimentally confirmed basis, including the gain factor of approximately 2000 measured for the assembled storage device, a program has been formulated to transition to the applied task of photoneutralisation of
 $H^{-}/D^{-}$
beams, to be implemented in an experimental set-up (see Popov et al. Reference Popov, Atlukhanov, Burdakov, Ivanov, Kurkuchekov, Sanin, Skovorodin, Trunev and Shikhovtsev2024). The set-up will utilise a negative ion source based on caesium surface-plasma emission with an energy of 25–130 keV and a current of up to 14 mA in continuous mode. An estimated model, taking into account the measured mirror parameters and a pump power of
 $\sim$
4 kW, predicts the achievement of an average neutralisation efficiency of 80 % for a beam with a transverse size of 10 mm.
The main objectives of the next experimental stage are the following:
-
(i) additional verification of the model by measuring the dependence of the neutralisation efficiency on the beam energy and pump power;
-
(ii) achievement of a maximum neutralisation coefficient (
 ${\gt}70$
% at 100 keV);
-
(iii) development of the mirror cooling system and evaluation of the neutraliser lifetime in continuous operation.

The results obtained provide a reliable basis for the application of this type of trap. Successful implementation of the program will be a key step toward solving the problem of technology scaling, forming the foundation for its use in large fusion facilities.
Acknowledgements
Editor Cary Forest thanks the referees for their advice in evaluating this article.
Declaration of interests
The authors report no conflict of interest.





 α1
 α2
 α3

 τ
 R

 α2
 α3


 α2
 α3


 Open access

