I. INTRODUCTION
The nanoindentation test is an excellent method for measuring the local strength of a material on the micro-/nanometer scale in both computational and experimental studies.Reference Kiely and Houston 1 Specifically, nanoindentation deformation processes can be used for interpreting the initial yield characteristics of materials and the mechanisms for the emission of the first dislocation.Reference Saraev and Miller 2 , Reference Begau, Hartmaier, George and Pharr 3 Because the movement of atoms is involved during the emission of the first dislocation and during the transition from elastic to plastic deformation, it is important to directly observe the movement of atoms, which remains almost impossible during nanoindentation experiments. Because of the developments in nanotechnology, more attention has been devoted to understand the properties of grain boundaries (GBs) in metals and the deformation mechanisms for materials at the micro- and nanoscales.Reference Kramer, Yoder and Gerberich 4 The influence of the GB structure on the mechanical behavior of bicrystals has been the subject of intense interest because of their importance in the effects on the deformation process.Reference Balluffi and Sutton 5 Compared to single crystal metal materials, the plastic deformation of polycrystalline metal materials is quite complicated because the effect of the GB significantly impacts their physical, chemical, and mechanical properties.Reference Lu, Lu and Suresh 6 Most of the current nanoindentation studies are focused on materials that do not contain defects; however, GBs are crucial for understanding the nanoindentation mechanisms.Reference Corcoran, Colton, Lilleodden and Gerberich 7 , Reference Miller, Shilkrot and Curtin 8 Therefore, comprehensively investigating the effects of the GB on the nanoindentation process is very important.
Currently, one widely used multiscale method for the nanoindentation test is the quasicontinuum (QC) method, which has been coupled with the finite element and the molecular dynamics methods.Reference Tadmor, Ortiz and Phillips 9 – Reference Smith, Tadmor, Bernstein and Kaxiras 11 Based on the QC method, Tadmor et al.Reference Tadmor, Miller, Phillips and Ortiz 10 studied the initial stages of plastic deformation during the nanoindentation of a single crystal of aluminum. A strong dependence on the geometry and orientation of the indenter was analyzed. Ni et al.Reference Li, Ni, Wang and Mei 12 simulated the nanoindentation processes in single crystal Ag thin film under different crystallographic orientations and various indenter widths by the QC method. They also investigated the process of nanocontact including indentation and retraction between a large Ni tip and a Cu substrate using QC method.Reference Mei, Li, Ni and Wang 13 Ng et al.Reference Ng, Pandurangan and Li 14 investigated the two-dimensional (2D) nanoindentation of a copper thin film. A fully atomistic simulation was also conducted for validating the multiscale method. Iglesias et al.Reference Iglesias and Leiva 15 analyzed the slip vectors, dislocation nucleation, and nanostructure formation for different indenter materials (Ag, Cu, and Pd) and indenter crystal orientations.
Some researchers have also observed the importance of the GB effects and the indenter size during experimental studies.Reference Soifer, Verdyan, Kazakevich and Rabkin 16 – Reference Eliash, Kazakevich, Semenov and Rabkin 23 Soifer et al.Reference Soifer, Verdyan, Kazakevich and Rabkin 16 used nanoindenting atomic force microscopy (AFM) for studying the mechanical properties of a polycrystalline copper film that was deposited onto a Si substrate and patterned into 4–8 μm wide lines. The same authors also investigated the nanohardness in the vicinity of the GBs in high purity Cu using nanoindentation experiments.Reference Soifer, Verdyan, Kazakevich and Rabkin 17 They observed that the nanohardness increases closer to the GB, and the characteristic distance at which the GB influences the nanohardness is in the range of a few micrometers. Soer et al.Reference Soer, Hosson, Minor, Morris and Stach 18 investigated the indentation-induced plasticity in ultrafine grained Al and Al–Mg thin films using nanoindentation in a transmission electron microscope. The authors also investigated a dislocation pileup and transmission across the boundary based on a series of nanoindentation measurements near a high-angle GB in a Fe–14% Si bicrystal.Reference Soer and Hosson 19 Subsequently, they conducted further research on the mechanical response to nanoindentation near GBs in a Fe–14% Si bicrystal with a general GB and two Mo bicrystals with symmetric tilt boundaries.Reference Soer, Aifantis and Hosson 20 Aifantis et al.Reference Aifantis, Soer, Hosson and Willis 21 showed that the occurrence of dislocation pileups across GBs, as well as subsequent emission to the adjacent grains, is captured theoretically by gradient plasticity and confirmed experimentally by nanoindentation. The same authors also observed the interfacial yielding during nanoindentation on a Fe–2.2 wt% Si bicrystal and a Nb polycrystal.Reference Katerina Aifantis and Ngan 22 Eliash et al.Reference Eliash, Kazakevich, Semenov and Rabkin 23 performed a nanoindentation study on the inherent mechanical properties of GBs. The authors observed that increased hardness exists in the vicinity of all GBs and that the width of this region is approximately 2 μm and the maximum relative increase of hardness at the GB is approximately 30%.
It is known that the GB is critical for the properties and deformation of materials; however, there are currently no reports combining simulations and experimental studies for examining the effects of the GB on the emission of the first dislocation during nanoindentation. In this paper, we investigated the effects of the
 $\sum {5(310)/[001]} {\rm{\theta }} = 53.1\circ $
symmetrical tilt GB on the first dislocation emission during the nanoindentation of a face-centered cubic (FCC) bicrystal using the QC method and nanoindentation experiments.
II. QC SIMULATIONS
A. The QC method and model
The QC methodReference Tadmor, Ortiz and Phillips
9
developed by Tadmor and MillerReference Miller and Tadmor
24
is a molecular static method combined with finite element techniques, which is a novel approach aiming at a transition from the atomistic to the continuum description of crystalline solids. The technical details about the QC method can be found in a review paper. The nanoindentation process on a FCC copper bicrystal that has a symmetrical GB was simulated using the QC in this paper. First, a “natural” set of coordinates is defined based on the definition of the Bravais lattice vectors of the material, which will comprise the grain. It may be convenient to choose the [310], the [
 $\bar 1$
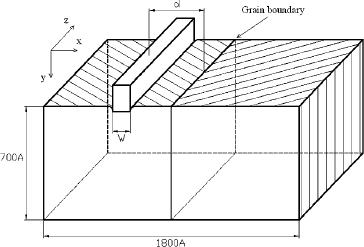
30], and the [001] directions as the natural x, y, and z directions, respectively, as indicated in Fig. 1. A
 $\sum {5(310)/[001]} {\rm{\theta }} = 53.1\circ $
symmetrical tilt boundary is in the center of the model, which is naturally defined by the <310> and <130> crystallographic directions that are aligned parallel and perpendicular with the boundary plane. A rigid knife-like flat indenter with a width (“w” in Fig. 1) of 11.42 Å (6 times the lattice constant of copper) is driven into the (310) surface of the crystal. The model is 2D; its thickness in the out-of-plane direction is equal to the minimal repeating distance in that direction, which is limited by the current application of the 2D QC method. The thickness and width of the simulation model are 0.07 and 0.18 μm, respectively, and in the out-of-plane direction, it is infinite. The model size is set to ensure that the far-field boundary conditions do not affect the behavior in the vicinity of the GB. The system investigated here is very large by current atomistic modeling standards.
Schematic representation of the nanoindentation model with a GB for the indentation into a (310) plane.

In this paper, we consider the emission of the first dislocation during nanoindentation at a temperature of 0 K; no consideration is devoted to the temperature effects on the dislocation nucleation during the simulation process. With the goal of modeling an atomistic system without explicitly treating every atom in the problem, the QC method provides a framework, whereby degrees of freedom are judiciously eliminated and the force/energy calculations are expedited. This process is combined with an adaptive model refinement to ensure that the full atomistic detail is retained in the regions of the problem where required, while the continuum assumptions reduce the computational demand elsewhere. The process proceeds through a molecular static energy minimization over an atomistic (nonlocal) domain and a finite element (local) domain. The constitutive law in these two domains is chosen as the embedded atom method potential for copper.Reference Foiles, Baskes and Daw 25 The QC method uses continuum assumptions for reducing the degrees of freedom and computational demand without losing atomistic detail in regions where it is required. Furthermore, the fully atomistic critical regions can evolve with the deformation during the simulation.
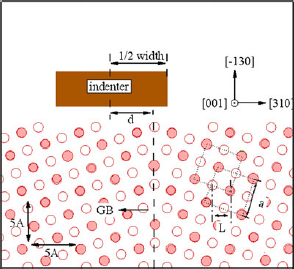
Figure 2 presents the QC nanoindentation simulation model that has a symmetrical tilt boundary for indentation. During the simulation, the rigid indenter was pushed into the model but not explicitly modeled. The atoms under the indenter are forced to gradually move into the material under displacement-imposed boundary conditions. The indentation is performed by gradually pushing the indenter into the sample with each step of 0.3 Å (this was determined to be the largest stable step about crystalline copper during our convergence test). After each step, the system is fully relaxed. The number of minimization steps has no limit, but rather, the minimization proceeds until the displacements of all nodes and atoms during a step are less than 10−9 Å. This process results in a slow indentation experiment where the velocity of the indenter is much slower than the velocities associated with atomic vibrations; therefore, the system has sufficient time to achieve its equilibrium position. We can observe the atomic structures of the
 $\sum {5(310)/[001]} {\rm{\theta }} = 53.1\circ $
boundary more clearly in Fig. 2, where the atoms on two successive (001) planes are depicted using different color circles. In the coordinate system, the distance between two adjacent rows of atoms projected onto the (001) plane along the [310] crystal direction is L = 1.71 Å, which is calculated from the lattice constant of copper (3.615 Å). For the convenience of studying the effects of the indenter positions on the nanoindentation, a variable d (d < 0 for left side grain and d > 0 for right side grain), which denotes the offsetting value of the x-coordinate of the distances between the center of the indenter and the twin crystal GB, is defined.
Schematic atomic structure of the
 $\sum {5(310)/[001]} {\rm{\theta }} = 53.1\circ $
symmetrical tilt boundary of copper bicrystal by QC method. A variable d, which denotes the offsetting value of the x-coordinate of the distances between the center of the indenter and the twin crystal GB, is defined.

B. Analysis of incipient yield during the nanoindentation
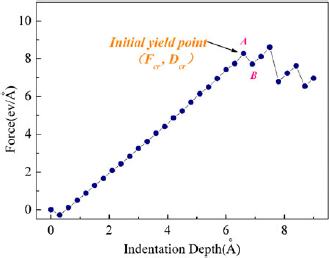
To understand the nanoindentation process, a simulated indentation with d = 0 was conducted, and the characteristic curve of the force on the indenter in the y-direction versus its displacement after 30 steps is plotted in Fig. 3. The loads are derived from the energy and length units of the underlying atomistic potentials. The units of loads are then provided as electron volt per angstrom. When the indentation depths reach 6.6 Å at the 23rd step, the curve deviates from the linear response as it approaches the incipient yield point (F cr, D cr). The initial yielding was evidenced in load–displacement curve by an abrupt drop due to the initial dislocation emission, marking the onset of plastic deformation. This effect indicates that after a preliminary elastic stage during load-controlled nanoindentation experiments, a discontinuity in the indenter displacement has been captured for several cubic crystals.Reference Liu, Wang, Yashino, Roy, Lu and Komanduri 26 , Reference Dean, Wheeler and Clyne 27 F cr and D cr denote the critical force in the y-direction and the critical displacement of indenter corresponding to the dislocation nucleation, respectively. The critical load for the emission of the first dislocation (namely, the first peak in the load–displacement curves) in the model is 8.27 eV/Å, which corresponds to a hardness of 32.05 GPa with an indentation depth of 6.6 Å at d = 0. The hardness value is obtained by dividing the total force on the indenter by the repeat distance in the out-of-plane direction of the crystal structure multiplied by the width of the indenter.
Nanoindentation load–displacement curve with d = 0; F cr and D cr denote the critical force in the y-direction and the critical displacement of indenter corresponding to the dislocation nucleation, respectively.

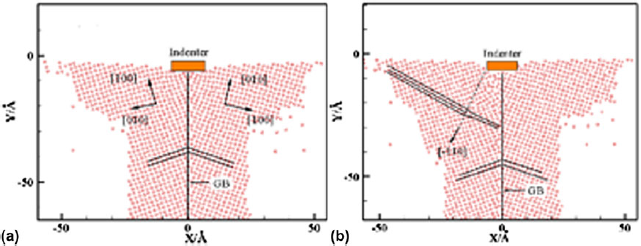
To study the movement of atoms during the emission of the first dislocation and the elastic-to-plastic transition, the atoms snapshot are investigated immediately before and after the 23rd step. Figure 4 shows the snapshots of the atoms in the model of bicrystal copper with a symmetrical tilt boundary at the 23rd and 24th steps (A point and B point in Fig. 3), respectively. The atoms arrange regularly under the indenter, and no dislocation is nucleated when the indentation depth reaches 6.6 Å at this step [Fig. 4(a)]. However, under the indenter, one partial dislocation nucleates in the vicinity of the GB at the 24th step; the corresponding atomic structure of the Shockley partial slip along the [
 $\bar 1$
10] direction is presented in Fig. 4(b). The [
 $\bar 1$
10] edge dislocation has been emitted beneath the indenter left tip. The dislocated structure beneath the indenter is provided in Fig. 4(b) along with the out-of-plane displacements experienced by the atoms. The simulation results reveal that the first partial dislocation will be emitted following the peak of load–displacement curve in the continuous load during nanoindentation and the partial dislocations slip along the [
 $\bar 1$
10] direction. Therefore, the conclusion can be drawn that the first dislocation and the elastic-to-plastic transition result from the partial dislocation emission.

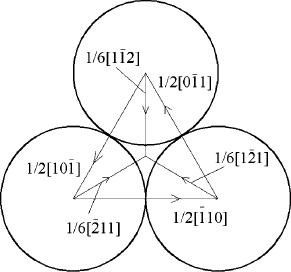
The dislocation is composed of 1/6 <112> Shockley partials, which are bound to a stacking fault.
 $${{\rm{1}} \over {\rm{2}}}[\bar 110] \to {{\rm{1}} \over {\rm{6}}}[\bar 211] + {{\rm{1}} \over {\rm{6}}}[\bar 12\bar 1]\quad.$$
Figure 5 illustrates the reaction of the dissociation of a perfect edge dislocation into two Shockley partial dislocations. This figure indicates that the first partial dislocation will be emitted following the peak of the load–displacement curve in the continuous load during nanoindentation (Fig. 3). The atomic snapshot in the models with different d values at the critical force corresponding to the dislocation nucleation is similar to Fig. 4. Therefore, again, the first dislocation and the elastic-to-plastic transition result from the partial dislocation emission.
The important vectors of the (111) surface of a FCC crystal.

III. NANOINDENTATION EXPERIMENTS
The instrument used in this study is a Tribo Indenter, which is manufactured by the Hysitron Company (Minneapolis, MN). This instrument is a stand-alone nanomechanical testing system, which has been designed to provide fully automated testing and in situ imaging. The load and displacement resolutions are less than 0.1 nN and 0.00002 nm, respectively. To ensure accurate results during the experiments, the process must be strictly controlled. The nanoindentation used a Berkovich indenter with a tip radius of 40 nm. The maximum applied load is 100 μN. During nanoindentation, the load was forced into the surface for 10 s, maintained for 10 s, and finally unloaded over the course of 10 s.
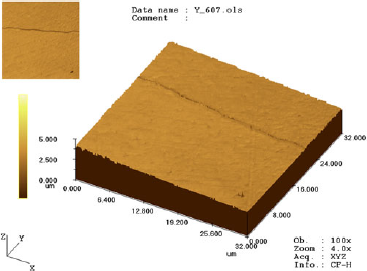
The sample was prepared from bicrystal copper with a purity of 99.99 wt%. The sample was cut into a disk with a diameter of 10 mm and a height of 4 mm by wire cutting machine. Because the actual structure of the GB is very complex, the configuration of the GB is very difficult to be coincident between the simulation and the experiment. So the GB structure of the bicrystal copper is not specified in the nanoindentation experiment, but the press-in direction of indenter is consistent with the simulation. The sample was prepared by mechanical polishing and ion beam etching. The surface was examined before nanoindentation to ensure that the region under the indenter was of low roughness. Figure 6 presents the laser confocal microscope image of the sample face after bombarding with argon ions. The GB is in the middle of the sample. The surface roughness of the crystal was less than 0.004 μm.
The top view and three-dimensional view images of the bicrystal Cu face after ion beam etching.

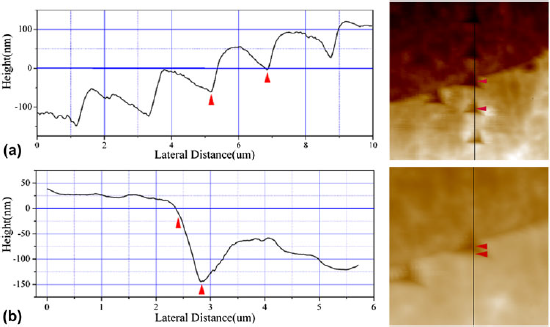
Figure 7 presents the corresponding surface AFM image that has a typical line topography profile of the Cu bicrystal surface after indentation with the Berkovich indenter. It can be observed in this figure that the GB is located in the middle of the sample, which is used to divide the grain into two side grains, left and right. A row of five points across the GB and a single point were displayed in Figs. 7(a) and 7(b). This figure indicates that there are no cracks around the indented region.
The corresponding surface AFM image with a typical line topography profile after the indentation test in vicinity of the GB in a Cu bicrysytal (a) five points across the GB; (b) one point in the middle of the GB.

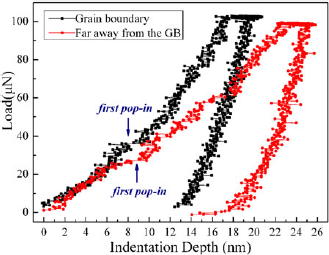
Figure 8 presents the load–displacement curves for two indents (one point across the GB and another point far from the GB) in the Cu bicrystal with 100 μN. It was observed that the curves are discontinuous. Sudden displacement discontinuities (pop-ins) were observed in the loading part. The first pop-in was indicated in Fig. 8. During nanoindentation experiments, the same phenomenon is commonly observed. However, the reasons for this phenomenon vary; for example, oxide fractures, phase transformations, and dislocation emissions have been attributed to this phenomenon.Reference Bahr, Kramer and Gerberich 28 Figure 6 indicates that there are no cracks around the indented region. If the load is withdrawn once the curve drops, the configuration of the surface will be restored. So it is believed that such “pop-in” in our nanoindentation experiments indicates the onset of dislocation motion across the GB, or sudden movement of collective dislocations in the adjacent grain, which is larger than the simulated one. However, the dislocation emits when the indentation depth reaches only several angstroms during the simulations, whereas it is on the order of nanometers during these experiments. The reason for this behavior is that the real indenter size is much larger than simulated one.
Depth–force curves for the indents in the GB and far from the GB at a force of 100 μN.

The displacement in Fig. 8 initially jumps with a width of approximately 8 nm with regard to the Cu Burgers vector, which corresponds to the activity of approximately 16 activated slip systems. This result indicates that it is inappropriate for researchers to use nanoindentation experiments for studying the nucleation and motion of a single dislocation. Although the local shear stress is sufficiently high for nucleating dislocations, the resolution of the current equipment is not sufficient for observing the motion of a single dislocation.
IV. EFFECTS OF THE DISTANCE BETWEEN THE INDENTER AND GB ON THE INCIPIENT YIELD
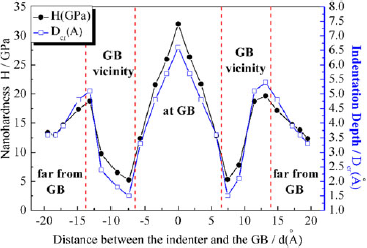
To study the effects of the GB on the incipient yield, the distance between the indenter and the center of the GB was changed during the simulation, and a series of indents were placed into the GB of the Cu bicrystal during the nanoindentation experiment. Figure 9 presents the nanohardness (H) and displacement of the indenter (D cr) with varied indenter position using the QC method. The model was divided into three regions: the GB region, GB vicinity region, and the region far from the GB region. The value of d is an integral multiple of L (d = 0, L, 2L, 3L, 4L, …). The load–displacement curves have the same movement behavior with different d values in the three regions. At first, the deformation of the curves is linear before it reaches the critical force point; it then curves into the plastic deformation stage. The occurrence of plastic deformation is strongly related to the distance between the indent and the GB. The effects of the d values on the incipient yield in the three regions of the two adjacent grains are illustrated in Fig. 9. The variation of D cr and H in the two sides of the GB exhibit the same behavior; therefore, we only discuss the left side of the grain. The GB region is discussed first. The strength of the first dislocation emission reaches a maximum point where there is a superposition of the center of the indenter and the middle of the GB (d = 0). The nanohardness value is 32.05 GPa at an indentation depth (D cr) of 6.6 Å. These values then gradually decrease until the distance reaches 5.72 Å. At this point, the hardness and displacement considerably decrease; the values of D cr and H are 3.3 Å and 12.40 GPa, respectively, which is an approximately 55% decrease. Subsequently, in the vicinity of the GB, when d is −7.43 Å, the hardness begins rising, and the value of H increases from 5.30 to 18.71 GPa when the indentation depth increases from 1.5 to 5.1 Å, which is an increase by a factor of 3.5. When the indenter is far from the GB, the nanohardness of the Cu bicrystal (H) and indentation depth (D cr) may relaxedly decrease.
The nanohardness and displacement of the indenter, D cr, with varied indenter position using the QC method.

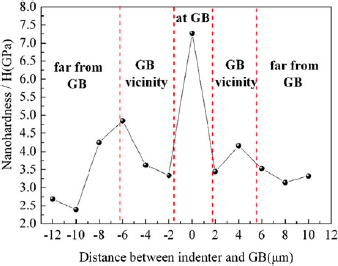
To further study the influence of the indenter position on the nanoindentation deformation and to verify the accuracy of the simulation, a series of indents were pressed into the Cu bicrystal during the nanoindentation experiment. Figure 10 illustrates the nanohardness of a group of indents across the GB during the bicrystal copper nanoindentation experiment. The nanohardness was calculated from the indention contact depth. Based on the curve, when the indenter contacts the GB, the nanohardness can increase by a factor of 2 compared to the nanohardness inside the grains, where the value is 7.26 GPa. When the distance between the indenter and the middle of the GB is 1 μm, the hardness sharply decreased; the trend of the changes between the left and right grains is approximately similar. Therefore, it is observed that the nanohardness may slightly increase when the distance between the indenter and the GB is less than 3 μm. Subsequently, there is an obvious decrease in the hardness value, which has no further significant changes when the indenter is move further away from the GB.
The nanohardness of a group indents across the GB during the bicrystal copper nanoindentation experiment.

By comparing the indentation hardness of the three regions during the simulation and the experiment, it can be observed that the theoretical simulation results are in good agreement with those of the experimental measurement. The maximum nanohardness appears in the middle of the symmetrical tilt GB; the value is 32.05 GPa, and then, the load may decrease by a factor of 0.5. When the indenter is far from the GB, the nanohardness may regularly fluctuate; it may increase in the vicinity of GB and then gradually decrease when the indenter is located further from the GB. The effect of the distance of the boundary on the incipient yield is approximately 20 Å from the GB. As an advanced multiscale method, the QC simulation has been applied widely in the research of materials deformation mechanisms during nanoindentation under micro-/nanoscale. It could identify the movement of the atoms and the emission of the dislocations, which are both very difficult to obtain in experiments. To accomplish the simulation in acceptable time, the size of indenter is only several angstroms during our simulations. It is very difficult to carry out experiments in the same scale, so our research only focuses on the qualitative comparison. In our nanoindentation experiments, the size of indenter and sample are both in nanoscale. A mass of indents were carried out across the GB, and the data have qualitative similarities with the simulation results, which account for the same effect of the distance from GB on the initial plasticity. Although the scales of observation of nanoindention experiments and simulations are different, the qualitative comparison has great significance.
It is necessary to discuss the reason of the distance effects between the indenter and the GB on hardness. First, the symmetrical tilt boundary has a specific atomic configuration (Fig. 2); it has a coherent planar defect where the atomic arrangements on one side are mirror reflections of those on the other side. This configuration can hinder the movement of the atoms during the plastic deformation process and could be effective obstacles for the motion of the dislocations. Therefore, the maximum value of the incipient yield strength appears in the middle of the GB. Inside the grains, the atomic configuration and the deformation processes are very complex. The interaction between the dislocation and the GB results in an immobile dislocation that disturbs the local coherency of the symmetrical tilt boundary. These interfacial defects act as dislocation sources as the indentation progresses. Partial dislocations are nucleated from the source of the GB and slide along the GB direction. The number, site, and length of the emission of the first dislocations during the deformation process may also influence the contact depth and hardness values.
V. CONCLUSIONS
In this paper, a symmetric tilt structure of bicrystal copper was accurately configured using the QC method. A series of multiscale simulations and nanoindentation experiments were performed to investigate the nanoindentation deformation processes. The numerical results of the elastic response and the critical yield loading where the Shockley partial dislocation nucleates during indentation are presented. This study focuses on the distance effects between the indenter and the GB on nanohardness, which have been discussed based on QC simulations and nanoindentation experiments. The following conclusions can be drawn from our observation:
-
(i) The QC method may help us to construct the
 $\sum {5(310)/[001]} {\rm{\theta }} = 53.1\circ $
boundary model of a FCC Cu bicrystal for investigating the nanoindentation deformation processes of polycrystalline materials.
-
(ii) The elastic-to-plastic transition during the nanoindentation of a Cu bicrystal results from the first dislocation emission. The partial dislocations are nucleated, and sliding occurs along the [
$\bar 1$
10] direction. -
(iii) The maximum incipient load appears in the middle of the symmetrical tilt GB; the value is 32.05 GPa, and then, the load may decrease by a factor of 0.5. The load subsequently increases in the vicinity of the GB, and then, it gradually decreases until it presents no significant changes when the indenter is far from the GB. A group of indents across the GB during the bicrystal copper nanoindentation experiment were observed. The compared data of the theoretical simulation and the experimental measurement have qualitative similarities.
-
(iv) The critical force in the y-direction (F cr) and the critical displacement of the indenter (D cr) are affected by the size and the position of the indenter, the structure of the boundary, and the emission of the first dislocation. However, a better understanding of the formation mechanisms of bicrystal copper requires further study.


ACKNOWLEDGMENTS
This project is sponsored by the National Science Foundation of China (Grant No. 51175110) and the Fundamental Research Funds for the Central Universities (Grant No. HIT.KLOF.2010006).