


INTRODUCTION
The flow behavior of polycrystalline polar ice is determined by factors inherent in the material itself and influenced by the unique characteristics of the site location. The proper construction of a time-scale for a deep ice core requires knowledge of the mechanical properties of the ice at the drill site as well as in the vicinity and up-stream of the drill site. The main objective of this study was to measure the deformational response of actual ice-core samples to applied stresses and to quantify these responses in terms of a flow law. The fact that ice cores relax after removal from their confining stress environment complicates the laboratory tests and requires full awareness of the transport and storage history of the test specimens, and the time-dependent changes in their physical properties. Of prime importance in the study was the measurement of various other physical and chemical parameters of the core samples before and after mechanical testing to investigate their influence on the behavior of the material. It is the total physical and chemical character of the ice-core samples, and the natural environmental variations existing within them, that define the material properties of the specimens tested.
Control data on the mechanical characteristics of fresh samples were initially obtained immediately after the Dye 3 core lengths were recovered in the field, during 1980 and 1981 (Reference Shoji, Langway, Langway, Oeschger and DansgaardShoji and Langway 1985[a]). These studies were critical to understanding the “aging effect” of deep ice cores. Since then, additional detailed laboratory tests and measurements have been made on sample sets obtained from ice adjacent to the original specimens and at many other levels selected over the entire 2037 m profile at Dye 3 (Reference Shoji and LangwayShoji and Langway 1985[b]). The earlier results were analyzed using the power-law creep equation and gave stress-exponent values ranging from 2.7 to 3.2. These values are in close agreement with the 3.0 exponent value obtained by Reference Barnes and WalkerBarnes and others (1971) on laboratory-made polycrystalline ice. Results of the Dye 3 ice-core studies indicate that the flow law of glacier ice is

where

 is the uniaxial strain-rate, σ is the maximum uniaxial stress, R is the gas constant and T is the absolute temperature. The constants A, n and Q are those of Reference Barnes and WalkerBarnes and others (1971), and Es is the strain-rate enhancement factor for horizontal shear deformation obtained from our test results on the Dye 3 ice core by using Equation 2. For shear deformation tests the long axis of the test specimens was oriented and cut 45° from the vertical long-core axis. The experimental results give values of Es ranging from 0.1 to 17. The average value of Es is 0.5 at shallow depth and gradually increases towards the bottom. The Wisconsin-age ice, below 1786 m depth in the core, is about ten times softer (Es = 10) than laboratory-made ice (Es = 1). The ice-core results agree favorably with Dye 3 bore-hole-tilt measurements made in the field (Reference Gundestrup and HansenGundestrup and Hansen 1984, Reference Dahl-JensenDahl-Jensen 1985). Reference Russell-Head and BuddRussell-Head and Budd (1979) interpreted their bore-hole-tilt measurements in terms of c-axis fabric patterns. Reference Gundestrup and HansenGundestrup and Hansen (1984) and Reference Fisher and KoernerFisher and Koerner (1986) interpreted their results in terms of the strong correlation between bore-hole-tilt, closure measurements and dust-concentration levels. Reference Shoji and LangwayShoji and Langway (1984) took into account both fabric patterns and impurity-level effects and calculated an enhancement-factor profile for Dye 3.
In order to investigate further the parameters that influence the enhancement-factor term, Es, new experiments were carried out on the Dye 3 ice core. The new experiments were planned to test the general enhancement-factor term, E. This was done by preparing specimens which had various orientations in relation to the vertical long-core axis. Where

θ is the angle between the uniaxial stress direction and the vertical long-core axis. The numerical value of E was calculated by using Equation 2. E = Es when the specimen is prepared with angle, θ, equal to 45°. E = Es = 1 for randomly oriented laboratory polycrystalline ice,
SAMPLES AND MEASUREMENTS
This investigation was designed to separate the effects of c-axis orientation patterns and impurity-concentration levels on flow behavior and, if possible, to identify the dominant parameters. Two sets of samples were carefully selected for this study. One set was a continuous, unfractured 68 cm length of core from the 268 m depth; the other consisted of three unfractured 50 cm length core pieces from the 1890, 1944 and 2006 m depths. Important paleo-environmental information and other useful data were already available for these samples, which (along with their excellent physical condition) influenced their selection for further investigation.
We knew from the δ18O record (Reference Reeh, Johnsen, Dahl-Jensen, Langway, Oeschger and DansgaardReeh and others 1985) that the approximate age for the 268 m sample was about A.D. 1500 and that the general level of ionic impurities for this sample was approximately the background value (Reference Herron, Langway, Langway, Oeschger and DansgaardM.M. Herron and Langway 1985). This 68 cm interval represents approximately a 2 year period. We also knew that the core sample was located in the zone of random c-axis orientation (Reference Herron, Langway, Brugger, Langway, Oeschger and DansgaardS.L. Herron and others 1985). The three deeper ice-core samples had similar supplementary information associated with their position in the Dye 3 ice-core column. For example, they were all located in the early to mid-Wisconsin-age ice (Reference Dansgaard, Clausen, Gundestrup, Johnsen, Rygner, Langway, Oeschger and DansgaardDansgaard and others 1985). The 1890 and 1944 m core samples were deposited as snow approximately 40 and 70 ka B.P. respectively. The 2006 m core sample probably formed close to the Wisconsin/Sangamon transition and is just above the near-bottom silty ice zone.
The 268 m core sample was first re-examined and photographed on a light-table. A detailed megascopic inspection was made in order to record the micro-stratigraphy. Scattered-light intensity was continuously measured on the microtomed surface by transmitting a beam of white light, perpendicular to the optic-cell receiver, through the core. Crystal size was measured by observing evaporated crystal-boundary grooves on the planar microtomed surface and by measuring linear intercepts; no correction was made for the raw values. The core sample was then cut, perpendicular to its long axis, into seven individual specimens. After ultrasonic wave velocity was measured along, and perpendicular to, the long-core axis, a uniaxial compression test under constant crosshead speed was performed on each specimen (2.5 × 2.5 × 9.2 cm). Stress was applied in a direction parallel to the long-core axis (θ = 0°). Specimens adjacent to the test pieces were prepared for chemical analysis by trimming and flushing under clean-room conditions; they were then melted in sterile polypropylene containers in a microwave oven and measured for NO3 −, Cl− and SO4 2−, using an ion chromatograph and following procedures described earlier (Reference Herron, Langway, Langway, Oeschger and DansgaardM.M. Herron and Langway 1985, Reference Finkel and LangwayFinkel and Langway 1985). The dust content and δ18O of the core samples were measured at the University of Copenhagen by Dansgaard and co-workers (unpublished).
A total of seven specimens was prepared for mechanical tests from the 1890m (θ = 0°−90°) and 1944m (θ = 90°) samples. Eight specimens from the 2006 m sample were prepared for mechanical tests (θ = 0°-90°). Ultrasonic wave velocity was measured along the stress direction on all deep specimens before and after mechanical testing. The chemical and dust content of the specimens was obtained from the general curves (Reference Hammer, Clausen, Dansgaard, Neftel, Kristindottir, Johnson, Langway, Oeschger and DansgaardHammer and others 1985, Reference Langway and Goto-AzumaLangway and Goto-Azuma 1988, this volume).
Uniaxial compression tests were made using an Instron model 1131 apparatus. Ultrasonic P-wave velocity was measured using a Krautkramer-Branson USL 38 instrument with a 2.25 MHz transducer and a silicone oil couplant. Temperature control for the compression tests was better than ±0.5°C. All experiments were performed in a cold-room laboratory, where temperatures were held constant between −17 and −13°C in order to approximate the in-situ temperature conditions.
RESULTS AND DISCUSSION
The experimental test and measurement data from the 268 m sample specimens are summarized in Figure 1 and listed in Table I. Figure 1b shows the main stratigraphie features of the core samples; the up-direction is to the left. Note the pronounced ice layers and lenses (IL) located near the center of Figure 1b and stratigraphically just above the δ18O summer peaks as shown in Figure 1h. This suggests that melt from a succeeding warm summer percolated downward and enhanced the thicknesses of previously existing lower and thinner ice layers. This interpretation explains the large anion peaks (1f) which are stratigraphically coincident with the ice layers. The detailed chemistry results are shown in Figure 2, where the correlation is much clearer. Both the ice layers and the chemistry peaks are slightly out of phase with the δ18O curve. The scattered-light intensity measurements (1c) agree in general with the ice-layer features. This occurs because when the melt which makes up the mass of the ice layers refreezes, it tends to exclude or suppress air-bubble re-formation, resulting in reduced light scatter. Figure 1d shows average crystal size, S, for the seven specimens. Size ranges from 2.0 to 2.4 mm. The ultrasonic wave velocity, which was measured along the long-core axis, is shown in Figure 1e. The range in velocity is in agreement with other data between the 200 and 600 m depths (Reference Herron, Langway, Brugger, Langway, Oeschger and DansgaardS.L. Herron and others 1985) and reflects the existence of random-oriented c-axis fabric patterns. The dust-concentration levels (1g) are relatively low, ranging from 27 to 52 ng/g, compared with the Wisconsin-age ice dust range of between 100 and 3000 ng/g. Figure 1a shows specimen numbers and the amplitude of the enhancement-factor values, E, calculated for the seven specimens. E(0°) ranges from 0.45 to 0.84. This value is similar to the values reported ealier for the 247 m depth (Reference Shoji and LangwayShoji and Langway 1985[b]), wjiere stress was applied to the specimens in a direction 45° inclined to the long-core axis (Es).
Experimental tests and detailed measurements on the 268 m sample. The sample was cut into seven specimens for mechanical testing purposes, and various other sizes or sections for the other properties listed in the left-hand column.


Detailed chemistry measurements from the 26S m sample. Thirty-four specimens were measured for Cl− (solid line) NO3 − (dotted line) and SO4 − (broken line), and compared with δ18O measurements by Dansgaard and co-workers (unpublished).

Stress-strain relationship of the 2006 m sample specimens. Uniaxial stress direction, θ, ranges from 0° to 45° from the vertical long-core axis. Strain-rate values are given above or below each curve.

Table II lists the results of the uniaxial compression tests on the 1890, 1944 and 2006 m specimens. Figures 3 and 4 show the strong anisotropy in the stress-strain curves for the 2006 m specimens. Measured strain-rate values range from 1.3 × 10⁻⁷ to 2.9 × 10⁻⁷s−1. Large yields are shown for the flow-stress data when stresses are applied parallel to (θ = 0°) or perpendicular to (θ = − 90°) the long-core axis.
Stress-strain relationship of the 2006 m sample specimens. Uniaxial stress direction, θ, ranges from 60° to 90° from the vertical core axis. Strain-rate values are given above each curve.

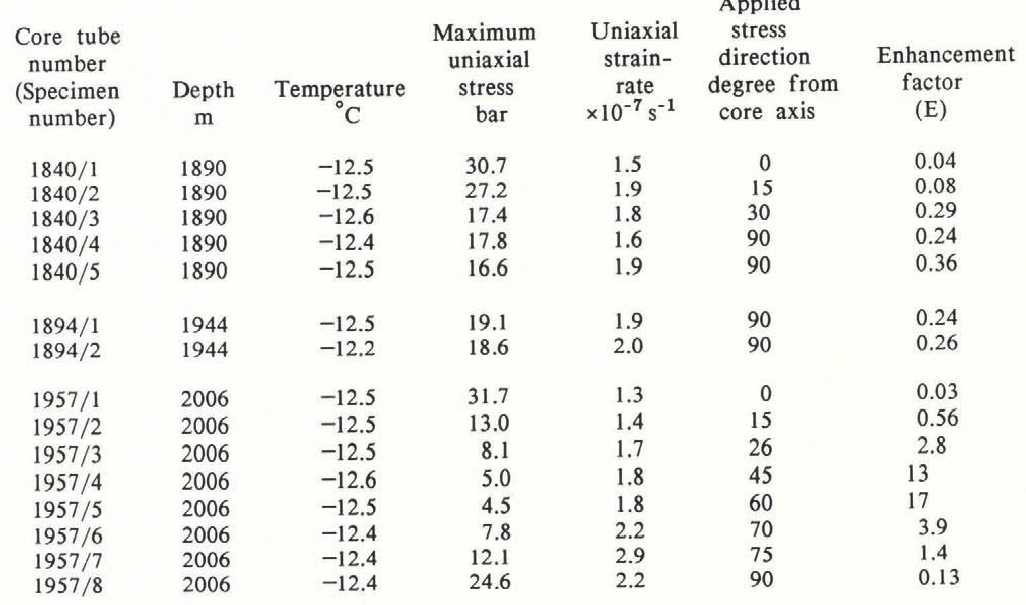
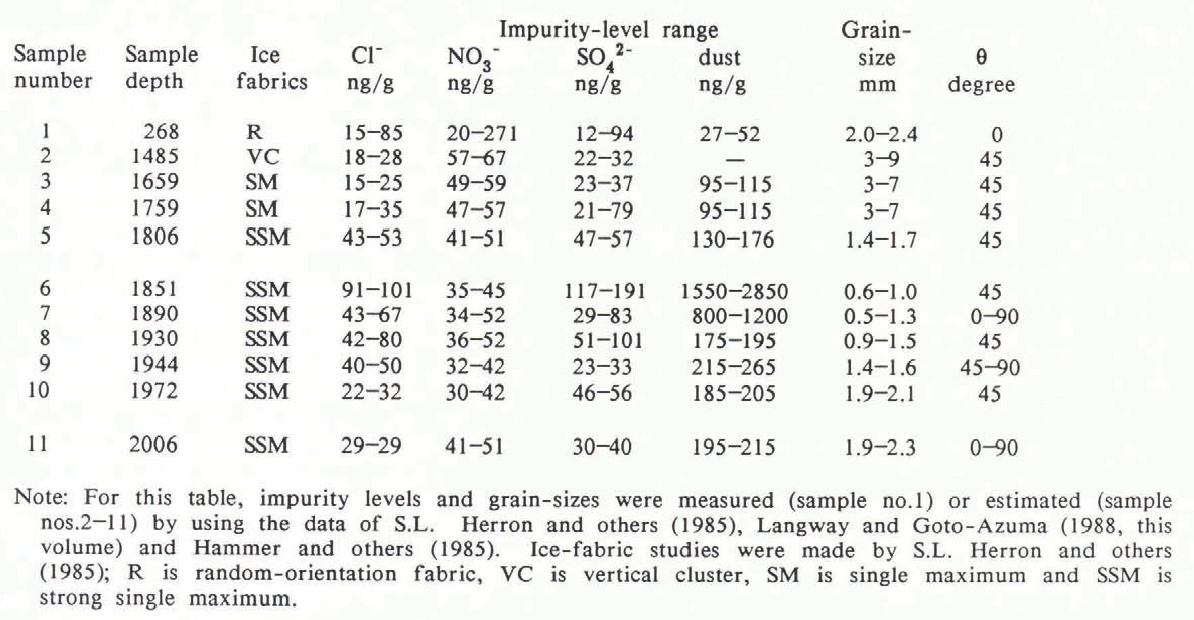
Figure 5 shows a plot of the stress-application direction, θ, versus the calculated enhancement factor, E(θ), for each test run for all of the fifteen Wisconsin-age ice samples in this study. Results from our previous experiments on the 45° stress direction are also included in Figure 5 (Reference Shoji and LangwayShoji and Langway 1985[b]). The horizontal dashed line, BTW, represents the E value (= 1) for randomly oriented laboratory ice (Reference Barnes and WalkerBarnes and others 1971). It is noted that the enhancement factor is quite sensitive to the stress direction and varies by more than two orders of magnitude. The θ dependency of E can be interpreted in terms of the resolved shear stress along the crystal basal plane perpendicular to each c-axis. The resolved shear stress has a maximum value when the crystal basal piane (slip plane) is inclined 45° from the stress direction. Since a dislocation glide motion is driven by the resolved shear stress, ice crystals produce the highest strain-rate when θ = 45°, resulting in a maximum enhancement-factor value. Table III lists all the various physical and chemical parameter measurements for specimens used in this study. As shown, the dust content for the 1890 m sample is three–five times higher than that of the 1944 and 2006 m samples. If dust has a softening effect, the E(θ) curve for the 1890 m depth sample (Fig. 5) should increase to higher E values compared to the other two samples. However, Figure 5 shows no such trend and it is concluded that the dust effect is small when compared with the c-axis orientation effect.
Enhancement factor, E, versus stress direction, θ, for the 1890, 1944 and 2006 m samples.

Ultrasonic wave-velocity measurements versus calculated enhancement-factor values for all specimens discussed in this study. Sample depth ranges from 268 to 2006 m.

Figure 6 is a plot of ultrasonic wave-velocity measurements made on each specimen before the uniaxial testing, as shown in Table III. The ultrasonic velocity was measured along the longest dimension of each specimen, i.e. parallel to the uniaxial stress direction. The lower velocity values indicate that the pole direction of c-axis orientations is inclined closer to 45° from the wave-propagation direction. The higher velocity values indicate the pole direction is inclined nearer to parallel or perpendicular to the wave-propagation direction (Reference Langway and Goto-AzumaLangway and others 1988, this volume). The inverse correlation between the velocity and the enhancement factor is clear in this semi-log plot.
This trend can be interpreted in terms of the resolved shear stress as discussed above. The data points of the 268 m sample show slight deviations from all other data points shown in Figure 5. The results of the high dust-content samples from 1851 and 1890 m (Table III) do not show a clear softening effect (higher E values) when compared with other data points from the depth interval between 1485 and 2006 m. The c-axis orientation fabrics of the 268 m sample are randomly oriented, whereas the 1485–2006 m samples have vertically preferred c-axis orientations which are classified as vertical-cluster, single-maximum or strong single-maximum (Table III). The deviation of the 268 m data is probably a result of variations in the type of the fabric pattern.
The regression line for 1485–2006 m depth data shown in Figure 5 is calculated by least squares as

where E is the strain-rate enhancement factor obtained by Equation 2 and V is the ultrasonic wave velocity in km/s. This empirical relationship (Equation 4) is used to interpret the deformational response of the Dye 3 samples below 1485 m to the uniaxial compression stresses, by taking into consideration the ice-fabric effect. By using Equation 4, the enhancement factor values of Es (= E(45°)) can be calculated from the ultrasonic velocities measured in a direction inclined 45° to the vertical long-core axis, which behave in an opposite way to the horizontal- or vertical-velocity changes.
CONCLUSION
The flow law for polar ice is best described by the general enhancement factor, E, which is a function of c-axis orientation patterns. These e-axes can rapidly be determined, using a new semi-automiatic ultrasonic wave-velocity measuring device. An impurity softening effect by Cl−, NO3 −, SO4 2− or dust was not observed to influence strongly the mechanical test results within the limits of this study. Consequently these findings indicate that c-axis orientation is the prime parameter for shear deformation below 1786 m at Dye 3, Greenland, but that more studies of the c-axis re-orientation process are required.
ACKNOWLEDGEMENTS
This work was supported by the U.S. National Science Foundation, Division of Polar Programs, grant no. DPP-8520911. We thank Dr W Dansgaard and his co-workers for their unpublished δ18O and dust measurements. Chemistry was measured in the laboratory by Carol Clemency.



