Implications
Spatially separating grass and clover into monoculture strips within the same field, as a concept to increase clover content in pasture and diet of grazing sheep, was tested experimentally. There was always more clover in spatially separated pastures than under the standard practice of a fine mixture, and clover grazing intake was greater. However, under continuously grazed pasture, clover became depleted because of the increased grazing pressure. Spatially separated pasture may lead to improved livestock performance, although the long-term effect on the pasture needs to be considered.
Introduction
A fundamental understanding of foraging and diet selection behaviour is a prerequisite for the development of sustainable grazing systems, whether for improved livestock production or environmental reasons (Edwards et al., Reference Edwards, Parsons and Bryant2008). A body of evidence shows that sheep have a partial preference for white clover (Trifolium repens L.) over perennial ryegrass (Lolium perenne L.), consuming 60% to 70% clover in their diet when given free access to both grass and clover side by side (Chapman et al., Reference Chapman, Parsons and Schwinning1996; Cosgrove et al., Reference Cosgrove, Parsons, Marotti, Rutter and Chapman2001; Rutter, Reference Rutter2006). This preference for clover may lead to a higher proportion of clover in the diet than that on offer in fine mixture pastures (Clark and Harris, Reference Clark and Harris1996). In turn, the selection of clover relative to grass in fine mixtures may place clover at a disadvantage, ultimately leading to less clover in the pasture and diet and lower performance of livestock (Parsons et al., Reference Parsons, Harvey and Johnson1991; Edwards et al., Reference Edwards, Parsons and Bryant2008).
Recently, spatially separating grass and clover into monocultures within a field, as opposed to the standard practice of a fine intermingled mixture, has been proposed as a way of equalising grazing pressure on grass and clover, and minimising the impacts of selective grazing (Chapman et al., Reference Chapman, Parsons and Schwinning1996). Sowing pure swards of grass and clover within the same field may also minimise foraging and selection costs associated with a mixed sward and improve diet quality (Marotti et al., Reference Marotti, Cosgrove, Chapman, Parsons, Egan and Anderson2001; Champion et al., Reference Champion, Orr, Penning and Rutter2004). Furthermore, several studies with sheep, cows and beef have shown livestock production per head is greater when stock graze spatially separated swards than when they graze mixed swards (Cosgrove et al., Reference Cosgrove, Parsons, Marotti, Rutter and Chapman2001; Rutter et al., Reference Rutter, Young, Cook and Champion2003; Solomon et al., Reference Solomon, Macoon, Lang, Parish and Vann2011).
A concern with the use of spatially separated monocultures is that grazing pressure on the clover relative to the grass may be enhanced, leading to lower clover abundance, overgrazing and ultimately less clover in the diet. Furthermore, if sheep concentrate their grazing in the clover parts of the pasture, then the transfer of nitrogen to the companion grass, through dung and urine, may be reduced, potentially leading to lower overall grass production (Edwards et al., Reference Edwards, Parsons and Bryant2008). In this context, narrow strips of alternating grass and clover within the same field may be a useful strategy for balancing plant competition and selective grazing with the transfer of nitrogen. However, this will depend on the effect of the spatial scale of the diet on foraging decisions of livestock, in particular whether livestock switch their preference from clover to grass, as the clover availability declines in the pasture (Parsons et al., Reference Parsons, Thornley, Newman and Penning1994). Rook et al. (Reference Rook, Harvey, Parsons, Penning and Orr2002) noted that, over 12 weeks, sheep grazing on adjacent monocultures of grass and clover sustained their preference for clover, despite a falling clover sward surface height (SSH).
In this study, sheep grazed grass–clover pastures over 21 weeks, in two grazing periods, one with ewes with single lambs and one with only ewe lambs. The spatial distribution was varied across four treatments from fine mixtures, to alternating strips of grass and clover of different widths, through to adjacent monocultures of grass and clover within the same field. The objective of the study was to examine the effects of spatial separation of grass and clover on foraging strategies of sheep, and on the relative long-term availability of grass and clover induced as a result of selective grazing by the animals.
Material and methods
Experimental site
The experiment was located on the Wye Campus estate, Kent, UK (UK Grid Ref. No.: TR 056 462). The soil at the site is classified as free-draining loamy soil with high natural fertility (Magic, 2006). Soil samples taken at the site before the experiment began and analysed using the methods described in MAFF (1986) showed: pH = 5.5, extractable potassium = 71 mg/l and extractable phosphorus = 15 mg/l. Lime was applied at 2.5 t/ha on 6 March 2002 to the whole experimental area to increase the pH to 6.0 (Parkinson, Reference Parkinson2003). The samples also indicated slight deficiency in potassium and phosphate, therefore the whole experimental area was also fertilised on 6 March 2002 with 22 kg P/ha and 42 kg K/ha (MAFF, 2000). Pasture was established by spraying with glyphosate herbicide in April 2001, cultivating in June and July 2001 and sowing on 1 September 2001. The sown species were L. perenne L., cultivar ‘Agri’ and T. repens L., cultivar ‘Kent Wild White’.
Experimental design
The experimental design was three replicates of four pasture treatments arranged in a randomised complete block, with each of the 12 plots having an area of 0.175 ha (36 m × 48.5 m). The four treatments were: (i) fine mixture of ryegrass and white clover, (ii) 24 alternating 1.5 m monoculture strips of ryegrass and white clover, (iii) 12 alternating 3 m monoculture strips of ryegrass and white clover and (iv) adjacent monocultures equating to an 18 m strip of white clover beside an 18 m strip of ryegrass. Perennial ryegrass was sown at 25 kg/ha in grass monocultures and 15 kg/ha in mixtures. White clover was sown at 5 kg/ha in both monocultures and mixtures. All seeds were sown at a depth of 1 cm in 15 cm drill rows, with one pass of the harrow after sowing to ensure that seeds were covered by soil.
Animals
From 6th April 2004 until weaning on 7th June 2004, each plot was stocked 24 h a day with three purebred Suffolk ewes, each with a single February-born lamb. Ewes and lambs were all offered a common diet of grass–clover pasture in the field surrounding the trial for a minimum of 4 weeks before the start of the trial. From 12th July 2004 to 4th October 2004, they were continuously grazed by seven weaned ewe lambs without their mothers. Stocking rates were selected to maintain the mean sward height averaged across grass and clover at the optimum of 7 to 12 cm (Frame, Reference Frame1993) and this is seen in the higher stocking rate in the second grazing period reflecting lower body weight of lambs. Stocking rates were 34.2 animals/ha before weaning (both ewes and lambs) and 40.0 animals/ha after weaning. Stocking densities and mean starting liveweight, according to grazing period, age class and treatment are given in Table 1. Animals did not receive supplementary feed at any stage. Water was provided within each plot and some shade was present at certain times of the day in each plot by nearby trees.
Stocking rate and mean starting weight, for both ewes and lambs, on each of the treatments, for each grazing period

Measurements
SSH
Eighty SSH measurements per plot were made at random (40 each on grass and clover monocultures) at 10-day intervals from April to November, using a sward stick (Frame, Reference Frame1993).
Herbage mass and clover morphology
Herbage mass was measured by cutting two randomly placed 25 cm × 25 cm quadrats in each monoculture in each treatment to ground level on six occasions. In the fine mixture treatment, four quadrats were cut at random locations. Sub-samples of fresh herbage were sorted into clover and grass (all species), and oven dried at 65°C to obtain dry weight of each sward component (Schmidt et al., Reference Schmidt, Marten and Goodrich1970). The sampling process was repeated monthly, from 1 April to 1 September.
Clover morphology was measured on 7 June 2004 at the end of the first grazing period, after being stocked with both ewes and lambs. Six circular cores (diameter 6.75 cm, depth 15 cm) were taken at random in the fine mixtures and six each from grass and clover monocultures from spatially separated treatments. Soil was washed from each core, the root mat removed and plant material sorted by species and dissected into their component parts. For all clover material present, the number of leaves, stolon segments, petioles, growing points, axillary buds and growing points were recorded (Brock et al., Reference Brock, Hay, Thomas and Sedcole1988). In addition, 40 leaves were selected at random, their petiole lengths measured and leaf area recorded using a leaf area meter. A sub-sample of stolon, with a known length was removed to calculate its density (g DM/m). The separate components were dried in a pre-heated forced-draught oven at 65°C (Schmidt et al., Reference Schmidt, Marten and Goodrich1970) and then weighed to obtain the dry weight of each component.
Grazing behaviour
The grazing behaviour of the ewes only, not the lambs, on all plots was observed on 8 April, 10 May and 27 May 2004, using a method similar to Rook et al. (Reference Rook, Harvey, Parsons, Penning and Orr2002). Two adult ewes per plot were selected at random at the start of the study and marked. On each measurement day each marked animal was observed by eye, within minutes of one another, by visual scanning of all of the plots. Each marked animal was observed every 10 min between dawn and dusk. Observations did not take place at night; however, as found in previous studies (Penning et al., Reference Penning, Rook and Orr1991), intake is taken to be low, and it is assumed that dietary preference is likely to be similar. The activity of the animal (eating or not eating) and position, on spatially separated plots only (grass or clover monoculture), were recorded. It was not possible to assign on which species animals were grazing in the fine mixture treatments. Animals were recorded as eating if they were standing, with their heads down, and were actively biting the sward. It cannot be conclusively determined that the grazing behaviour and selective grazing observed in the first grazing period were present during the second grazing period.
Herbage intake and dietary preference
Dry matter (DM) intake on grass and clover during daylight hours were calculated by multiplying the observed grazing times by an intake rate (IR) appropriate to the current SSH of each species. Penning et al. (Reference Penning, Parsons, Orr, Harvey and Champion1995) described the derived regression relationship between IR of grass and clover and SSH for lactating ewes:
 $$ {\rm{Clover}}\;{\rm{IR}}\;({\rm{g}}\,{\rm{DM/min}})\, = \,2.20\, + \,0.53\,\times \,{\rm{SSH}}\;({\rm{cm}}) $$
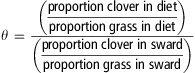
These relationships were based on observations taken over 1h in the morning and may under- or over-estimate intake when used at other times of the day (Rook et al., Reference Rook, Harvey, Parsons, Penning and Orr2002). It was, however, not feasible to determine the relationship between IR and SSH during the experimental period. To provide information on the species selection of the grazing sheep, a selection coefficient for clover (θ) was calculated using the method of Ridout and Robson (Reference Ridout and Robson1991):
 $$\displaystyle{\theta \, = \,\frac{{\displaystyle{\left( {\frac{{{\rm{proportion}}\;{\rm{clover}}\;{\rm{in}}\;{\rm{diet}}}}{{{\rm{proportion}}\;{\rm{grass}}\;{\rm{in}}\;{\rm{diet}}}}} \right)}}}{{\displaystyle{\left( {\frac{{{\rm{proportion}}\;{\rm{clover}}\;{\rm{in}}\;{\rm{sward}}}}{{{\rm{proportion}}\;{\rm{grass}}\;{\rm{in}}\;{\rm{sward}}}}} \right)}}}$$
The proportion of each species in the sward was estimated using both SSH and mass of each species, by dividing either the SSH or mass of a species by the sum of the SSH or mass of both species (Rook et al., Reference Rook, Harvey, Parsons, Penning and Orr2002). If the value of the coefficient θ = 1 then there is no selection of clover over grass. However, the greater the value is above 1, the more likely clover is to be selected. Both calculation methods gave similar patterns of results; therefore, only selection coefficients using SSH are shown here. No estimates of intake or IR of individual species, and therefore selection coefficient, were made for animals grazing on the fine mixture plots, because of the inability to determine with certainty which species marked animals were grazing on. It must be noted that the regression relationships, described by Penning et al. (Reference Penning, Parsons, Orr, Harvey and Champion1995), used to estimate IR, have their own associated error (r 2 = 0.66), which are not considered in these analyses, and therefore there is likely to be significant error around these calculations.
Statistical analysis
For animal measurements, data from individual ewes were averaged to obtain 12 experimental units per day of sampling. For all other measurements, the mean of replicate measurements and observations at the plot level were used in statistical analyses. Values were analysed for each date in Genstat (release 11.1) using an ANOVA for a randomised block design with a priori orthogonal contrasts. Experimental units were grouped into blocks, with one replicate of the treatment factors, as described in ‘Experimental Design’ above, having been allocated at random to a unit within each block. Where all treatments were considered in analyses, the following contrasts were made: (i) fine mixture treatment v. strip treatments (1.5 and 3 m strips), (ii) fine mixture treatment v. adjacent monocultures treatment (18 m monocultures) and (iii) strip treatments (1.5 and 3 m strips) v. adjacent monocultures treatment (18 m monocultures). The 1.5 and 3 m treatments were grouped because of the spatial separation of the plant species both being as strips, and were an intermediary between the fine mixture and the adjacent monoculture treatments. Where only data from the spatially separated treatments were available, such as in the case of the IR for each pasture species, the following contrasts were made: (i) strip treatments (1.5 and 3 m strips) v. adjacent monocultures treatment (18 m monocultures) and (ii) 1.5 v. 3 m strips.
Results
SSH
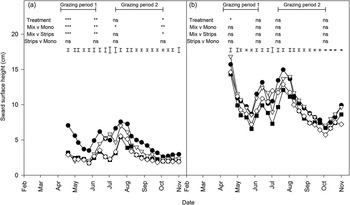
SSH of both grass and clover in their respective monocultures is shown in Figure 1. Across all treatments, grass was consistently taller than clover (P < 0.001). Clover SSH in the monoculture treatments declined quickly from ∼4 cm in April and 5 cm in August to ∼1.5 to 2.5 cm at the introduction of grazing pressure, whereafter it remained approximately constant. When grazing pressure was removed, as between grazing periods, clover SSH quickly recovered. During the first grazing period, clover in the fine mixture was significantly taller than the clover in the monocultures and remained taller throughout (Figure 1). In the second grazing period a similar effect was observed, but the difference between the fine mixture and spatially separated treatments was much less pronounced.
Mean Sward surface height (SSH) of clover (a) and grass (b) throughout the 2004 growing season (fine mixture (•), 1.5 m strips (▿), 3 m strips (▪) and adjacent monocultures (◊)). Statistical significance at the start and end of the grazing periods using an ANOVA, with orthogonal contrasts, are indicated as being *P < 0.05, **P < 0.01, ***P < 0.001 or not significant (ns). Error bars indicate pooled s.e.d.

Pasture mass and composition
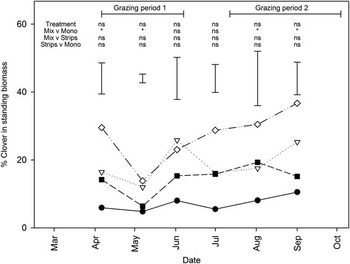
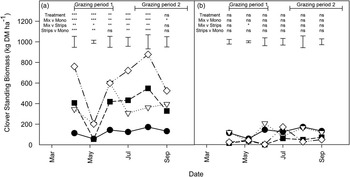
Clover standing biomass ranged from a mean of 66.1 kg DM/ha in the fine mixture treatments to 165.0 kg DM/ha in clover monocultures of the adjacent monoculture treatments. This equated to 5% to 10% and 6% to 37% of total biomass, respectively (Figure 2). Across all treatments, there was consistently more grass than clover in the standing biomass. During the first grazing period, clover standing biomass increased in all treatments. Similarly, in the second period it continued to increase in the fine mixture and 1.5 m strips, but in the 3 m strips and adjacent monocultures it declined. In clover strips, across all spatially separated treatments, clover-standing biomass was greater than in fine mixtures (Figure 3). In contrast, grass strips resembled fine mixtures.
% clover in standing biomass during the 2004 growing season (fine mixture (•), 1.5 m strips (▿), 3 m strips (▪) and adjacent monocultures (◊)). Statistical significance on each sampling date using an ANOVA, with orthogonal contrasts, are indicated as being *P < 0.05 or not significant (ns). Error bars indicate pooled s.e.d.

Standing biomass of clover present in 2004 in clover strips (a) and clover present in grass strips (b). (fine mixture (•), 1.5 m strips (▿), 3 m strips (▪) and adjacent monocultures (◊)). Statistical significance on each sampling date using an ANOVA, with orthogonal contrasts, are indicated as being *P < 0.05, **P < 0.01, ***P < 0.001 or not significant (ns). Error bars indicate pooled s.e.d.

Grazing behaviour
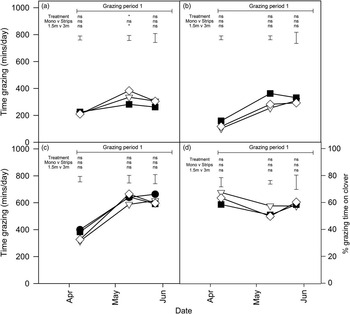
The time spent grazing on clover across all the spatially separated treatments was ∼200 min/day on the first observation date (Figure 4). This then increased and levelled off at ∼300 to 350 min/day on the second and third observation dates. There were no significant differences between treatments. The time spent grazing on grass increased through the sampling dates, from ∼120 to 300 min/day (Figure 4). The total time spent grazing increased from ∼350 to ∼600 min/day across all treatments, with no statistically significant differences between treatments being observed.
Time grazing (min) on clover (a), grass (b), total (c) and percentage time grazing on clover (d) by ewes in 2004 (fine mixture (•), 1.5 m strips (▿), 3 m strips (▪) and adjacent monocultures (◊)). Statistical significance on each observation day using an ANOVA, with orthogonal contrasts, are indicated as being *P < 0.05 or not significant (ns). Note different y-axis in Figure 4d. Error bars indicate pooled s.e.d.

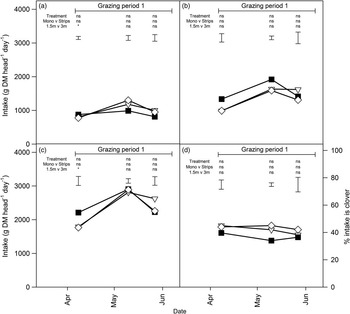
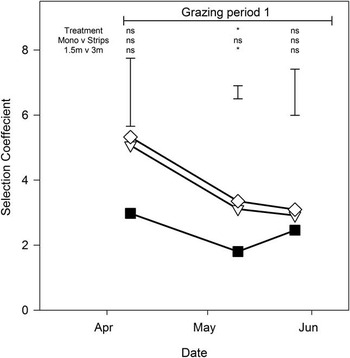
An estimate of intake shows that clover intake varied across all treatments between 800 and 1300 g DM/head per day, whereas grass intake was more variable, between 1000 and 2000 g DM/head per day (Figure 5). These values show that the daily intake of grass was significantly greater than that of clover. Total intake ranged from 1800 to 2900 g DM/head per day and was greatest on the second observation day. There were no clear differences in daily intake between treatments. Figures 4 and 5 show that the ewes spent 50% to 70% of their grazing time grazing on clover, whereas only 35% to 45% of their intake was clover. There were no significant differences between treatments for either the percentage of grazing time spent grazing on clover or the percentage of clover in the diet. The selection coefficient (θ) for clover declined from 5 to 3 for 1.5 m strips and adjacent monoculture treatments, and from 3 to 2 for the 3 m strip treatment (Figure 6). Despite declining, the selection coefficient remained greater than 1 across the observation days, whereas the SSH of the clover, over the three observation days, declined linearly from 3 to 2 cm (Figure 1).
Estimated intake (g dry matter (DM)/head per day) of grass (a), clover (b), total (c) and percentage of intake is clover (d) on spatially separated treatments by ewes in 2004 (1.5 m strips (▿), 3 m strips (▪) and adjacent monocultures (◊)). Statistical significance on each observation day using an ANOVA, with orthogonal contrasts, are indicated as being *P < 0.05 or not significant (ns). Note different y-axis in Figure 5d. Error bars indicate pooled s.e.d.

Selection coefficient for clover on spatially separated treatments by ewes in 2004 (1.5 m strips (▽), 3 m strips (▪) and adjacent monocultures (◊)). Statistical significance on each observation day using an ANOVA, with orthogonal contrasts, are indicated as being *P < 0.05 or not significant (ns). Error bars indicate pooled s.e.d.

Clover morphology
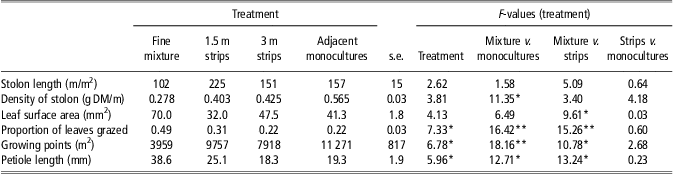
Compared with a fine mixture, clover found in spatially separated treatments had a lower proportion of leaves grazed, shorter petioles and more growing points per unit area (Table 2).
Selection of morphological characteristics of clover found across treatments
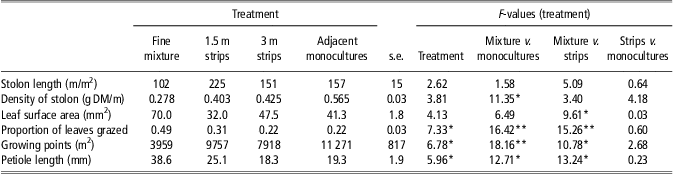
Note only data from clover found in clover monocultures is shown for the spatially separated treatments.
Statistical significance indicated as being *P < 0.05 and **P < 0.01, with a pooled s.e.
The clover stolon material found was significantly denser (P < 0.05), with greater weight per unit length, in the clover monocultures (mean 0.464 g DM/m) than in the fine mixture treatment (0.278 g DM/m). Similarly, there were significantly more clover growing points per unit area in the clover monocultures than in the grass monocultures (P < 0.001).
Table 2 also shows that clover in monocultures had significantly smaller leaves (P < 0.05; mean 40.3 mm2) than when growing in the fine mixture (mean 70.0 mm2), and they also had shorter petioles (P < 0.05; means 20.9 and 38.6 mm, respectively). Petiole length also showed significant response to treatment, with clover in the fine mixture treatment having longer petioles than in the spatially separated treatments (P < 0.05).
The proportion of clover leaves grazed in the fine mixture (0.49) was significantly greater (P < 0.001) than in the clover monocultures (0.25; Table 2). There were also differences between treatments, with clover in the 1.5 m strip treatment having a greater proportion of its leaves grazed than in the other spatially separated treatments.
Discussion
The aim of this study was to determine the effect of spatial separation of pasture species at different spatial scales on sheep grazing behaviour and intake, and the subsequent long-term effects it may have on pasture characteristics.
When presented in pure swards of grass and clover in strips or adjacent monocultures in the first grazing period, ewes initially spent ∼60% of their time grazing on clover, achieving a diet of ∼40% clover based on DM intake, and this changed little through time. The proportion of clover in the diet is lower than several previous studies (Cosgrove et al., Reference Cosgrove, Parsons, Marotti, Rutter and Chapman2001; Champion et al., Reference Champion, Orr, Penning and Rutter2004; Rutter, Reference Rutter2006), although values of ∼45% to 50% of time spent grazing on clover have been reported (Rook et al., Reference Rook, Harvey, Parsons, Penning and Orr2002). Clover in the pure swards was very short (<3 cm), which would have led to a lower IR (Penning et al., Reference Penning, Parsons, Orr, Harvey and Champion1995); this is likely to be the reason for the observed low percentage of DM intake from clover. These findings are supported by that of Rook et al. (Reference Rook, Harvey, Parsons, Penning and Orr2002), who studied grazing behaviour of sheep on adjacent monocultures for a 12-week period. They attributed the decline in DM intake from clover from 60% at the start of their study to 25% at the end of their study to the falling SSH of clover, and consequent resource depletion. Therefore, the grazing ewes in the spatially separated treatments during the first grazing period were not able to select their preferred diets. This is in contrast to short-term preference studies (Cosgrove et al., Reference Cosgrove, Parsons, Marotti, Rutter and Chapman2001; Champion et al., Reference Champion, Orr, Penning and Rutter2004), which use adjacent monocultures to allow animals to select their preferred diet.
Parsons et al. (Reference Parsons, Thornley, Newman and Penning1994), on the basis of simulations with a mechanistic model of foraging, suggested that as clover availability declined, animals would reduce the proportion of clover in their diet, and would eventually switch their preference to a diet of pure grass. However, as the percentage of clover in the diet did not alter through time in the first grazing period, there was little evidence in this study to suggest that the ewes in this experiment switched their grazing preference from clover to grass as clover became shorter. In addition, the calculated selection coefficient, as a measure of selection with respect to availability of clover, was maintained above one, and, despite the declining SSH of clover, grazing time on clover increased. This indicates a sustained preference for clover over grass.
Altering the spatial scale by sowing pure swards of grass and clover in 1.5, 3 and 18 m alternating strips appeared to have negligible effect on diet preference during the first grazing period. Grazing time and DM intake from clover did not differ among strip widths. Rutter et al. (Reference Rutter, Cook, Young and Champion2005) showed that grazing dairy cows were not able to select their preferred diet when the strip width of ryegrass and white clover was decreased from 36 to 12 cm. However, in this study with sheep the narrowest sown strip was 150 cm.
Champion et al. (Reference Champion, Orr, Penning and Rutter2004) showed in a short preference study that those sheep on fine mixture pastures of grass and clover spent more time grazing than those on adjacent monocultures. They suggested that this was because of the extra time it took to search for clover in a fine mixture pasture, whereas with adjacent monocultures clover was easily accessible. In the current study, a comparison of the fine mixture v. the spatially separated treatments during the first grazing period showed little effect on grazing time. This may also be attributed to the short SSH of clover in the monocultures. In Champion et al. (Reference Champion, Orr, Penning and Rutter2004) a SSH of clover was maintained around 6 cm; this would have enabled a greater IR of clover, requiring less grazing time. In the first grazing period of this study, ewes forfeited their potential extra grazing time to select their preferred diet. By selecting short clover, more time was required to consume the same amount of clover, because of its low IR, and there was a subsequent increase in overall grazing time.
The experiment was designed to be long term so that the effects of spatial separation of pastures on the relative availability of grass and clover induced by the animals as a result of selective grazing could be observed. The clover found in all pure swards when under grazing, regardless of strip width, was short (<3 cm) and was always shorter than the clover in the fine mixture. Furthermore, clover in pure swards at the end of the first grazing period had characteristics of intense grazing (Brock et al., Reference Brock, Hay, Thomas and Sedcole1988), with a greater proportion of the leaves grazed, shorter petioles and greater growing point density than the clover in the mixed swards. In contrast, the grass, although declining in height through the grazing periods, remained taller in all pure swards and mixtures than the clover monocultures. It is, however, not possible to assign all differences to selective grazing. First, because of grazing behaviour of ewes only being observed in the first grazing period, there is no certainty that it was sustained by the lambs in the second grazing period. Second, it is important to consider that the clover grown in monocultures experienced differing plant–plant competition compared with that in the fine mixture, that is, greater intra-specific than inter-specific competition and vice versa. However, it is unlikely that the level of competition experienced by clover in the clover monocultures of the spatially separated treatments varied significantly between treatments because all clover was grown in monocultures.
The difference observed here between the SSH of grass and clover confirms previous studies that in both the short and medium terms, clover will be grazed to a shorter SSH than grass (Carrère et al., Reference Carrère, Louault, Carvalho, Lafarge and Soussana2001; Rook et al., Reference Rook, Harvey, Parsons, Penning and Orr2002). However, there is no evidence to support the hypothesis that clover would be grazed to extinction (Harvey et al., Reference Harvey, Parsons, Rook, Penning and Orr2000). It is also noteworthy that despite clover being heavily grazed, and therefore short, spatially separated treatments contained more clover than the fine mixture treatment, both on a total biomass per unit area and a percentage biomass basis. The adjacent monocultures treatment showed the greatest proportion of clover, with the highest value of 38% DM. Though it was less than this value, the strip treatments (1.5 and 3 m strips) showed a greater clover content throughout the study (18% to 25%) than the fine mixture (9%). This has the potential to improve livestock performance through improved diet quality although effects of separation on DM production need further consideration.
Both this and past studies indicate that spatial separation enables sheep to graze large areas of high clover content, in an attempt to select their preferred diet of ca. 70% clover, without the associated foraging cost of searching (Chapman et al., Reference Chapman, Parsons and Schwinning1996; Cosgrove et al., Reference Cosgrove, Parsons, Marotti, Rutter and Chapman2001; Rutter, Reference Rutter2006). However, with this comes an increase in grazing pressure (Rook et al., Reference Rook, Harvey, Parsons, Penning and Orr2002), which can cause changes in clover's morphology (Rutter et al., Reference Rutter, Orr, Yarrow, Champion, Atkinson and Cook1999; Brock and Hay, Reference Brock and Hay2001). Leaves were shown to be smaller, with shorter petioles. This therefore can influence grazing behaviour, as these characteristics reduce bite mass and therefore IR (Parsons et al., Reference Parsons, Thornley, Newman and Penning1994). One possible method of overcoming this problem may be to rotationally graze spatially separated pastures, giving clover time to recover between bouts of grazing. Another possible avenue for future research may be to construct spatially separated pastures within which 70% of the area is sown to clover monoculture and 30% to grass monoculture, thereby reflecting the preferred diet of ca. 70% clover in sheep.
As hypothesised, spatial separation in the long term, when compared with a fine mixture, increased clover availability; however, during the first grazing period ewes attempted to select their preferred diet, at the expense of maximising their intake, even when clover SSH was low. This resulted is significant changes to the morphology of clover. Spatial separation in the short term may therefore allow grazing animals to select their preferred diet; however, in the long term in continuously grazed pasture, as their preference for clover depletes its availability, they are prevented from achieving it.
Acknowledgements
This field experiment was funded by the British Ecological Society and J. Sharp was funded by a BBSRC scholarship. The authors would like to thank Dr Andrew Ferguson, Norma Wilson, Brian Peacock and Dan Barker for their assistance with field and laboratory work.