I. INTRODUCTION
High performance filament (e.g. fiber glass, carbon fiber, aramid etc.) properties are of considerable interest for their use as reinforcement in composite materials. Prior characterization has primarily considered the macroscale (i.e. entire filament) properties of fibers through various microtensile testing and compression techniques.1–Reference Singletary, Davis, Ramasubramanian, Knoff and Toney11 In this study, the focus will be on material deformation under indentation and measuring the local properties of isotropic, homogeneous E-glass fibers in the radial direction.
A. Traditional indentation theory: the Oliver-Pharr method
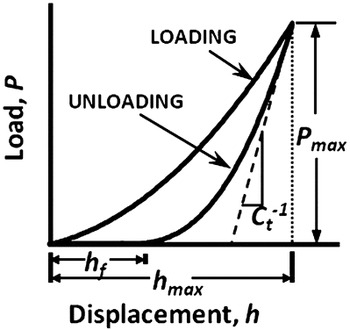
The Oliver-Pharr methodReference Oliver and Pharr12 is the universally accepted data reduction technique for instrumented indentation, or nanoindentation. Elastic modulus, E, and hardness, H can be extracted from a nanoindentation experimental load (P) versus displacement (h) curve (Fig. 1). The total elastic compliance of the contact, C t, is defined by the reciprocal of the slope of the unloading curve fit at maximum indentation depth,  at h max.
Indentation P versus h curve. The linear, dashed line is indicative of the slope of the unloading curve at maximum indentation depth, given by the reciprocal of the total elastic contact compliance, C t−1.

When all of the assumptions of the Oliver-Pharr method are satisfied, a reduced modulus (E*), or effective probe-material indentation modulus, can then be determined from bulk indentation measurements using Eq. (1). Equation (2) models the indentation “system” of two bodies (i.e., sample and indenter) as two springs in series, where the effective modulus is the plane strain modulus, E/(1 − ν2); and the material hardness is given by Eq. (3).
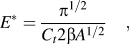
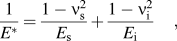

In Eq. (2), the subscripts “s” and “i” represent the sample and the indenter properties, respectively, of elastic modulus (E) and Poisson’s ratio (ν). In Eqs. (1) and (3), β is a constant dependent on probe shape (e.g. β = 1 for a spheroconical tip), and A is the projected area of the indenter probe as a function of the contact depth h c. Calculation of H is straight forward from Eq. (3), and sample modulus can be computed by successively applying Eqs. (1) and (2) to P versus h data.
Sample material properties can also be deduced using the continuous stiffness measurement method (CSM). In CSM mode, a small oscillation is superimposed on the quasistatic loading curve, and the total elastic contact compliance is related to the dynamic response of the system during contact.13 This method enables measurement of modulus and hardness with indentation depth from a single measurement.
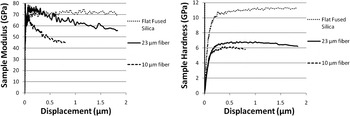
For a standard isotropic, homogeneous material such as fused silica, E and H should be independent of indentation depth. Further, the bulk elastoplastic properties of fused silica and E-glass should be approximately the same. Both materials are silica (SiO2) based glasses, although fused silica consists primarily of SiO2, while E-glass typically consists of ∼50–60% SiO2 and various other chemically substituted compounds and must conform to ASTM D 578 specifications.Reference Hausrath, Longobardo, Wallenberger and Bingham14, 15 E-glass fibers are spun from a melt state and their elastic moduli have been observed to be similar to that of fused silica.13, Reference Hausrath, Longobardo, Wallenberger and Bingham14 In Fig. 2, however, values of E and H in the radial direction of the glass fibers are significantly lower than the values for fused silica, decreasing as indentation depth increases. Reductions of 20 and 35% in modulus and 40 and 45% in hardness are observed for the 23 and 10 μm diameter filaments, respectively, at an indent depth of 8% of the filament diameter. From Eqs. (1) and (3), the differences in modulus and hardness with indentation depth on the fibers appear to be caused by an overestimation of elastic compliance and/or an overestimation of the probe projected area, or more generally an increase in the compliance of the fiber system. The trends observed indicate that this added compliance is a function of both indentation depth and fiber diameter. Herein, an instrumented indentation method is established to accurately measure the local elastic/plastic material properties of a single filament by accounting for the additional sources of compliance associated with filament indentation.
CSM plots of modulus (left) and hardness (right) comparing indentation of a standard fused silica sample and various E-glass single filaments.

B. Sources of compliance with filament indentation
Traditional indentation analysis typically involves the following assumptions:
(1) The indented material is:
Isotropic
Homogeneous
Flat (i.e. no curvature and has negligible surface roughness)
Semi infinite relative to the contact geometry
(2) The indenting probe can be defined by a smooth polynomial function.
(3) Sneddon’s power law relationships between load and displacement in the elastic regimeReference Sneddon16 are applicable.
Indentation of an E-glass filament perpendicular to the fiber axis violates the semi infinite and flat surface assumptions, leading to additional sources of indentation compliance that must be accounted for when applying the Oliver-Pharr data analysis technique. The sources of compliance can be broken into four categories:
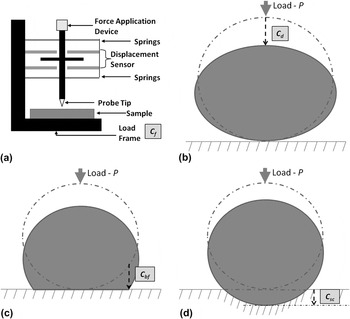
(1) Compliances that lead to fiber and/or substrate displacements in addition to indenter penetration of the fiber surface (Fig. 3).
C f [Fig. 3(a)]—Compliance of the load frame leading to displacements of the load frame. The actual corresponding displacements are not illustrated in Fig. 3.
C d [Fig. 3(b)]—Compliance of fiber diametric compression leading to diametric compression of the fiber.
C bf [Fig. 3(c)]—Compliance of the fiber at the fiber-substrate contact leading to bottom flattening of the fiber.
C sc [Fig. 3(d)]—Compliance of the substrate at the fiber-substrate contact leading to substrate compression.
Forms of compliance, depicted as displacements under an applied load, P, that could be involved during indentation of a fiber in addition to indenter penetration of the fiber surface. The dashed lines are positions of the fiber and substrate prior to loading, and the solid lines are the final positions due to: (a) C f—compliance of the load frame (actual displacements not illustrated); (b) C d—compliance of the fiber diametric compression; (c) C bf—compliance of the fiber bottom flattening at the fiber-substrate contact; and, (d) C sc—Compliance of the substrate compression at the fiber-substrate contact.

(2) Phase changes and/or changes in deformation mechanism during indentation of the fiber.
(3) Differences in the projected area of the indentation probe on the fiber surface relative to a flat surface.
(4) Compliance caused by the loss of radial constraint due to the fiber curvature, which results in modification to the long-range elastic stresses and displacements, and easier penetration into the fiber surface.
Each of these sources of compliance will be considered, and methods previously derived to account for indentation structural compliance will be implemented.
C. Prior approaches to account for indentation structural compliance
In early studies, boundary conditions were established which set a distance to a sample’s free edge where the lack of constraint began to influence first the elastic and eventually the plastic response of the substrate. Samuels and MulhearnReference Samuels and Mulhearn17 recognized that this effective distance was a function of the indent diameter. More recent efforts on fibers have involved indentation within the Hertzian contact regime (small strain, and entirely elastic), avoiding nonlinear contact altogetherReference Stan, Krylyuk, Davydov, Vaudin, Bendersky and Cook18–Reference Tan and Lim21; and use of the CSMReference Cayer-Barrioz, Tonck, Mazuyer, Kapsa and Chateauminois22 method and the Oliver-Pharr techniqueReference Wei, Bharat and Torgerson23–Reference Chang, Lin, Chen and Chang26 which depend heavily on the projected area of indentation. In general, a trend of decreasing values of material properties (E and H) with indentation depth was found, similar to Fig. 2. In two of these studiesReference Li, Gao, Murphy and Caswell24, Reference Chang, Lin, Chen and Chang26 direct measurements of area using atomic force microscopy (AFM) and finite element analysis, respectively, were used to compensate for contact on a curved surface. In spite of this, Chang et al.Reference Chang, Lin, Chen and Chang26 showed that the reduction in the values of material properties associated with an isotropic, homogeneous fiber was not entirely explained away by area correction, and additional compliance associated with fiber indentation must be accounted for.
Jakes et al.Reference Jakes, Frihart, Beecher, Moon and Stone27, Reference Jakes and Stone28 adapted a structural compliance correction, C s, for various loading scenarios (e.g.: cantilevered substrate or free edges) on samples with load-independent structural compliance and material properties (i.e., C s, E, and H are all constants and the material is assumed to be isotropic and homogeneous). This method enables measurement of the structural compliance incurred when the long-range elastic stresses and displacements of an indentation overlap an interface (i.e., free edge or finite dimensions). Following a study by Stone et al.,Reference Stone, Yoder and Sproul29 Jakes et al. showed that the structural compliance could be extracted from a plot of the product of the measured total compliance, C t, and the square root of the maximum load, P max, versus the square root of P max:

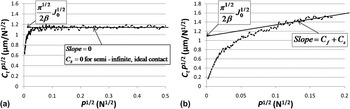
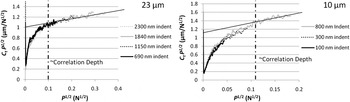
In Eq. (4), C f is the equipment frame compliance and J o the Joslin–Oliver parameterReference Joslin and Oliver30 equal to H/E *2, and a constant for an isotropic, homogeneous material. Figure 4 is an example of what Jakes et al. termed a SYS plot for indentation of 4(a) fused silica with a Berkovich probe (semi infinite, ideal contact) and 4(b) a 10-μm E-glass fiber with a spheroconical probe, both in CSM mode. The rounding of the plot at low loads has been attributed to the load required to reach a fully developed stress field,Reference Jakes31 and is typically removed from the plot and only shown here for explanative purposes. A linear fit of the steady state region (linear region) gives an intercept of  and a slope of C f + C s. The slope will give C s if the equipment frame compliance is known. The indentation compliance used for measurements of E and H is then given by (C t − C s − C f).
Representative SYS plot on (a) the semi infinite fused silica standard by a Berkovich indentation probe producing an ideal indentation and exhibiting no structural compliance; and (b) a 10 μm E-glass filament by a spheroconical indentation probe exhibiting structural compliance.

To date, the use of this method has not been investigated on filament samples. The nature of the model is such that, as long as all of the compliances are linearly elastic, C s could account for all of the additional displacement compliances (i.e., item (1) of the sources of compliance in Sec. I. B) and the compliance due to loss of radial constraint manifesting itself as easier penetration into the fiber surface (i.e., item (4) of the sources of compliance in Sec. I. B). However, for this study, it is desirable to account for the additional displacements separately, and isolate the compliance due to local loss of radial constraint about the indent in the form of C s. The application of this method works best when only the long-range elastic stresses and displacements overlap the interface. It is understood that the plasticity of the indent can also play a role in increasing the compliance but it is less defined in terms of this model. The accuracy of this approach will be assessed in this study.
II. EXPERIMENTAL PROCEDURE
A. Materials and sample mounting procedures
To assess the effects of fiber curvature on the mechanical response to indentation, three types of samples were employed: an unsized, nominally 23-μm diameter E-glass fiber [Fiber Glass Industries, Inc. (FGI, Inc.), Amsterdam, NY], an unsized, nominally 10-μm diameter E-glass fiber (AGY), and a flat, fused silica indentation standard (Agilent Technologies, Santa Clara, CA). Each of these samples is assumed to be homogeneous and isotropic throughout the sample volume.
Indentation on a single filament requires that the fiber be secured laterally and vertically to avoid any arbitrary deflections. Prior efforts have included (a) relying on electrostatic/friction contact forces,Reference Stan, Krylyuk, Davydov, Vaudin, Bendersky and Cook18, Reference Tan and Lim21, Reference Cayer-Barrioz, Tonck, Mazuyer, Kapsa and Chateauminois22, Reference Li, Gao, Murphy and Caswell24 (b) securing at the ends of the filament,Reference Feng, Nix, Yoon and Lee19 (c) applying a drop of adhesive at the ends of the filament and relying on capillary effects to pull the adhesive along the bottom surface of the fiber to secure the majority of the fiber length,Reference Lonnroth, Muhlstein, Pantano and Yue20 and (d) applying a layer of adhesive beneath the entire filament length.Reference Wei, Bharat and Torgerson23 Procedures (a) and (b) were found to be sufficient for low load contacts but not for larger, nonlinear indentations. Furthermore, relying on filament-resin wetting properties, i.e., procedures (c) and (d), to secure the fiber was found to be highly variable and dependent on normal surface pressure of the filament, curing cycles of the resin, and overall wetting properties of the fiber; unsatisfactory results included incomplete cure of the resin and coating of the filament indentation surface.
To affix the entire length of the fiber and avoid unwanted wetting of the filament surface, a thermoplastic softening technique was developed using an 860,000 Mw polystyrene (PS). The PS was first diluted to ∼10 wt% using tetrahydrofuran (THF). A glass cover slip (18 × 18 mm) was then surface-saturated with the solution and spun at 8300 RPM for 30 s. At the conclusion of the spinning, the THF had dried and a uniform 1–3 μm layer of PS (typically less than 25% of the fiber diameter) was present on the glass substrate.
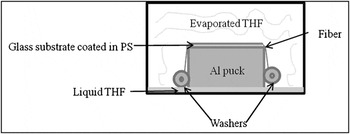
Each single filament was secured at each end to weights (washers with a mass ∼0.7 g, which resulted in a stress less than 2.5% of the tensile strength of all fibers under considerationReference Hausrath, Longobardo, Wallenberger and Bingham14), and draped over an elevated glass-PS substrate (see Fig. 5). To ensure fiber contact over the entire length of the substrate, a second glass slide was placed over the fibers (∼0.117 g). The entire system was then sealed in a THF vapor-saturated environment for 15 min to soften the PS and allow the bottom of the fiber to embed into the PS layer, which then provides lateral support to the fiber. Upon removal of the system from the enclosure, the PS re-dried and the fiber was secured. The effect of THF on the glass fibers was assumed to be negligible.Reference Longobardo32
Single filament mounting schematic.

B. Instrumented indentation
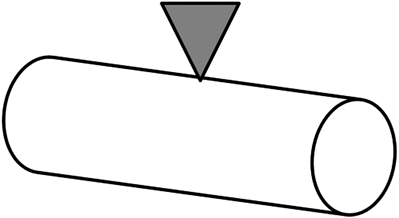
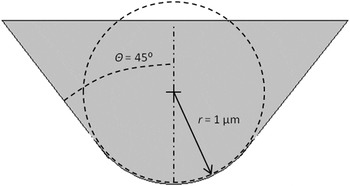
Indentations were performed with the NanoIndenter XP (Agilent Technologies, Santa Clara, CA) on the E-glass fibers in the radial direction, as indicated in Fig. 6, and on fused silica. The indenter was equipped with a 1 μm radius, 90º spheroconical diamond probe (Fig. 7). The geometry of this probe leads to a spherical correlation depth of approximately 290 nmReference VanLandingham, Juliano and Hagon33; i.e., for indentation contact depths less than ∼290 nm, spherical contact dominates, whereas for indentation contact depths greater than ∼290 nm, conical contact dominates. For the 23-μm fiber, radial indentation was performed to depths of 10, 8, 5, 3, and 1% of the fiber diameter (i.e., 2300, 1840, 1150, and 690 nm). Indentation depths for the flat fused silica sample were identical to those for the 23-μm fiber. For the 10-μm fiber, indentation depths of 800, 300, and 100 nm (i.e., 8, 3, and 1% of the fiber diameter) were used. The indentations were made in CSM mode at a target loading strain rate of 0.05/s (variable load rate), unloading rate equal to the maximum loading rate, no hold period, and an oscillation frequency of 45 Hz and target amplitude of 2 nm. The data was subject both to CSM and Oliver-Pharr unloading analysis.
Radial indentation schematic.
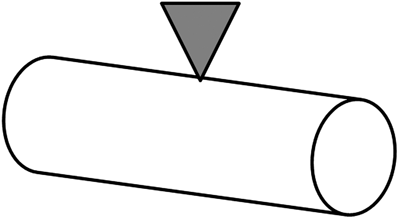
1 μm radius, 90° spheroconical indentation tip schematic.

The probe area as a function of depth was defined using the standard method described in Oliver and Pharr (1992).Reference Oliver and Pharr12 The equipment frame compliance, C f, of the NanoIndenter XP used in this study was calibrated as part of the factory process, and automatically accounted for within the testing procedures. Our focus was therefore on the other experimental sources of compliance.
C. Atomic force microscopy
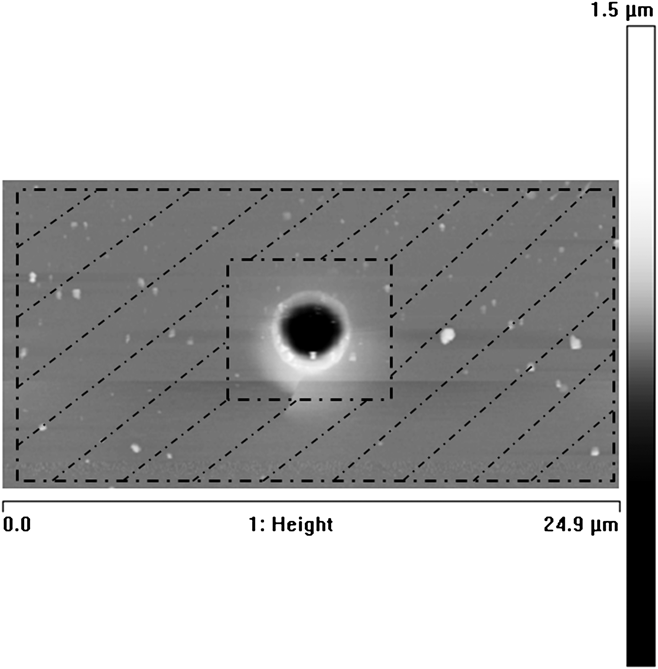
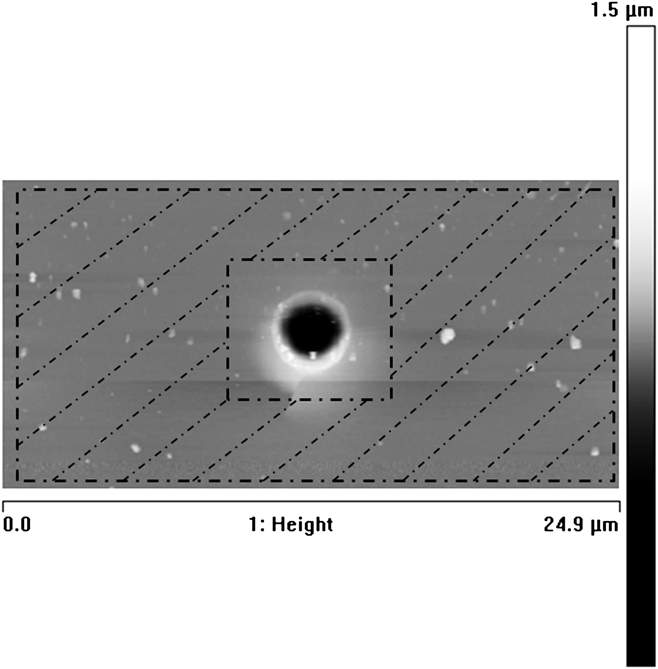
A Dimension 3100 Atomic Force Microscope (AFM; Bruker AXS, Santa Barbara, CA) equipped with a NanoScope V controller, a closed-loop, z-sensored scanning head, TappingMode Etched Silicon Probes (TESP), and Nanoscope 7 software for analysis was used for all AFM imaging. Because substrate surface roughness can lead to inadvertent surface detection and subsequently an overestimate of indentation area, AFM was used to measure the surface roughness of the indented samples. The image area used for the roughness measurements was greater than or equal to the largest indentation area in all cases (for example, see Fig. 8). Root-mean-square roughness (r RMS) values for each sample are reported as averages of 40–50 measurements taken after the images were subjected to a second order flattening procedure to remove the overall fiber curvature, leaving surface details essentially unaltered. In previous research,Reference Tai, Ming, Suresh, Palazoglu and Ortiz34 a threshold indentation depth, h*, was found such that indent measurements of depths h > h* will be relatively unaffected by surface roughness. This threshold depth was shown to be approximately 5r RMS. For all samples discussed herein, h* < 56 nm. Therefore, it is safe to conclude that indentation data beyond depths of 60 nm is accurate, and in fact, for all measurements, the indentation depths were >2h*, with most measurements made using depths >10h*.
AFM image after a second order flattening procedure in which permanent deformation remaining after indenting a 23 μm diameter glass fiber to a depth of 1150 nm is shown. The cross-hatched area indicates the area used for roughness measurements.
III. RESULTS AND DISCUSSION
A. Deformation response of fused silica and E-glass fibers—verification of fiber indentation procedures
From the expanding cavity model, as developed by JohnsonReference Johnson35, Reference Johnson36 to describe indentation contact mechanics, deformation is localized around the contact and the indentation stresses at significant distances from the contact are negligible. Prior studies have shown a plastic zone radius to indent depth ratio of only 2.5–3.5.Reference Chen and Bull37 As an example, an indent depth of 10% of the fiber diameter gives a maximum plastic zone size of just 35% of the fiber diameter, indicating that all plastic deformation is contained within the upper third of the fiber. The additional sources of deflection shown in Fig. 3 are associated with the contact area between the fiber and substrate. This area will be a function of the fiber diameter and an effective fiber length and will be much greater than the indentation projected area. Therefore, any of the additional deflections other than probe penetration into the fiber surface, shown in Fig. 3 and summed together as h other, will be associated with the elastic strains in the fiber/substrate, and will thus be recoverable.
Total deflection (h) for indentation of an isotropic, homogeneous, semi infinite half space (Oliver-PharrReference Oliver and Pharr12) is given by (5):

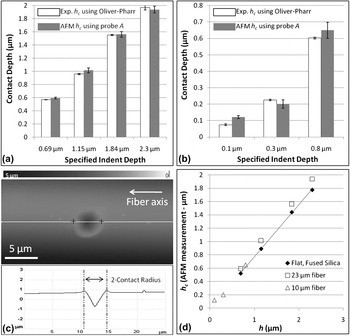
In Eq. (5),  is the deflection due to elastic sink-in and h c is the indentation contact depth determined from the P-h response.Reference Oliver and Pharr12 The presence of fiber curvature and additional compliance with fiber indentation violates the assumptions of Oliver-Pharr. This leads to an increased value of measurement of C t and possibly additional displacements other than indent penetration (h other) into the fiber surface. Additional displacements would be caused by the compliances indicated in Fig. 3 and described as “compliance source” (1) in Sec. I. B. Accounting for these additional displacements would involve the addition of h other to the right hand side of Eq. (5). Not accounting for them would result in an overestimation of h c using the Oliver-Pharr approach. The actual contact depth can be estimated from an AFM image of the residual indent. The residual indent radius is equivalent to the contact radius at maximum indentation depthReference Stilwell and Tabor38 and can be combined with the indentation probe area function to estimate the actual contact depth. In Figs. 9(a) and 9(b), the experimentally determined h c (using the Oliver-Pharr method) is compared to the h c value calculated for the 23- and 10-μm fibers, respectively, using AFM measurements of the contact radius along the fiber axis and the probe area function. The shallower indent depths are more sensitive to surface roughness and arbitrary surface contact, which likely contributes to the larger difference in h c values in Fig. 9(b) at an indent depth of 100 nm. It should be noted that growth of the contact area during unloading has been observed for indentation of some materials.Reference Chudoba and Jennett39, Reference Strader, Shim, Bei, Oliver and Pharr40 This can lead to errors in using the Oliver-Pharr method to calculate h c due to uncertainty in AFM measurements of the contact radius; errors of less than 5% in the contact radius and h c are expected.Reference Chudoba and Jennett39, Reference Strader, Shim, Bei, Oliver and Pharr40 In all cases, the contact depth estimated from AFM images was consistent with the experimentally determined (Oliver-Pharr) h c, indicating that h other (summation of the deflections other than probe penetration into the fiber surface) is negligible. Additionally, if the other displacements were convoluted with the surface sink-in term (PC t), then for elastically similar materials (e.g., fused silica and E-glass, which are part of the general family of amorphous SiO2-based glasses for which elastic modulus values typically fall within a limited range between 65 and 75 GPa over wide ranges of glass compositions), the h c values measured for flat, fused silica should be greater than that of the curved E-glass fiber. In Fig. 9(d), h c values measured from AFM images on fused silica and the two E-glass fibers are plotted as a function of indentation displacement. In all cases, the data for fused silica and for the fibers are essentially the same within experimental error, and in fact h c values tend to be greater for the fibers than for fused silica at a given indent depth, opposite of that expected if other fiber displacements were involved. This result also indicates that displacements other than indenter penetration of the fiber surface are negligible. Errors can arise in the calculation of h c using the Oliver-Pharr approach (Eq. 5) when a significant C s is not accounted for. Such additional compliance leads to a larger h and an increase in C t, where the resulting effects partially offset one another in the calculation of h c using Eq. 5. The results in the above section not only indicate that h other is negligible, but also indicate that the appropriate h c values are being used. However, pile-up about the residual indentation impression in Fig. 9(c) is observed, which could lead to an artificial increase in the measured contact radius, and subsequently the calculated h c using AFM measurements. These potential errors could alter the trends observed in Fig. 9. It is important to note that should errors associated with the measurement of contact radius or determination of h c (due to deviations from the Oliver-Pharr contact conditions) be significant to our conclusions above, the ultimate measurement of C s would capture the associated compliances as long as they are independent of load (i.e., the Jakes et al. SYS plot remains linear). One source of deflection, which could lead to load-dependence of the structural compliance, is Hertzian contactReference Hertz41 between the fiber and the substrate. By partially embedding the fiber in polystyrene during sample preparation, the PS layer provides lateral support to the fiber and helps to limit undesirable displacement due to fiber-substrate contact from dominating the structural compliance. The linearity of the fiber SYS plots given in Fig. 4 and in Appendix B confirm that nonlinear compliances do not significantly contribute to the overall C s for fiber indentation.
(a) 23-μm fiber and (b) 10-μm fiber comparison of the experimentally determined h c (using the Oliver-Pharr method) and the h c calculated using AFM measurements of the contact radius along the fiber axis, illustrated in (c), and the probe area function. (d) shows the AFM measured h c versus h for each sample. In each case, the range bars corresponding to one standard deviation were contained within the symbols, and therefore excluded. The solid black line corresponds to a linear least squares regression fit of the fused silica data.

Additional compliance due to a material phase change and/or change in the contact mechanics has been observed under localized indentation stresses and is usually accompanied by dramatic slope changes in the load versus displacement curves,Reference Juliano, Gogotsi and Domnich42, Reference Juliano, Domnich, Buchheit, Gogotsi, Ovid’ko, Pande, Krishnamoorti, Lavernia and Skandan43 which would alter any material property measurements. Indentation with a spheroconical probe on a flat substrate, such as the fused silica, is initially governed by an elastic, spherical contact defined by P = αh 3/2.Reference Sneddon16 As indentation depth is increased, most materials will display a transition from fully elastic response to elastic-plastic response under spherical contact conditions and/or after transition to contact dominated by the conical tip geometry. Eventually plastic deformation by the conical region of the indenter will dominate the response such that P = αh 2 for a sharp, axisymmetric contact.
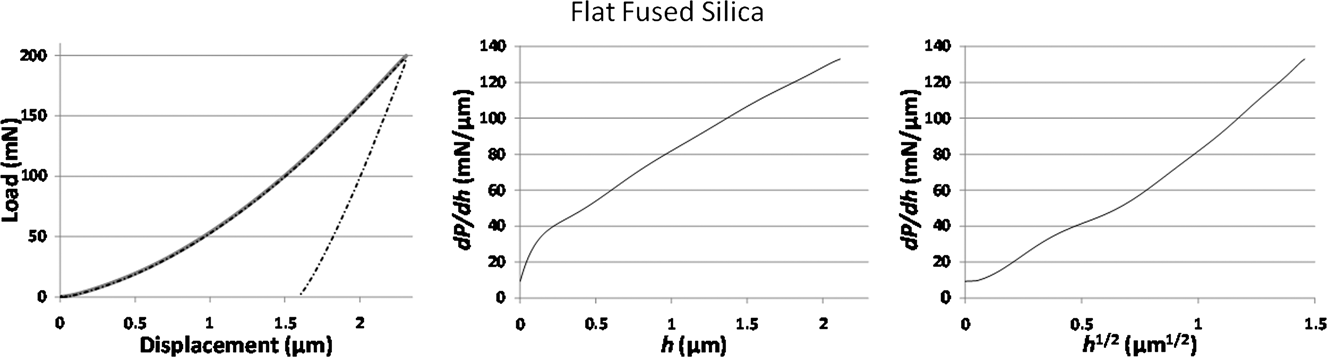
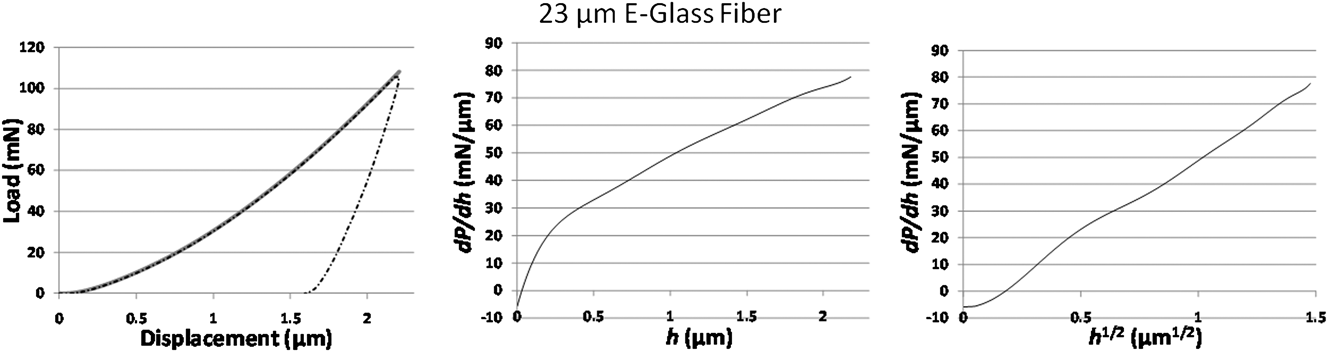
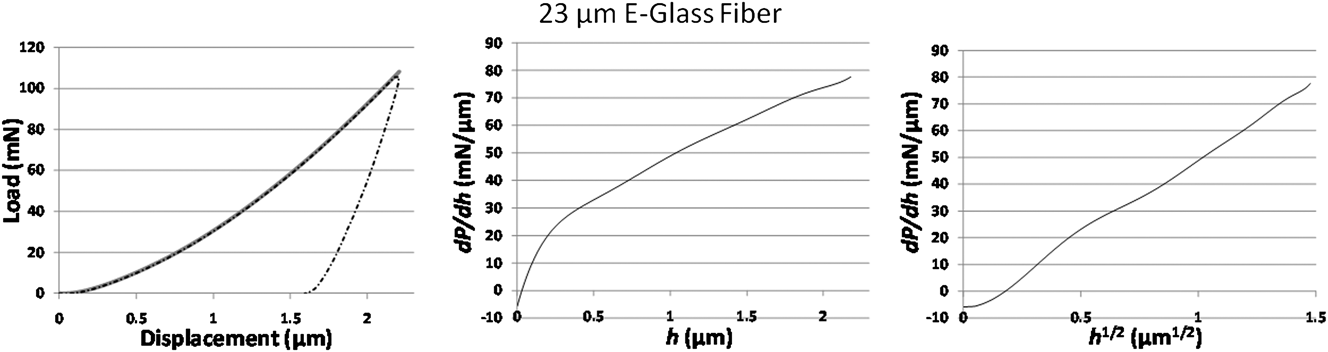
Any phase transitions or changes in mechanisms occurring during indentation will be most apparent when plotting the differential, dP/dh, as a function of displacement (or displacement to an appropriate power). To achieve meaningful differential plots, 9-parameter polynomial fits of the experimental P versus h data were employed to remove signal noise and accurately capture the indentation behavior above the 60 nm surface roughness indentation depth threshold. For elastic behavior under spherical contact conditions for which P = αh 3/2, a plot of dP/dh versus h 1/2 should be linear with a slope of  . The onset of plasticity will then cause a change in slope, and as the behavior becomes plastically dominated under conical contact conditions,
 versus h 1/2 will become parabolic and dP/dh versus h will become linear with a slope of 2α.
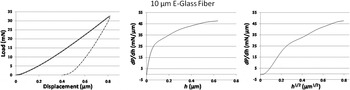
Representative P-h curves with corresponding dP/dh curves are shown for flat fused silica, the 23-μm E-glass fiber, and the 10-μm E-glass fiber in Figs. 10, 11, and 12, respectively, where the dP/dh plots are for the loading curves only. The initial loading portions of these curves will be affected by the surface roughness, and therefore data below h = 60 nm (or h 1/2 < 7.5 nm1/2) can be attributed to asperity interaction with the advancing probe and not indicative of the actual bulk material response. The  versus h 1/2 plots, beyond the roughness effect, appear to be linear up to an indentation depth of ∼150 nm for the flat fused silica and 23-μm fiber, and up to ∼80 nm for the 10-μm fiber. This indicates that the curvature of the larger fiber does not have much effect in the lowest depths where elastic loading dominates, while the curvature of the smaller fiber may have affected the elastic response. For the smaller fiber, locating the indentations precisely in the center of the fiber was more difficult, such that loading in slightly offset positions might also have played a role. Beyond the linear portion, the samples show a gradual transition to roughly parabolic behavior, i.e., to upwards concavity, indicating the onset of plasticity.
Plot of P-h (black-dashed) and the overlaid 9-parameter fit (gray) used to produce the dP/dh relationships (black-solid) for the flat, fused silica standard.
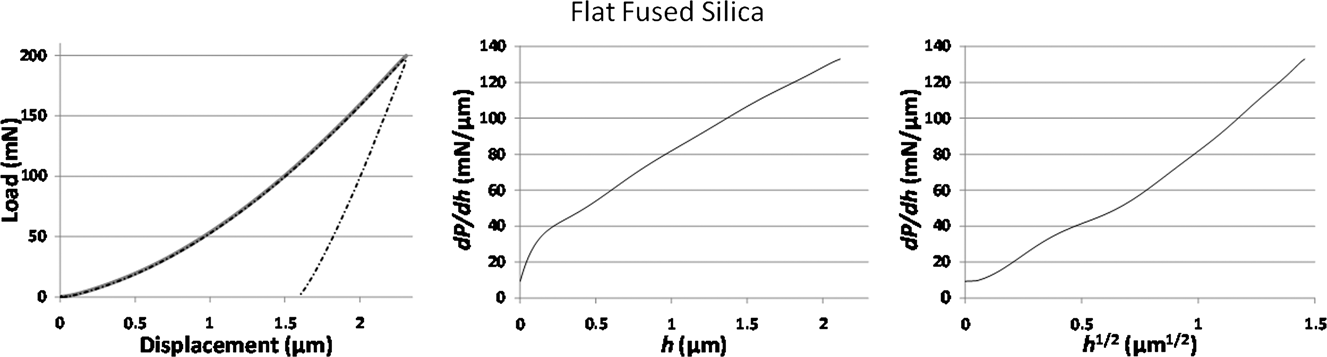
Plot of P-h (black-dashed) and the overlaid 9-parameter fit (gray) used to produce the dP/dh relationships (black-solid) for the 23 μm E-glass fiber.
Plot of P-h (black-dashed) and the overlaid 9-parameter fit (gray) used to produce the dP/dh relationships (black-solid) for the 10 μm E-glass fiber.

The  versus h plots appear to be concave down in the early stages of loading (spherical, elastic contact) and gradually transition to a linear relationship beyond a depth of 1000 nm that is indicative of a plastically dominated conical indentation response. As with the elastic response, variations seen with the 10-μm fiber might be caused by offset loading positions and/or the increased curvature. No other slope changes were observed in any of the dP/dh curves that might indicate a phase change or other change in deformation mechanism (e.g., fracture). In general, the behavior of the E-glass fibers was very similar to that of the fused silica, justifying the use of the fused silica as an appropriate “standard” for our purposes and verifying that the experimental procedures associated with the fiber samples did not cause any material phase changes or significantly alter the contact mechanics that would lead to additional contact compliance.
B. Measuring single filament indentation properties
Given the similarities in the indentation response of the E-glass fibers to fused silica, the deviations in modulus and hardness shown in Fig. 2 for the fibers relative to the flat fused silica sample appear not to be due to any experimental artifacts but rather to the inherently different contact mechanics associated with indenting a curved surface relative to indenting a flat surface. As mentioned previously, a trend of decreasing values of material properties (E and H) with indentation depth has been observed in prior studies involving indentation of fibers and nanowires.Reference Li, Gao, Murphy and Caswell24, Reference Chang, Lin, Chen and Chang26 In these studies, direct measurements of area using AFM and finite element analysis, respectively, were used to compensate for contact on a curved surface with limited effects. In the case where elastic Hertzian contact is maintained, an area correction term can be utilized within the Hertzian framework to produce a solution,Reference Lonnroth, Muhlstein, Pantano and Yue20 albeit a solution that involves elliptical integrals and, of course, which is limited to linear elastic contact conditions.
For nonlinear indentation, an area correction would need to be used within the Oliver-Pharr analysis framework for contact on a cylinder. In the following equations, the contact height corrections in the transverse plane of the fiber are given for two ideal indentation shapes, a cone [Eq. (6)] and a sphere [Eq. (7)] and combined to form the correction for the spheroconical probe [Eq. (8)]:
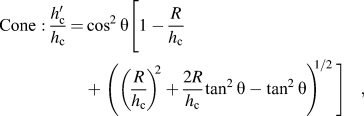

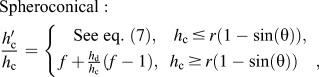
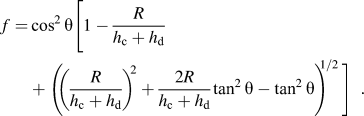
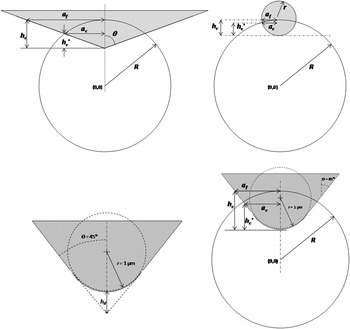
In Eqs. (6)–(9),  is the contact height in the transverse plane for contact depth h c in a flat plane. In Fig. 13, the various contact geometries are shown and associated variables are defined. A full derivation of Eqs. (6)–(10) is available in Appendix A.
Geometric schematic of projected area corrections.

The area resulting from any of these contact conditions on a fiber is elliptical in shape with the contact radii governed by the calibrated tip area function and found at hc (major axis) and h′c (minor axis):

Corroborating the previous fiber and nanowire indentation studies, the area correction proposed results in only about 5% correction to the indentation modulus and hardness data at the maximum indentation depths used in this study. Therefore, the additional compliance observed in Fig. 2 must be the structural compliance, C s, associated with loss of constraint due to the filament curvature.
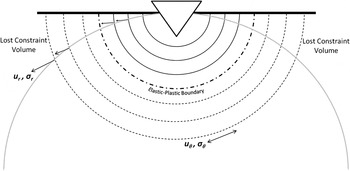
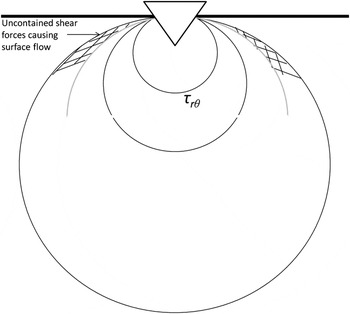
Johnson’sReference Johnson35, Reference Johnson36 expanding cavity model for indentation has been widely accepted as an accurate model of the stress, strain, and displacement distributions and vectors for indentation into a flat, semi infinite half-space. Johnson established that principal stress and deformation vectors existed along hemispherical stress contours, concentric about the indent point (Fig. 14). The principal stress and displacement radial components (σr, u r) project radially outward perpendicular to the contours, and the theta direction components (σθ, u θ) along the contours. Furthermore, the contours for the principal von Mises shear stress, τrθ, were also developedReference Johnson35 and shown to be contained beneath the flat substrate surface (Fig. 15).
Schematic of expanding cavity model principal stress contours (black) super-imposed on a fiber transverse cross-section (gray).

Schematic of expanding cavity model von Mises shear stress contours (black) super-imposed on a fiber transverse cross-section (gray).

The presence of the fiber curvature introduces a finiteness that significantly decreases the constraining volume and containment of the radially deforming material. With increasing indentation depth, the local curvature relative to the stress contours becomes more significant, resulting in decreasing resistance with depth and/or fiber radius. Additionally, von Mises shear stresses will likely no longer be contained beneath the indented surface (see Figs. 14 and 15).
The presence of the fiber curvature pinches the surface boundaries, such that the indentation stress contours will likely not maintain the ideal shapes indicated in Figs. 14 and 15, but more likely take on modified distributions to remain within the sample. This modified distribution will involve elongation of the stress contours into the fiber bulk,Reference Samuels and Mulhearn17 increased shear stresses at the surface of the fiber, and ultimately less resistance to elastic and plastic deformations.
These added surface von Mises shear stresses and the radial displacement vectors, which are no longer contained within a semi infinite media, create additional plastic flow to the sides of the indenter in the form of material pile-up. Fused silica has been chosen as a nanoindentation standard, in part, because material does not pile up adjacent to the indentation, as is clearly portrayed in Fig. 16 (left image). Also shown in Fig. 16 is the introduction of pile-up in the circumferential plane where less material resistance exists for the 23-μm fiber (middle image) and the 10-μm fiber (right image).
AFM scans of indents (indentation depth = 8% of diameter for the fibers) for the flat substrate, the 23-μm fiber, and the 10-μm fiber, respectively.

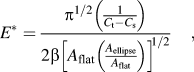
The additional compliance associated with the loss of resistance to long-range elastic stresses and displacements due to the fiber free edge can be accounted for using a SYS plot to measure the “structural compliance.” Representative SYS plots and measurements of C s and J o for the 23- and 10-μm fibers are given in Appendix B. Note that, as shown in Fig. A4 of Appendix B, the SYS plots do become linear at loads corresponding to a fully developed stress field (i.e., the indentation load results in an h c that is greater than the depth corresponding to the sphere-to-cone transition, also, the indent strain is constant, which occurs at approximately 290 nmReference VanLandingham, Juliano and Hagon33). These results validate the assumptions that the fiber is homogeneous and isotropic, and enable the use of the Jakes et al. compliance method to measure C s and J o of the fibers. The sequential combination of C s to the measured total compliance and the proposed area correction for a spheroconical probe provides a method in which the traditional indentation technique and data reduction scheme can be utilized to accurately measure the material properties of single fibers. Ultimately, the fiber elastic modulus and hardness can be found from Eqs. (11) and (12):

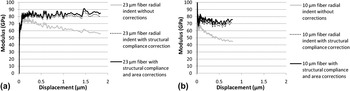
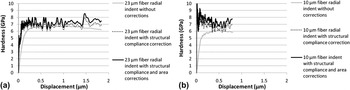
In Figs. 17 and 18, the CSM indentation modulus and hardness, respectively, are shown, calculated using traditional techniques, the SYS plot compliance correction alone, and the combination of consecutively applying the compliance correction and the area correction. These results show that with the appropriate corrections, the fiber material properties can be extracted and are independent of indentation depth. The measured fiber moduli are consistent with what has been reported for E-glass. Some modulus measurements for the 10-μm fiber were significantly lower, falling in the 60–70 GPa range. However, such results might be an artifact of the load being offset from the center (top) of the fiber. The filament hardness, a measure of resistance to plastic deformation, is considerably lower than that of fused silica and in the range of 6–8 GPa. This result can be attributed to the generally lower hardness of E-glass as compared with fused silica, largely arising from lower silica content and higher levels of chemical substituents in E-glass relative to fused silica.Reference Longobardo32 Thus, the effectiveness of the structural compliance method reported by Jakes et al.Reference Jakes, Frihart, Beecher, Moon and Stone27 appears to be only minimally affected by the overlap of the plastic zone with the fiber-free surface, as the process results in reasonable measurements of the fibers' properties.
CSM indentation modulus comparing the (a) 23-μm and (b) 10-μm E-glass filaments with and without the compliance and area corrections.

CSM indentation hardness comparing the (a) 23-μm and (b) 10-μm E-glass filaments with and without the compliance and area corrections.

IV. CONCLUSIONS
In this study, modifications to the existing Oliver-Pharr instrumented indentation technique to account for additional compliance were proposed and validated to accurately measure local E-glass filament properties. Accurate measurement of the local properties of single filaments has previously eluded researchers due to the sources of added compliance associated with fiber indentation. The compliances associated with the displacements in addition to indenter penetration of the fiber surface are shown to be negligible, which leaves two primary sources of error: a) projected area and b) reduced containment due to fiber finiteness. Herein, a geometric projected area correction is formulated and shown to compensate for only a fraction of the error associated with the added compliance. Utilizing a previously derived method to extract “structural compliance” from an indentation study, the general lack of constraint compliance is accounted for by one term, C s, which is subtracted from the overall measured compliance to give an accurate measurement of the local material stiffness.
Combining these two corrections (area and structural compliance) gives a reasonable calculation of the fiber properties at depths of indentation producing nonlinear deformations. Ultimately, this approach allows for the calculation of local material properties on curved surfaces utilizing previously established standard indentation techniques and data reduction methods without the need for complex numerical simulations or post indentation imaging steps.
The structural compliance measured for fiber indentation is due to the lack of constraint associated with the fiber surface boundaries, which modifies the stress distributions established for the indentation cavity model. Determining the dependence of these modified stress distributions on curvature and material properties will require a more detailed and rigorous theoretical calculation that may or may not be directly applicable to the simplified experimental approach shown to work above.
ACKNOWLEDGMENTS
QM and JWG gratefully acknowledge sponsorship by the Army Research Laboratory under cooperative agreement W911NF-06-2-0011. The views and conclusions contained in this paper should not be interpreted as representing the official policies, either expressed or implied, of the Army Research Laboratory or the U.S. Government. The U.S. Government is authorized to reproduce and distribute reprints for Government purposes not withstanding any copyright notation hereon. The authors would also like to thank Dr. Kenneth Strawhecker for useful discussions in data interpretation, Dr. Joseph Deitzel for help in formulating a proper mounting system, and Dr. Anthony V. Longobardo for supplying the 10-μm E-glass samples and useful E-glass discussions.
APPENDIX A—PROJECTED AREA CORRECTIONS FOR RADIAL INDENTATION OF A FILAMENT BY VARIOUS PROBES
A. Conical indentation probe
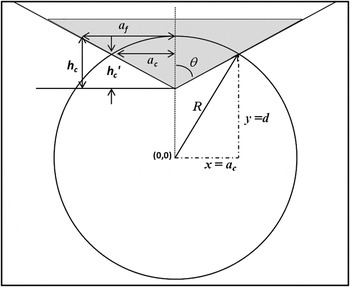
Define the fiber cross-section in Fig. A1 by a circle of radius R centered at (0,0):


Conical probe geometric projected area correction schematic.

Both a c and d can be defined in terms of the indent depth and indenter and fiber geometry:


Substituting (A3) and (A4) back into (A2), expanding, and combining like terms gives h′c in quadratic form:

Using the quadratic formula, a solution for  is found:

Recognizing (tan2θ + 1) = sec2θ = 1/cos2θ, and dividing through by h c gives the  solution for a cone:

The elliptical area correction can be found in two manners: 1) considering an ideally shaped probe, and 2) staying consistent with the experiment, and using the calibrated probe area function. The first method depends heavily on the general probe shape used. For a cone, consider the area of an ellipse to be A ellipse = πab. The major elliptical radius, a, is along the fiber axial direction and is given by, a f; and the minor elliptical radius, b, falls along the curved transverse profile and given by a c. Therefore:




Comparing this to the area function for a circular projection on a flat surface,  gives:
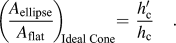
The second method gives a solution that is interchangeable for all probe shapes as long as the probe area function, A, is known. This is the method used herein:


From these relationships it follows that:
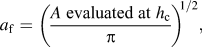
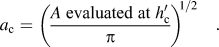
Now using (A8) for A ellipse, the general area correction ratio is:

B. Spherical indentation probe
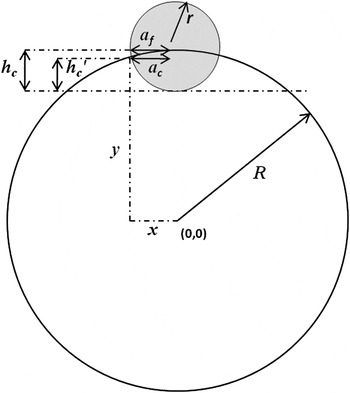
Define the fiber cross section in Fig. A2 as a circle of radius R centered at (0, 0) and the probe as a circle of radius r centered at (0, R + r – h c):


Spherical probe geometric projected area correction schematic.

The y of interest is that where the fiber and the probe share the same x, or x2:

Expanding, simplifying, and solving for y gives:

Using the relationship,  gives
 and dividing through by h c gives:

The area correction for a spherical probe can be done using either the general Eq. (A17) or assuming an ideal spherical probe. For an ideal spherical probe, a f and a c are:


Then the area correction ratio is given as:

C. Spheroconical indentation probe
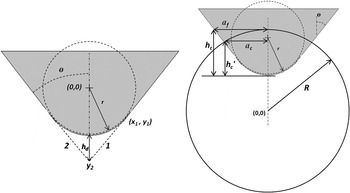
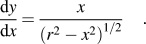
The spheroconical probe contact correction can be best described by a piecewise function separated at the transition point between spherical and conical probe shape. This transition point is at the tangent point between line 1 defined by the conical region of the probe and the spherical end of the probe defined by radius r (Fig. A3). The tangent point, (x 1, y 1) will be where the slopes are equal. The slope of line 1 is given by cot(θ), and the spherical portion of the probe can be defined as x2 + y2 = r2 which gives a slope, dy/dx:
Spheroconical probe geometric projected area correction schematic.

SYS plots used to measure the structural compliance, C s, and Joslin–Oliver parameter, J o, of the 23-μm (left) and 10-μm (right) E-glass fibers.

The slopes are found to be equal when x 1 = rcosθ and y 1 = rsinθ. This point can be used to find the intersection of lines 1 and 2, which gives y 2. The lines are defined as:


From the schematic, y1 = y2 = y 2 when x = 0. Therefore,

The distance h d is the indent depth lost due to the rounding of a conical tip, and is given by:

The relationship between  and h c for a spheroconical tip is then given by the spherical relationship (A22) at depths below the sphere-cone transition depth of
 , or h c < r(1 − sinθ). At depths greater than r(1 − sinθ), the conical relationship (A7) can be used by substituting
 for
 and h c+ h d for h c, giving:
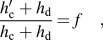
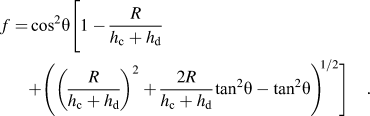
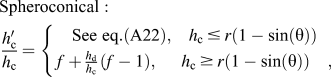
With simplification, this ultimately gives the piecewise function for  of a spheroconical probe governed by the sphere at low depths and a cone at greater depths:
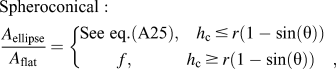
Similarly, the corrected area can be found using Eq. (A17) using the calibrated probe area function; or for an ideal spheroconical probe the area is given by that of a sphere at indent contact depth h c at low depths and by a cone at an indent contact depth h c + h d at greater depths:
APPENDIX B—SYS PLOTS OF THE E-GLASS FIBERS
The correction for structural compliance used when measuring the material properties of the glass fibers is extracted from the SYS plots for the 10- and 23-μm fibers portrayed below. The plots show one representative SYS curve for each indentation depth on each fiber.
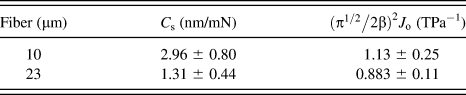
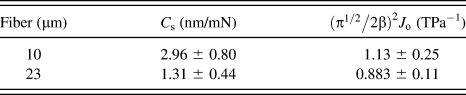
The correlation depth indicated in Fig. A4 corresponds to the probe transition from spherical to conical in shape. This transition limits the linear fit region to contact depths greater than approximately 290 nmReference VanLandingham, Juliano and Hagon33 and restricts the SYS parameter measurements on the 10-μm fiber to only the maximum indent depth of 800 nm. Beyond this depth, the SYS compliance plots are linear, indicating that the sources of compliance associated with fiber indentation are independent of indent load, and validating the use of the Jakes et al. compliance method. The values for C s and J o, in Table I, are averages for all the applicable indents [i.e., five (5) 800 nm indents on the 10-μm fiber and five at each depth totaling twenty (20) on the 23-μm fiber]. The ranges given in Table I are representative of one standard deviation of the applicable measurements.
Fiber indentation structural compliance, C s, and Joslin–Oliver parameter, J o, for the 10- and 23-μm E-glass fibers.
Based solely on the geometry of the probe-fiber contact, the relative constraining volume decreases with indent depth, which would cause an increase in the structural compliance with indent depth. Conversely, in Fig. A4, the structural compliance (slope of the SYS plot) decreases until it reaches an approximately constant value at greater indent depths (loads). Our preliminary understanding is that stress contour modifications and the material pile-up around the indenter appear to mitigate the curvature such that the structural compliance reaches a plateau value.