Simon Kuznets' seminal article in 1955 argued that inequality would follow an inverted-U path through the industrialization process (the so-called “Kuznets curve”). Subsequent research has made more clear the path of inequality for Britain, France, Italy, Spain, and the United States over the last two centuries (Williamson Reference Williamson1985; Piketty, Postel-Vinay, and Rosenthal Reference Piketty, Gilles and Rosenthal2006; Piketty Reference Piketty2014; Rossi, Toniolo, and Vecchi Reference Rossi and Toniolo2001; Prados de la Escosura Reference Prados de la Escosura2008; Lindert and Williamson Reference Lindert and Williamson1980). We know much less, however, about the path of inequality during pre-industrial times.
For the medieval and early modern period, the most celebrated example is David Herlihy's impressive study of the Florentine catasto of 1427 (Herlihy Reference Herlihy, A, Miskimin and Udovitch1977; Herlihy and Klapisch-Zuber Reference Herlihy and Christiane1985). There are a growing number of case studies of single cities or small areas, such as Ivrea and the Canavese in northern Italy (Alfani Reference Alfani2009, Reference Alfani2010a, Reference Alfani2010b); Nivelles, Aalst, and Hertogenbosch in the Low Countries (Ryckbosch Reference Ryckbosch2010, Reference Ryckbosch2012; Hanus Reference Hanus2013); some rural areas around Madrid in Spain (Santiago-Caballero Reference Santiago-Caballero2011; Santiago-Caballero and Fernández Reference Santiago-Caballero and Fernández2013); and Bursa in Anatolia (Canbakal Reference Canbakal2013) based on new archival data.Footnote 1 The only work covering a large area over a long period is Jan Luiten Van Zanden's study of the provinces of Holland and Overijssel in the Low Countries (Van Zanden Reference Van Zanden1995; Soltow and Van Zanden Reference Soltow and Van Zanden1998).
Using previously unexploited archival data I examine the time path of inequality from 1300 to 1800 in northwestern Italy, in particular the domains of the House of Savoy, which today broadly correspond to the Piedmont region. This is an important region of Italy as, starting from their Piedmontese domains, the Savoys played a fundamental role in the process of unification of the country (completed in 1861). The time series of inequality measures presented here span five centuries and provide new insights into economic development in this pivotal region.
The data support three major findings. First, from the late Middle Ages and throughout the early modern period, inequality in northwestern Italy grew almost continuously, both in cities and in rural areas; the only exception being the period immediately following the Black Death. Second, in examining the consequences of the Black Death, I find that its effects differ from subsequent mortality crises of comparable scale (in particular, the 1630 plague), probably due to institutional change. Third, inequality increased both in periods of economic growth and of economic decline or stagnation.
The article is organized as follows. The first section presents a general overview of Piedmont and the Savoy domains during the late medieval and early modern period. The second section details the new archival sources, the estimi (property tax registers), which provide information on household wealth. The third section describes and analyzes inequality changes using community-level data from 1300 to 1800. The fourth section analyzes the impact on inequality levels of severe mortality crises, particularly due to the plague, from the Black Death up to the last plagues in the seventeenth century. The fifth and sixth sections reconstruct trends in inequality for the Piedmont region and then compare inequality trends in northwestern Italy and Holland.
PIEDMONT UNDER THE HOUSE OF SAVOY: AN OVERVIEW
Although not one of the main economic and cultural centers of Italy during the Renaissance, from the fourteenth century the Piedmont witnessed the development of what, by the eighteenth century, was the most advanced and powerful regional state in Italy culminating with the establishment of the Kingdom of Italy in 1861. From the late Middle Ages and through the early modern period, the history of Piedmont is very much the history of the expansion of the Italian domains of the House of Savoy, which at that time also ruled over parts of present-day France and Switzerland and controlled many key transalpine transit routes.Footnote 2 The Savoys acquired Moncalieri and Turin in the thirteenth century and intensified their expansion in Piedmont in the fourteenth century and after, incorporating cities like Ivrea in 1313, Chieri in 1347, and Cherasco in 1529 (Barbero Reference Barbero and Comba1997, p. 379). In 1563, the increasingly Italy-orientated politics of the Savoys led them to move their capital from Chambéry to Turin, which had been the de facto administrative center of the state since 1518 (Barbero Reference Barbero and Comba1997, p. 414). In 1588, the Sabaudian State incorporated the Marquisate of Saluzzo gaining control over rural and urban areas including the cities of Saluzzo (the marquisate's capital) and Carmagnola. The Savoys' power continued to increase and, in 1713, they became kings, accomplishing a long-term objective of the dynasty.Footnote 3
Given its history of territorial acquisitions, the House of Savoy governed a complex territory. Here I focus briefly on the development of the Sabaudian fiscal system, which many historians consider one of the most advanced in early modern Italy, and which enabled the Savoys to build their considerable military power (Stumpo Reference Stumpo1979; Pezzolo and Stumpo Reference Pezzolo, Stumpo and Cavaciocchi2008; Pezzolo Reference Pezzolo, Bartolomé and O'Brien2012). This fiscal system is also crucial to understanding the nature of the archival sources described below. Indeed, fiscal “systems” would be a more accurate description, because well into the eighteenth century local rules defined the distribution of the tax burden among taxpayers. When cities and towns accepted the rule of the House of Savoy, the Sabaudian rulers usually allowed these communities to distribute tributes due to the central authority according to local statutes. Particularly relevant for this article, is the fact that, among other things, these statutes described with great accuracy the rules for compiling the estimo or property tax record and specified the type of property used when calculating the share of local and supra-local taxes levied on each household.
During his reign, Duke Emanuele Filiberto (1553–1580) enacted a fiscal reform centered on a new tribute, called the tasso, imposed for the first time in 1562.Footnote 4 This was a direct tax, levied on each community, which the Duke originally presented as an extraordinary tribute but which over time became, de facto, an ordinary tribute (Vester Reference Vester2001; Alfani 2Reference Alfani and Vester013c). Each community decided how to pay the tasso, and most distributed the burden proportionally to each household's share of the local estimo, that is, proportionally to the value of the household's taxable possessions. The estimi provide the algorithm that transferred a community tax to single households. Consequently, the Piedmontese communities had to maintain up-to-date property tax records in order to distribute the burden fairly among taxpayers—with the unintended consequence of generating an exceptional wealth of estimi available for this area during the early modern period (Alfani Reference Alfani2010a, pp. 519–20). For this study, estimi can be used to shed new light on inequality in the long run.
THE SOURCES AND THE DATABASE
Communities in Piedmont, as was common in Italy, compiled detailed books (the estimi or catasti) recording taxable property present in their territory in order to allocate the fiscal burden among households. While renewed entirely every few decades, updates were usually made directly on the original. Despite some limitations discussed later, the estimi are an excellent source for understanding inequality over a long period of time, especially because they display stability through space and time. Not only are the estimi homogeneous sources across Italy, but they exist also for southern France, northern and eastern Spain, and much of Germany. Through time, they have tended to preserve the original characteristics conferred by the medieval city statutes up to the introduction of the modern “cadastre” system first introduced by the Sabaudian State in 1731 (Symcox Reference Symcox, Merlin, Rosso, Symcox and Ricuperati1994, pp. 406–8). Even so, many communities continued to update their estimi, sometimes up to the early nineteenth century.Footnote 5
There are two types of Italian estimi: estimi “per property” (per capitale) and estimi “per yield” (per reddito) (Pini Reference Pini, Capitani, Manselli, Cherubini, Pini and Chittolini1981; Alfani and Caracausi Reference Alfani2009). The former registers, which are by far the most common, record only real estate (lands and buildings), whereas the latter—of which the famous Florentine catasto of 1427 is the best-known example—also include livestock, working capital, credits, and other movables. Here I rely on estimi per property.Footnote 6 Which may raise concerns. The first and most serious issue is that the use of the estimi per property limits the analysis to only one of the many components of wealth, real estate. However, the estimi per property still offer valuable information on household wealth and income. During medieval and early modern times, real estate was the most significant component of total wealth, and, hence, of total income. In 1427 Tuscany, for example, if the capital city of Florence is excluded, real estate accounted for 66 and 91 percent of the overall wealth of urban and rural dwellers, respectively (Herlihy and Klapisch-Zuber 1985).Footnote 7 Indeed, owning property in a city and consequently being listed in its estimo was usually one requirement to obtain full citizenship rights there.Footnote 8 Moreover for pre-industrial societies in which most households earned their living from agriculture, wealth inequality is a good proxy of income inequality. The property of land was of great importance in defining how the total product was distributed and overall, it is very unlikely that, in agrarian pre-industrial societies, income and wealth inequality could move in different directions. Peter Lindert (Reference Lindert, Brenner, Kaelble and Thomas1991, p. 215) has argued that, even during the Industrial Revolution, wealth concentration and income concentration followed the same path, recently noting that “data on households' wealth inequality are particularly helpful as clues about income inequality before the twentieth century, when direct income measures were sparse” (Lindert 2014, p. 8). In fact, in most circumstances wealth inequality is the only possible proxy for pre-industrial income inequality, and overall it does not seem to be a poorer indicator than others used to study income distribution, for example the rental value of houses for the Low Countries (Van Zanden Reference Van Zanden1995).
A second concern when using estimi is that as a rule, they include only taxable property. Consequently, these sources omit (1) feudal property and (2) property owned by religious institutions such as abbeys, monasteries, and churches. As feudal property was not very widespread in Piedmont, for example, in Ivrea in 1665 it was just 2.5 percent of the total (Alfani Reference Alfani2010a, p. 521), the main issue was exempt Church property. While it is true that estimi omit property owned by religious institutions ab antiquo (“since ancient times”), they do include the property acquired by these institutions after the introduction of the estimi. This latter type of property was at most only partially exempt.Footnote 9 In addition, registers sometimes record exempt property although they do not take it into account when calculating the tax distribution. For example, in 1577, 1729, and 1739 the registers of the city of Saluzzo include only taxable property.Footnote 10 In 1685, the registers list exempt Church property providing the description of such property but not its value. In 1772, the registers include both exempt feudal and Church property and also evaluate it. Consequently, I could compute that 89.3 percent of all property was taxable, 9.5 percent was exempt Church property, and just 1.2 percent was feudal. Unfortunately such calculations can be provided only for the city of Saluzzo in 1772. Consequently, in order to build a series of inequality measurements as homogeneous as possible, exempt property was excluded from the analyses.
A third shortcoming of the estimi is that they do not list households who did not have any real estate to declare. Thus many of the poor are absent from these records. The problem is less severe than it might appear because the registers do record poor households owning even the tiniest property like a shack or a small orchard. Thanks to a rare census dated 1613, we know that for Ivrea, out of 101 households (10.8 percent of the total) listed as nullatenenti (poor) or even miserabili (miserables), 15 owned some property. Consequently it can be estimated that the share of households missing from the estimo is lower (just 9.2 percent of the total) (Alfani Reference Alfani2010a, pp. 521–22). For Moncalieri in 1613, of the 1,443 households recorded, only 123 (8.5 percent) did not own any property and would not appear in an estimo. Data from other exceptional sources show that, in 1393, households without any estimo goods were 9.2 percent of the total in Turin and about the same in Coni (Comba Reference Comba1982, pp. 28, 30). Interestingly, these figures for the communities in Piedmont at different times present a remarkable similarity with the percentage (14 percent) of the poor (= households with no property at all) estimated for the city of Florence in 1427 (Herlihy and Klapisch-Zuber Reference Herlihy and Christiane1985, p. 100). Although absence of these poor households biases my inequality measures towards equality, the estimates are a lower bound on inequality.
Before describing the exact sample, it is important to understand what exactly an estimo value was. The value given to taxable property was not a market value but rather a measure of the fiscal capacity generated by each piece of property.Footnote 11 There are good reasons to believe that the estimo values were proportional to the market values, or at least to the values prevailing in the market at the time when the communities compiled the estimi. Each new estimo resulted from a complex process including a refined system of cross-checks, as detailed below. The regulations and criteria governing the imposition or renewal of an estimo constituted a fundamental part of each city's statutes. Throughout Piedmont, until the introduction of the modern cadastre in the eighteenth century, the local communities continued to manage the whole process, so that all those involved responded directly to the local community and not to any external authority (thus ensuring a high level of collective social control over the fairness of the process). Creation of a new estimo began with the election of officials charged with organizing the process. Although the measures and values from earlier estimi also provided benchmarks, all property owners submitted declarations about the characteristics, values, and rents of their properties. Ad hoc committees checked the accuracy of such declarations and surveyed properties.Footnote 12 Finally, notaries recorded the information collected in the new estimo books, which became public information. Should the evaluations prove discordant with market values, widespread protest against unjust taxation could happen, as in 1579 Chieri (Rotelli Reference Rotelli1967, p. 13), leading to a revision of the estimates. Local communities also punished misbehavior by any of the parties involved with severe sanctions.
Values recorded in the estimi are not readily convertable into approximate market values expressed in a common currency, because the values were expressed in the local lire, or in one of the other lire used in the area (the 1311 estimo of Chieri records evaluations expressed in the lira of the city of Asti), or in a unit of measurement that we cannot readily identify, or in a unit of measurement used solely for the local estimo. Because we are comparing Gini measures, which are pure numbers, this variety of local values is not a problem.Footnote 13 I acknowledge that estimi may not perfectly reflect market values or the fiscal capacity generated by property but would argue that estimi values still provide a very good proxy for household wealth, at least in distributional terms.
The estimi available for Piedmont are exceptionally ancient. In fact, only in Tuscany, do we find comparable sources. After a lengthy and thorough study of the Piedmontese archives, the data used here represent the earliest and most complete time series of estimi ever published. These data also cover a broad geographic region spanning alpine areas to the Po plain, and covering both urban and rural communities. While most of the data are new, I include previously collected data for the city of Ivrea and the surrounding rural area (the Canavese) (Alfani Reference Alfani2009, Reference Alfani2010a).
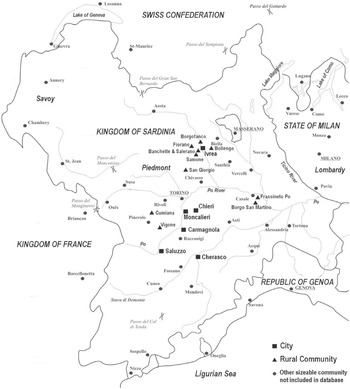
The data used here cover 18 communities in the Sabaudian State as shown in Figure 1. Seven of the rural communities of the Canavese area are grouped by the estimi into three units so that the information from these 18 communities generate 14 time series.
COMMUNITIES IN THE DATABASE (POLITICAL BOUNDARIES OF THE KINGDOM OF SARDINIA / SABAUDIAN STATE, CA. 1750)

Of the 18 communities, six are cities of varying size: Chieri (from 1311), Cherasco (from 1347), Moncalieri (from 1366), Carmagnola (from 1461), Ivrea (from 1466), and Saluzzo (from 1577), which comprise some of the largest cities in Piedmont. Chieri, for example, was the largest city in the fourteenth century, and was surpassed by Turin only from the mid-sixteenth century. The absence of Turin from the sample is a clear limitation, especially as from the sixteenth century it was the largest city and the administrative center of Piedmont. However, when it obtained the status of capital, Turin also gained exemption from many tributes and the medieval estimi were discontinued. So although it would be better to have information on wealth distribution in Turin, that is not possible to achieve.
The time series for the rural communities somewhat begin later than the urban series. They include Vigone (from 1454), Borgo San Martino (from 1485), Cumiana (from 1496), San Giorgio (from 1523), and Frassineto Po (from 1600). The time series for the Canavese villages all start in 1629 and involve three aggregates: Bollengo and Borgofranco; Palazzo and Piverone; and Samone, Salerano, and Banchette. Taken together, the rural communities cover different environments, encompassing the pre-alpine territories of Cumiana, San Giorgio and the Canavese to the west and north, the landlocked plain south of Turin (Vigone), and the open Po plain to the east (Borgo San Martino and Frassineto Po).
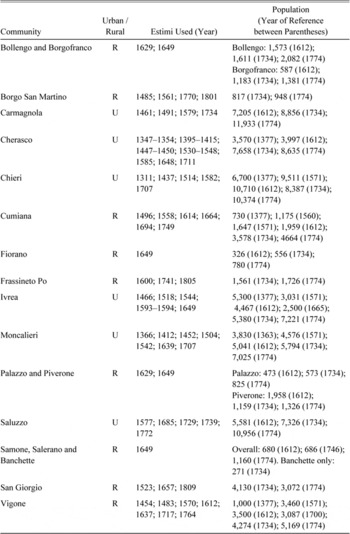
For each community, I accessed all available archival sources. To collect as many consistent and uniform observations as possible, I recorded the available data close to 50-year breakpoints (1300, 1350, 1400, etc.). In some instances, only breakpoints were considered. In other cases, especially for those cities that compiled the estimo on a quarter-per-quarter basis (quarters being the geographical and administrative subunits of a city), I derived a single observation by assembling information from sources having slightly different dates. For example, the observation for Cherasco during 1395–1415 is the outcome of the merger of the four estimi for each of the quarters of St. Iffredo (1395), St. Martino (1395), St. Margherita (1402), and St. Pietro (1415). Table 1 summarizes the observations for each community with their estimated population sizes. The online Appendix presents additional information about the sampling strategy and the representativeness of the sample.Footnote 14
COMPOSITION OF THE DATABASE

Sources:
See online Appendix and Database (http://didattica.unibocconi.eu/Alfani_database).
LONG-TERM TRENDS IN INEQUALITY: AN OVERVIEW
From the information about household wealth collected from property tax records I compute several inequality measures—the Gini index, as well as percentiles.Footnote 15 Taken together, these measures enable an in-depth analysis of long-term trends in inequality and of the changes in the distribution.
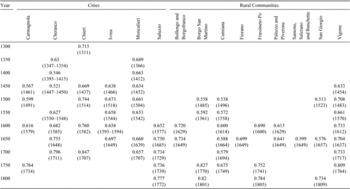
Table 2 presents the Gini indexes for all communities over the whole period. To ease comparisons between communities, I organize measures around reference years (50-year breakpoints from 1300 to 1800). The first and most striking finding is that in each community, both urban and rural, overall inequality tends to grow over time and except for Moncalieri and Borgo San Martino is the largest at the end of the period. For all communities, inequality circa 1700 is higher than in 1600 or 1500, except for the city of Moncalieri where inequality levels are practically the same at 1500 and 1700 and for the village of Cumiana where the measure for 1700 (0.579) is higher than that for 1500 (0.538) but slightly lower than that for 1600 (0.600). However, during the first half of the eighteenth century inequality in Cumiana jumps to its multi-secular maximum (0.675 around 1750); unfortunately we do not have information for that period about Moncalieri.
GINI INDEXES OF WEALTH CONCENTRATION IN NORTHEASTERN ITALY, FOURTEENTH TO EARLY NINETEENTH CENTURY

Note:
Ginis organized around reference years; actual year between parentheses.
Sources:
See online Appendix and Database (http://didattica.unibocconi.eu/Alfani_database).
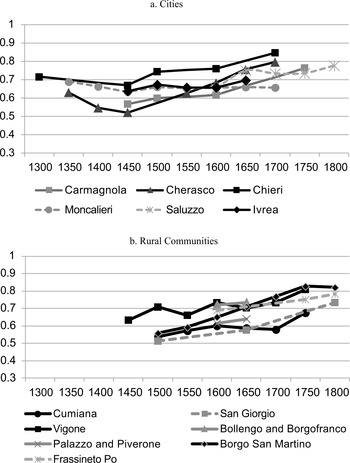
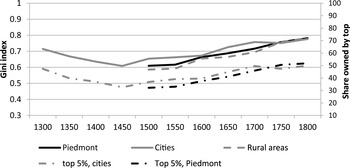
The upward trend in inequality can be seen in Figure 2 and shows that from approximately 1450 across the Piedmont inequality tended to grow; the pace was quicker in the initial phase (1450–1500) and in the final one (from approximately 1600 in cities and possibly with some delay in rural communities). The timing is significant, as 1450 was a turning point for the Italian population, which started to grow quickly after a long phase of decline followed by stagnation triggered by the Black Death in 1348 and reinforced by subsequent plague waves (Pinto Reference Pinto, Del Lorenzo, Bacci, Pinto and Sonnino1996, pp. 60–61; Alfani Reference Alfani2010c, pp. 29–30).
LONG-TERM TRENDS IN ECONOMIC INEQUALITY (GINI INDEXES OF WEALTH CONCENTRATION)

Remarkably, for the three cities of Chieri, Cherasco, and Moncalieri for which pre-1450 information on wealth from the estimi is available, there is a decline in inequality from a high point reached in the early fourteenth century—that is, before the Black Death. These cases are particularly important to assess the impact on inequality of the Black Death and other severe plagues (see the next section). It is also noteworthy that all the communities experienced an increase in inequality during the seventeenth century, when demographic and economic stagnation or decline characterized Piedmont (see discussion below).
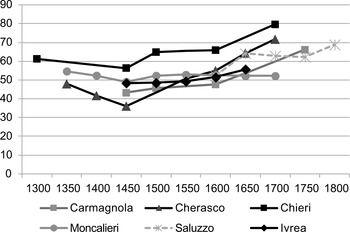
It is well known that the Gini index as a measure of inequality has several shortcomings. The same value of the Gini index can correspond to very different distributions. Also, changes in the Gini index over time can be due to very different phenomena affecting specific parts of the distribution. Finally, an almost unchanging Gini index can hide significant changes to the underlying distribution structure. To address this problem and to gain a better understanding of the long-term inequality dynamics, I have also analyzed deciles. Figure 3 charts the share of wealth for those in the top decile of the distribution.
SHARE OF WEALTH OWNED BY 10 PERCENT TOP RICH

Comparing Figure 3 with Figure 2 we see that the trend in inequality follows very closely the changes in the share of wealth (or income) owned by the richest part of the population. This is not a statistical necessity, but rather an empirical regularity, one even more striking considering that the same phenomenon characterizes contemporary societies, with many studies showing how the changes occurring at the top practically determine what happens to overall inequality (see for example Atkinson, Piketty, and Saez Reference Atkinson, Piketty and Saez2011; Alvaredo et al. Reference Alvaredo, Atkinson, Piketty and Saez2013).
It is also worth underlining the extreme polarization of wealth ownership, with the share of taxable wealth owned by the top 10 percent rich reaching its maximum of 79.65 percent in Chieri in approximately 1700 and overall staying almost invariably above 50 percent from approximately 1600. The ability of the top decile to determine the inequality trend remains true not only in times of rising inequality, but also when it declines—as in Cherasco, where the share of the top rich declines from 48.01 percent at approximately 1350 to the all-time minimum of 36.1 percent about one century later and the Gini index shrinks, in the same period, from 0.63 to 0.521. For all communities, the same conclusions hold considering even more restricted economic élites (top 5 and top 1 percentiles), with urban and rural locations not displaying significant differences.
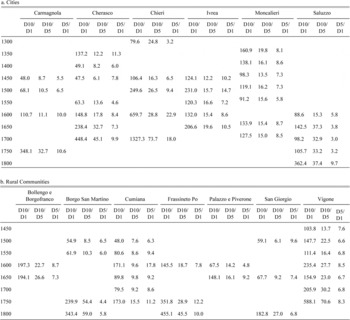
If over time the rich were gaining shares of the total wealth, who was losing? Was the decline spread across all other parts of the distribution? Were the intermediate ranks declining, or were the poorest being left even further behind? To answer these questions, I will recur to inter-decile ratios. The most widely used ratios in the inequality literature are P90/P10, P90/P50, and P50/P10, which compare the wealth (or incomes) of single households at different points in the distribution. P90/P10, for example, is the ratio of the upper bound value of the ninth decile to the upper bound value of the first decile (OECD 2011, pp. 80–81). Here, however, I compare the share of wealth of entire deciles, which is equal to building a ratio between the average household of each decile, that is:

where Dx, Dy are different deciles; HDx, HDy is the share of wealth owned by the average household of each decile; n is the number of households per each decile which is constant through deciles by definition, as each of them includes 10 percent of all households. I then compute the inequality measures D10/D1, D10/D5, and D5/D1 shown in Table 3. These ratios indicate how many times richer the average household of a given decile is in comparison to another, lower decile.
INTER-DECILE RATIOS

Sources:
See online Appendix and Database (http://didattica.unibocconi.eu/Alfani_database).
The analysis of all inter-decile ratios shows that the share of wealth of the top 10 percent rises relative to the share owned by all other groups, including the next-richest (D9 and D8). However, the relative decline is sharper when one considers the lower social-economic strata. For cities, the comparison of the share of wealth owned by the tenth decile to that owned by the fifth (D10/D5) reveals that, while circa 1450 the top 10 percent rich were 6 to 16 times richer than the middle ranks of society, by 1700 or 1750 they were at least 33 times richer—even 74 times richer in Chieri (Moncalieri is the only exception). Increases within this range could seem enormous if not for the fact that they look modest compared to what happens to the D10/D1 ratio during the same period: in cities its range rose from 48–124 to 118–1,327.
The enormous growth in the share of wealth owned by the top 10 percent compared to all other groups is only part of the story. Not only were the top rich leaving all behind, the poorest strata were also distancing themselves from those above, as shown by the D5/D1 ratio. In cities, circa 1450, the middle ranks were 6 to 8 times richer than the poorest strata (10 times in Ivrea); by 1700 or 1750 they were between 9 and 18 times richer (the exception is Saluzzo which, however, fell in line by 1800). These overall changes in the distribution may reflect a continuous increase in the number of poor with little or no property residing in cities whose population was growing. As most of this urban demographic growth was the outcome of steady migration of rural dwellers to the cities, we might think that the process of distancing of the poor from the middle ranks was less acute in rural areas. Indeed, the ratios for the rural locations in Table 3 show the D5/D1 ratio in the eighteenth century is no higher than in the sixteenth or the seventeenth century. However, the ratio of the rural top decile outstripped all other sections of the distribution.
Some caveats and remarks regarding these findings are in order. When considering the top end of the distribution, it might be that the absence of feudal and ecclesiastical property from the sources used (the estimi) excludes some of the richest owners from the wealth distribution leading to a bias in the inequality indexes and ratios. As already discussed in detail, feudal property in the communities in the sample accounted for a very small share of the total. In addition, religious institutions were not necessarily rich. For example, in 1772 Saluzzo, the surviving sources allow me to construct a Gini index including and excluding exempt property. I find basically the same result: 0.777 versus 0.771 with the Gini even declining slightly when the exempt property is included.
A potentially more serious limitation of the analysis lies at the bottom of the distribution, which is truncated. Poor who did not own any property are not recorded in the estimo. They disappear from the wealth distributions. However, since the estimi recorded even tiny properties, it appears that only a relatively small segment of the population is missing. As discussed above, some sources enable us to estimate the proportion of households devoid of estimo property, which falls in the 8.5–9.5 percent range in cities, such as Ivrea and Moncalieri in 1613. In addition, small landownership prevailed in rural western Piedmont, and considering the tendency of the rural poor to migrate to cities, the prevalence of households with no property at all might be expected to be even less in rural communities.
The absence of the propertyless from the distribution only biases the Gini index towards greater equality. For example, in 1613 Ivrea, adding the propertyless to the distribution determines a 13 percent increase in the Gini index (Alfani Reference Alfani2010a, p. 522). However, this point estimate does not tell us much about the change over time of the prevalence of the poor. Unfortunately, I know of no Piedmontese sources that would allow measurement over time. Some information from other parts of northern Italy, in particular, Veneto does exist. In Padua, the propertyless were the 0.8 percent of the overall population in 1575, rising to 1.3 percent by 1637. Adding them to the distribution gives an increase in the Gini index of 0.8 percent and 2.3 percent, respectively (Alfani and Caracausi Reference Alfani2009, p. 203). In Treviso a century earlier, the prevalence of the propertyless seems to have been exceptionally high, ranging between 19 and 29 percent in 1434–1448 (Scherman Reference Scherman, Alfani and Barbot2009, p. 175, Reference Scherman2013, p. 381). These measures for Treviso are not directly comparable due to differences in the sources used.Footnote 16 Although it is difficult to assess how the prevalence of the propertyless changed in any particular region over time given their mobility, the literature suggests that their prevalence declined in the decades following the Black Death and grew during the early modern period (Pullan Reference Pullan1978; Woolf Reference Woolf1988). Consequently, if I could include some estimate of them in the sample, some of my key findings would probably be strengthened: in particular, the phase of diminishing inequality from 1350 and the phase of rising inequality from circa 1450 discussed in the following sections.
PLAGUE AND INEQUALITY FROM THE BLACK DEATH TO THE SEVENTEENTH-CENTURY EPIDEMICS
The impact of past plagues on long-run economic growth and development has been the object of a considerable amount of research. Most scholars have focused on the first and most severe epidemic of the Middle Ages, the Black Death of 1347–1352 (Clark Reference Clark2007, pp. 99–102; Cohn Reference Cohn2007; Pamuk Reference Pamuk2007; Malanima Reference Malanima and Lo Elio2012; Voigtländer and Voth Reference Voigtlander and Voth2013). Guido Alfani (Reference Alfani2013b) has argued that the last of the great plagues, during the seventeenth century also had profound consequences for Europe contributing to the “little divergence” within the continent. Few explore the impact that plague had on economic inequality (Alfani Reference Alfani2010b for Ivrea).
According to Herlihy (Reference Herlihy1967), because of the prevailing partible system of inheritance an unprecedented mass fragmentation of patrimonies occurred after the Black Death. Such fragmentation enabled those who had the means to buy and consolidate property. As a result, the Black Death had short-term egalitarian consequences to be followed soon after by medium- to long-term anti-egalitarian effects, especially due to the crisis of medium-sized patrimonies.
By the time of the last great epidemics in the seventeenth century, plague seems to have had a very different impact on patrimonies and on wealth distribution (Alfani Reference Alfani2010b). The Black Death affected a virgin soil population (Livi Bacci Reference Livi Bacci2007). Thereafter plague was endemic and changed the human environment in a lasting way. Consequently, in the following centuries adaptation to the new environment occurred. In particular, Italian families started making fairly systematic use of social and juridical institutions aimed at preventing fragmentation of patrimonies; fideicommissum is probably the most common and well-known (Leverotti Reference Leverotti2005, Reference Leverotti2007).Footnote 17 In the post-Black Death era, these institutions made the newly-constituted large patrimonies more resilient, thus helping to entrench the increase in inequality triggered by the plague. Additionally when, during the seventeenth century, Italy was struck by particularly severe plague epidemics (Alfani Reference Alfani2013b), their changes to land ownership were kept in check by fideicommissa and similar institutions.
In Herlihy's view, the high levels of wealth inequality in the late Middle Ages had no equivalent before 1348; for him the Black Death altered forever a relatively egalitarian economic distribution that characterized early fourteenth-century Europe. Herlihy based this on his own pioneering work on the Tuscan city of Pistoia (Herlihy Reference Herlihy1967). Given the rarity of pre-Black Death estimi none have to date examined this hypothesis. The data presented here allow me to examine inequality prior to and after the Black Death. The time series reconstructed for Chieri begins in 1311, and that for Cherasco begins in the immediate aftermath of the epidemic. For one of the four quarters of the city, St. Martino, the series begins on the eve of the plague, in 1347.Footnote 18
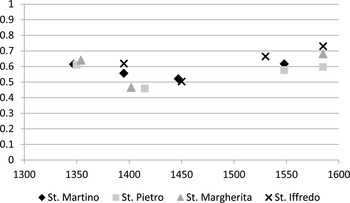
The data presented in Figure 2 for the Piedmont do not support Herlihy's conclusions. For Chieri, the Gini value for 1311 (0.715) is considerably greater than the 0.669 calculated for the first post-plague observation, in 1437. The estimi for these two years are complete and excellently preserved, so this is high-quality information. For Cherasco, the Gini value circa 1350 is 0.63, declining to 0.546 in 1395–1415, and to 0.521 in 1447–1450. Only from 1450 would inequality start to rise after a century-long decline. In fact, 1450 seems a real turning point for wealth distribution in Piedmont, discussed later more extensively. As the Cherasco time series has been built from quarter-level estimi and for one quarter the series begins immediately before the Black Death, Figure 4 charts the quarter-level Gini indexes for all the estimi used.Footnote 19 In each quarter, inequality declined from the middle of the fourteenth century up to approximately 1450. By the middle of the sixteenth century in all quarters inequality was well above the 1400–1450 levels. The differences between quarter-level measures reflect differences in the social and economic composition of the population of each quarter. For example, the quarter of St. Iffredo was the area of the city where many poor dwelled, but also where some very rich families had seized the opportunity to build luxurious houses; such polarization tends to increase the Gini value over the city average. The quarter of St. Martino, which was the political and manufacturing center of Cherasco and included the palace of the comune (the town hall), the market, artisan shops, and the homes of many local merchants, is particularly interesting also due to the density of information available around the plague years. In 1347, the Gini index for St. Martino was 0.614. About 50 years later, in 1395, it had declined to 0.557. This trend continued well into the fifteenth century; in 1447 the Gini had shrunk to 0.521. In addition, the share of the top 10 percent declined from 45.83 percent in 1347, to 41.47 percent in 1395, and 34.38 percent in 1447.
WEALTH INEQUALITY PER QUARTER IN CHERASCO, 1347–1585 (GINI INDEXES)

The medium- and long-run consequences of the Black Death in Piedmont were the opposite of what Herlihy had suggested for Tuscany. Additional comparative research is needed to clarify the reason for such difference. However, the trends in inequality in the Piedmontese cities and rural areas are consistent with the hypothesis that the Black Death determined a significant increase in real wages of skilled and unskilled workers (Pamuk Reference Pamuk2007), who consequently would have had more resources to buy property.
In 1630, Piedmont was affected by what was probably the worst plague to strike Italy since the Black Death.Footnote 20 In the North, according to the most recent estimate, about 2 million people, amounting to 30–35 percent of the overall population, died (Alfani Reference Alfani2013b, p. 411). Of the cities included in this study, only Cherasco was spared. However as Table 2 shows the steady decline in inequality found after the Black Death did not occur after the 1630 epidemic. For Ivrea where the data are particularly rich, earlier studies showed that the 1630 plague had mostly short-term consequences on overall inequality levels (Alfani Reference Alfani2010a, Reference Alfani2010b). Not only were patrimonies quick to re-organize, but steady immigration from the surrounding rural areas increased inequality as relatively poor people settled within the city walls and also entered the property tax registers. If we accept that the case of Ivrea can be reasonably assumed to be representative of what happened in other Piedmontese cities affected by the 1630 plague, we can conclude that the epidemic had only a limited impact on inequality and only reinforced an existing trend.Footnote 21 The difference with the aftermath of the Black Death is striking and, as discussed previously, earlier studies suggest that this can be explained with institutional adaptation that occurred between the Black Death and the 1630 plague (Alfani Reference Alfani2010b).
ESTIMATING INEQUALITY AT THE REGIONAL LEVEL: PIEDMONT AND THE SABAUDIAN STATE
The data presented in the previous section, are well suited to discover long-run community-level tendencies. Now I consider regional measures in order to make comparisons on a broader scale. To do so, I developed a simple method for data aggregation, which future research will also apply to other areas. The “regional” time series produced can be interpreted in two ways: either as representative of northwestern Italy or Piedmont (in the boundaries of the current administrative region), or as representative of a specific political-institutional entity, the Sabaudian State, or at least its Italian part.
The main challenge in obtaining regional measures of inequality is that we cannot simply average Gini indexes for different communities around the same year, because (1) we would lose all information about between-community inequality and (2) we would be unable to explore the distribution in meaningful ways. The proper way to aggregate information about wealth or income distributions is either to obtain directly an overall distribution by using the data of each household, or to build a “fictitious distribution,” which approximates the actual distribution in the best way possible. Lack of information about each household of Piedmont excludes the first option. Moreover, information about households residing in different communities is not directly comparable, as their taxable wealth is expressed in various lire that cannot be converted into market values expressed in a common currency. Building a fictitious distribution starts with the information about deciles, thus modeling for each community a distribution of 100 elements, or “fictitious households” with 10 fictitious households per decile, each having the same share of wealth. The tenth decile (the rich) is modeled in greater detail, using information about the top 5 and top 1 percent. This method presents several advantages. First, it gives equal weight to communities of different sizes so that we can consider each of them an “observation point” on par with all others, thus maximizing territorial representation of the sample. Second, it allows to fully exploit the data from earlier published quantiles. Third, it eases the task of aggregating and comparing community-level data. As it is not possible to compare wealth measures from different estimi, I assume that across sample cities the average wealth of owners is the same.Footnote 22 The same assumption is made across rural communities. In principle, this is sufficient to build separate “urban” and “rural” overall distributions.
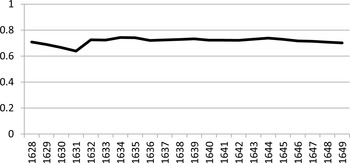
A more complex task is to build a regional distribution that includes both cities and rural areas. Structural differences in wealth (or income) levels between city and country form a fundamental component of region- or state-level inequality, and average wealth levels were hardly the same in the two environments. Luckily enough, for the Canavese area, where about one-third of the communities in the sample were placed (including the city of Ivrea), rural and urban data come from the same sources and are expressed in the same lira. Hence, it is possible to compute yearly differences in average wealth of rural and urban owners in the period from 1628 to 1649 (Figure 5). Apart for some limited short-term fluctuations around the plague years, the rural/urban average wealth ratio was almost identical at the beginning and the end of the period (0.709 in 1628 and 0.702 in 1649). In absence of information for other areas and periods, I considered rural owners to be on average 30 percent less wealthy than urban owners.
RURAL/URBAN AVERAGE WEALTH RATIO IN THE CANAVESE, 1628–1649

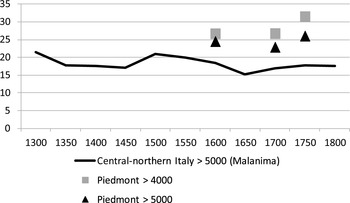
The second weighting issue involves giving the correct “demographic” representation to data about cities and rural areas. The most recent estimate of urbanization rates for central-northern Italy places it at 18.4 percent around 1600 for cities with more than 5,000 inhabitants, and at 14.5 percent if only cities with more than 10,000 inhabitants are considered (Malanima Reference Malanima2005, p. 106, Reference Malanima2011, p. 182). The 5,000 threshold better represents the urban population of late medieval and early modern Italy (Alfani Reference Alfani2007, pp. 571–72, Reference Alfani2013a, pp. 145–48). This is particularly true for a region like Piedmont with many cities but with very few urban centers with more than the 10,000 threshold (according to a 1612 census, only five, one of which was Chieri).Footnote 23 In fact, for Piedmont, and probably for the rest of northern Italy until the early eighteenth century, the 5,000 threshold should be brought down to 4,000 to properly capture the share of the population living in cities (Alfani Reference Alfani2013a, p. 146). According to the 1612 census, using the 4,000 threshold Savoy Piedmont had an urbanization rate of 26.7 percent (the urbanization rate calculated for cities with more than 10,000 inhabitants would be just 9.9 percent, and for cities with more than 5,000, 24.5 percent). Similar sources allow a calculation of urbanization rates for 1734 (26.8 percent with more than 4,000; 22.9 percent with more than 5,000) and 1774 (31.5 percent with more than 4,000; 26.1 percent with more than 5,000). Figure 6 shows that at least in the case of small cities (more than 5,000), urbanization rates in Savoy Piedmont were higher than the average for northern-central Italy. Moreover, these rates would increase significantly during the eighteenth century while elsewhere they were stagnating, reflecting the relative economic dynamism of the Piedmontese economy in that period.
URBANIZATION RATES IN PIEDMONT AND NORTHERN ITALY

The data indicate that 25 percent is a reasonable weight to assign to the urban distribution for most of this period, save in 1750 and 1800 when it has to be raised to 33 percent. To build “weighted” fictitious distributions, I used a procedure similar in many respects to that described by Branko Milanovic (Reference Milanovic2005) for calculating “weighted international inequality.”Footnote 24 The proposed method allows to represent in a synthetic way the phenomena discussed in the earlier sections. Figure 7 shows the different behavior of urban and rural environments. As expected, on average, inequality was greater in cities than in rural areas. The figure also clearly shows that, for purely demographic reasons, the overall inequality level follows more closely the trend of rural areas than that of cities. Finally, it confirms the ability of the synthetic representation to capture another key finding: the overall trend (either of the whole region, or of the urban and rural environments) is determined by the trend of the share of the top rich.
INEQUALITY IN PIEDMONT, 1300–1800 (GINI INDEXES OF WEALTH CONCENTRATION AND SHARE OF TOP 5 PERCENT)

THE BROADER PICTURE: SEARCHING FOR THE SOURCES OF INEQUALITY CHANGE
After the phase of equality triggered by the Black Death, from about 1450 inequality in Piedmont tended to increase both at the local, and at the regional level. 1450 is also a turning point in all reconstructions of the Italian long-run demographic trend: after a long period of stagnation, closely connected to high and recurrent epidemic mortality mostly caused by plague, all areas of the Peninsula started to recover their pre-1348 demographic size (Alfani Reference Alfani2010c, pp. 29–30; Pinto Reference Pinto, Del Lorenzo, Bacci, Pinto and Sonnino1996, pp. 60–61). Recovery would be completed only by the end of the sixteenth century, after a phase of demographic (and economic) stagnation during the Italian Wars (1494–1559). The considerable demographic growth of the sixteenth century occurred in about 30 years (1560–1589) (Alfani Reference Alfani2013a, pp. 149–65; see in particular the time series for Piedmont 1550–1628 on p. 161). The data presented here indicate that inequality might have been stable or slightly declining in the first half of the century, showing greater dynamism (and a tendency to resume growing) in the second half.
The demographic growth of the second half of the fifteenth century appears to have matched with economic growth, as well as the growth of the second half of the sixteenth century. The only other published regional study of long-term trends in pre-industrial economic inequality based on actual data suggested that in Holland, economic and demographic growth mapped inequality growth: “On the whole inequality increased in proportion to the prosperity and size of towns and villages. The results suggest that there was a highly uneven distribution of the benefits of economic development. The case study of Holland also showed that economic growth during the golden age led to a more unequal distribution of income” (Van Zanden Reference Van Zanden1995, p. 661). Van Zanden proposes different explanations of why economic growth could foster inequality growth: (1) urbanization, (2) increasing skill premium, and (3) changes in functional distribution of income.
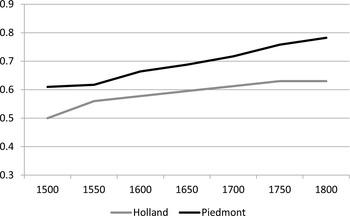
Figure 8 displays the striking similarity in inequality trends in Piedmont and Holland.Footnote 25 The different sources used (records of taxable wealth for Piedmont; rents of houses for Holland) could easily explain structural differences in Gini values. Both series, however, can be reasonably assumed to reflect overall changes in income distribution. The series show a very similar long-term growth in inequality throughout the early modern period.
LONG-TERM TREND IN INEQUALITY IN HOLLAND AND PIEDMONT, 1300–1800 (GINI INDEXES)

Although in both areas sixteenth-century inequality growth appears to be associated with economic and demographic growth, the picture becomes much more complex if we consider the seventeenth and eighteenth centuries. The seventeenth century was the “Golden Age” of the Dutch Republic, while scholars have considered the period one of crisis for the Italian states. Some studies have softened this view introducing the notion of “relative decline” (Sella Reference Sella1997; Lanaro Reference Lanaro2006). The last great plagues of the seventeenth century affected Italy much more severely than its main northern European competitors and caused a shock to the Italian economies that might have been the real starting point of their relative decline (Alfani Reference Alfani2013b). This is particularly apparent in the case of cities, for which the 1629–1630 plague had a long-lasting and negative effect (Alfani and Percoco Reference Alfani and Percoco2014). In the eighteenth century, few would deny that the economies of the Italian Peninsula became increasingly backward and sluggish; Paolo Malanima (Reference Malanima2006) in particular made a strong case that this was the real Italian “Age of Decline.” However in northwestern Italy, inequality continued to grow during the seventeenth and eighteenth centuries. One could make the case that the Sabaudian State, which grew to become the Kingdom of Sicily in 1713 and of Sardinia from 1720 but whose heart always was Piedmont, is the exception in the Italian landscape. With a minor role during the Italian Renaissance, Piedmont flourished in the Baroque era, culturally, institutionally, and as a military power. Its territorial expansion continued throughout the seventeenth and the eighteenth centuries, and its capital (Turin) grew to become one of the most admired cities of continental Europe. However, economically and demographically the picture was more bleak, at least if we consider the seventeenth century. Overall, the population of Savoy Piedmont stagnated: 900,000 inhabitants are reported for 1612 and 950,000 for 1700, but the small increase is almost entirely due to the acquisition of Alba with its territory in 1631 (Beloch Reference Beloch1994, p. 583). By 1734, urbanization rates were about the same as in 1612, and the share of the population residing in large cities had significantly declined. The country did not fare better than the cities, as the agrarian sector as a whole alternated stagnation and decline from 1600 up until 1660–1670; overall, at the beginning of the eighteenth century rural wages were no higher (and possibly a little lower) than at the end of the sixteenth (Woolf Reference Woolf1962, pp. 15–16, 34–35). From 1630 to 1660, plague and civil war heavily damaged trade and all productive activities (Barbero Reference Barbero2008, pp. 203–4). In particular, the five-year-long civil war which erupted in 1638 between the madamisti (supporters of the “Royal Madam” Cristina, who, with French aid, claimed the regency in the name of her son Carlo Emanuele) and the principisti (supporters of the princes Maurizio and Tommaso, Carlo Emanuele's uncles, who enjoyed Spanish help) caused considerable damage throughout the region, repeatedly invaded and sacked by foreign “allied” armies. The Sabaudian State remained a divided and partly foreign-occupied country well after the official end of the conflict, until Carlo Emanuele came of age in 1648. In fact, the civil war caused a durable (and very damaging to the economy) fracture in the Piedmontese élites, which did not start to mend until Cristina's death in 1663 (Rosso Reference Rosso, Merlin, Rosso, Symcox and Ricuperati1994, pp. 236–52).
From the 1670s or 1680s the economy started to recover and during the eighteenth century the region would show an impressive agrarian, commercial, and proto-industrial dynamism, but overall it would be difficult to argue that the seventeenth century was one of significant economic development. If we look closer at the cities analyzed here, they all seem to be suffering, partly from the demographic attraction and competition exerted by Turin (Levi Reference Levi1985) and partly due to the crisis of commerce and of the textile sector, like in Chieri (Barbero Reference Barbero2008, p. 293) which “already at the end of the sixteenth century, [had started] the long decline which would transform it into a minor center, subordinate and sleepy, of the Turin province” (Allegra Reference Allegra1987, p. 16, author's translation). In Saluzzo, the loss of the status of capital of an independent marquisate in 1588 was associated with a marked decline of all trades and the progressive wane of the local elite throughout the seventeenth century—a decline further aggravated by the civil war which greatly affected this part of Piedmont (Merlotti Reference Merlotti and Fratini2004). Also Ivrea underwent repeated crises during the seventeenth century, but this did not stop inequality growth (Alfani Reference Alfani2010a, pp. 546–47). Moreover, recent research on other areas of Europe that experienced difficult economic conditions during the seventeenth century, like central Spain (Santiago-Caballero and Fernández Reference Santiago-Caballero and Fernández2013), display increases in inequality even in times of economic stagnation or decline.Footnote 26
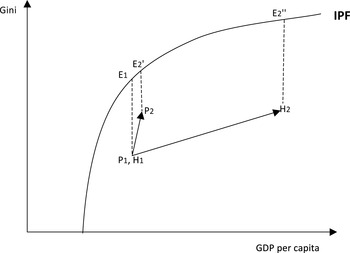
Recently, Milanovic, Lindert, and Jeffrey G. Williamson (Reference Milanovic, Lindert and Williamson2011) introduced the concept of the inequality possibility frontier, which postulates that the maximum inequality a society can achieve corresponds to a perfectly unequal distribution not of the whole, but of the surplus above subsistence. Consequently, one should consider not only overall inequality levels, but also how “extractive” a society is, that is, how close to the inequality possibility frontier it places itself. Using Van Zanden's data, Milanovic, Lindert, and Williamson estimate that Holland grew less extractive over time. For Piedmont, it might be that extraction rates were stable in the period from 1450 to 1600 (and one could wonder if they were, in fact, decreasing in the century following the Black Death) and inequality growth was due solely to economic growth. However, in the period from 1600 until 1700 or maybe even 1750 it seems probable that most of the inequality growth was due to the Piedmontese/Sabaudian society becoming more extractive. Growing extraction rates would make a stagnating economy compatible with the steady increase in inequality suggested by the empirical evidence.
Using the inequality possibility frontier framework, Figure 9 presents the paths that could have been followed by seventeenth-century Piedmont and Holland. For simplicity, I assume at the starting point (P1, H1) the same inequality (as measured by Ginis) and economic development (gross domestic product (GDP) per capita). Across time, Piedmont moves from P1 to P2 and Holland from H1 to H2. The change in inequality is similar. However, in Piedmont this occurs with little or no economic growth and much extraction growth (P2 moves closer to the inequality possibility frontier: P2E2'<P1E1), whereas in Holland the change in inequality is solely associated with economic growth as extraction rates are in fact declining (H2E2”>H1E1).
INEQUALITY EXTRACTION IN PIEDMONT AND HOLLAND (HYPOTHETICAL PATHS)

Considering the history of the Sabaudian state during the early modern period, it can be argued that it was becoming more extractive. Having recovered in 1559 full control of their domains at the end of the Italian Wars, the Savoys strengthened their authority over the disparate territories they ruled and progressively built a “unified” state. Their fiscal policy, especially, after the introduction in 1562 of the tasso became more extractive in the sense that it enabled the central authority to syphon more resources from the local communities (Stumpo Reference Stumpo1979). This was a crucial development that helped the Sabaudian state to become a respectable military power in an age in which waging war was increasingly costly. In fact, the Sabaudian state was simply participating in a particularly intense way (to counter-balance its somewhat limited size) in a process involving all of western Europe—the so-called “rise of the fiscal state” (Bonney Reference Bonney1999; Dincecco Reference Dincecco2011; Yun-Casalilla and O'Brien Reference Yun-Casalilla and O'Brien2012). If we look at this process from the point of view of households (the units of measurement of our wealth/income distributions), we can easily accept the hypothesis that in the early modern period, a lucky few considerably profited from more extractive “public” institutions. Additionally, evidence from contemporary societies shows that increases in inequality extraction and civil wars are associated (Milanovic Reference Milanovic2013). What happened to the Sabaudian state, suffering from civil war in 1638–1642, resembles this contemporary pattern.
While institutional change probably played an important role in making the Piedmontese society more economically unequal, that is only part of the story. Another fundamental factor is demography. As the micro-level data for the city of Ivrea analyzed elsewhere indicate, in urban environments immigration from rural areas could act as a kind of perpetual generator of inequality, a process that became markedly more intense in the years immediately following demographic shocks like the seventeenth-century plagues (Alfani Reference Alfani2010a, Reference Alfani2010b). In rural areas, in contrast, the impact of out-migration on inequality levels is less clear, and more generally urban-rural interaction as a factor influencing inequality requires further research.Footnote 27 Other demographic processes very probably also played a role, and particularly the population pressure that between the late sixteenth and the seventeenth century in many parts of continental Europe determined the crisis of small holdings, with a large share of the peasants selling their land to great landowners (Le Roy Ladurie Reference Le Roy Ladurie1966; Kamen Reference Kamen1976; Alfani Reference Alfani2013a, pp. 76–77). In Piedmont, too, this process was responsible for at least part of the increase in inequality to be found in rural areas.
All in all, the evidence presented here suggests that any explanation of long-term inequality change solely focused on economic development is, at best, incomplete. The evidence that inequality also grew in stagnating or declining areas, especially during the early modern period, suggests that we should look for different explanations. The concept of the inequality possibility frontier provides a useful intellectual framework for understanding how inequality could also increase in the absence of economic development (and consequently, of generation of a greater surplus); a stagnating society could simply become more efficient at extracting inequality, getting closer to the boundary. Another promising path of enquiry seems to be looking into inertial processes, primarily of a demographic nature, as continuous generators of inequality. In fact, as a final reflection, it could be useful to provide a different interpretation of what the inequality possibility frontier was—not just a theoretical upper boundary to inequality, but a de facto attractor of inequality. In other words, during the early modern period if a society could become more unequal, then it did—and the only way it could avoid becoming more extractive, too (i.e., to redistribute more efficiently income and wealth from the lower to the upper echelons of society), was to develop economically quickly enough to escape falling into a kind of “inequality trap.”
CONCLUDING REMARKS
Using data collected from previously unexplored archival sources, this article presents the first long-term analysis of economic inequality in northwestern Italy (Piedmont) over the five centuries from approximately 1300 until 1800. With the exception of the study of Holland by Van Zanden (Reference Van Zanden1995), no other study systematically describes and analyzes long-term inequality trends in pre-industrial Europe.
The Piedmontese case provides strong support to the argument that during the early modern period, inequality was growing, both in cities and in rural areas, and independently from whether the economy was growing or stagnating. This finding casts doubts on earlier views that explained inequality growth as the consequence of economic development. This finding, if confirmed by further and much-needed new research about other areas of pre-industrial Europe, would also require some theoretical re-elaboration to be fully accounted for. For Piedmont, I underline the importance of demographic processes that could have acted as continuous generators of inequality. I also use the framework of the inequality possibility frontier to explain how a society could become more extractive, and consequently more unequal, also in times of economic stagnation. This work suggests that we might have to think differently about the inequality possibility frontier—not only as an upper boundary to inequality, but also as an inequality high level towards which a society will be attracted even in times of economic crisis or stagnation.
The article also makes a strong case for the need for more empirical research on inequality trends in pre-industrial times. In fact, while broad tendencies stand out at the continental scale, much interesting local or regional variation also emerges with micro-level data from local communities, for example in the analysis of the most severe mortality crisis: the Black Death. Also in this respect, the study of inequality trends in Piedmont is unique—the only exception being the works by Herlihy (Reference Herlihy1967, Reference Herlihy, A, Miskimin and Udovitch1977) on Tuscany. Unlike Tuscany, though, in Piedmont the century following the Black Death was one of declining, not growing, inequality. Within Piedmont itself, inequality trends after different plagues did not always follow the same pattern: by the seventeenth century, even very severe mortality crises had consequences deeply different from the Black Death, probably due to the institutional change (e.g., the growth of fideicommissa) that occurred in-between. More generally, in the early modern period the way in which demographic and economic growth interacted with inequality trends seems to be significantly different from the Middle Ages. This is another interesting finding that needs further research.
Many of the findings on long-run inequality trends in pre-industrial Piedmont present remarkable similarities with those on contemporary societies. The fact that the general inequality trend is driven by the top wealthy is an empirical regularity that seems to be constant from the Middle Ages until today. More generally, data from pre-industrial northwestern Italy suggests that in the very long term, inequality almost always tended to increase. Were this picture confirmed by further research, it would probably affect the way in which we think about contemporary trends in inequality and their main drivers. In relation to this, we could wonder if the time has come to re-think the significance of the “Kuznets curve”—no longer a general tool for interpreting the link between economic development and inequality, with its implicit promises, but a description of what happened during a relatively short phase, the Industrial Revolution. However, as Kuznets himself had to point out in his 1955 article, for now this is mostly speculation in search for some solid empirical support.