


I. Introduction
The debate over whether market concentration across U.S. industries is rising, and whether consolidation has weakened competition, has attracted increasing attention and controversy in both academic and policy circles (e.g., see Gutiérrez and Philippon (Reference Gutiérrez and Philippon2017), Grullon, Larkin, and Michaely (Reference Grullon, Larkin and Michaely2019), Hoberg and Phillips (Reference Hoberg and Phillips2025), and Shapiro and Yurukoglu (Reference Shapiro and Yurukoglu2026)).Footnote 1 At the same time, shifts in global trade policy marked by rising protectionism and renewed calls for reshoring have revived concerns about how firms sustain international competitiveness. While prior research has largely focused on the implications of these trends for prices, innovation, and consumer welfare, little is known about how domestic market structures shape firms’ international expansion decisions. For example, a recent policy survey of European exporters suggests that stronger domestic competition enhances foreign competitiveness by improving product quality (Argentesi, De Simone, Stephan, and Scrutinio (Reference Argentesi, De Simone, Stephan and Scrutinio2024)). However, survey evidence reflects perceptions rather than revealed strategic behavior and does not establish whether domestic competition induces firms to expand abroad. Thus, whether competitive pressure at home translates into actual foreign market expansion remains an open empirical question.Footnote 2 This lack of evidence matters. If competition at home strengthens firms’ ability to compete abroad, then changes in domestic market structure and competition policy may have important consequences not only for domestic efficiency but also for firms’ success abroad.
This article aims to fill this gap and investigates how domestic product market competition affects U.S. firms’ foreign market expansion. We examine two competing hypotheses. The salubrious competition hypothesis predicts that domestic competition strengthens firms’ capabilities and incentives to compete abroad through, for example, efficiency improvements, innovation, and differentiation. By contrast, the national champions hypothesis predicts that firms in more concentrated domestic markets can use market power, economies of scale, and access to resources to support foreign expansion (see, e.g., Kim and Marion (Reference Kim and Marion1997), Sakakibara and Porter (Reference Sakakibara and Porter2001), Clougherty and Zhang (Reference Clougherty and Zhang2009)). The sign of the relation between domestic competition and foreign expansion is therefore theoretically ambiguous.
We test these hypotheses in a sample of 5,759 publicly traded U.S. firms from 1997 to 2017. We measure foreign market expansion using the text-based offshoring data from Hoberg and Moon (Reference Hoberg and Moon2017), (Reference Hoberg and Moon2019), focusing on firms’ output offshoring activity (output offshore). This variable captures how often firms mention foreign sales-related activities in their 10-K filings and therefore provides a broad measure of foreign market presence through sales, distribution, and other output-market activities. To measure domestic product market competition, we primarily use the TNIC HHI variable developed by Hoberg and Phillips (Reference Hoberg and Phillips2016). Because TNIC industries are based on product text similarity and allow firms to shift across product markets over time, this measure provides useful within-firm variation in domestic competition.
We estimate Poisson fixed effects regressions of output offshoring on TNIC HHI, including firm control variables that could be correlated with foreign expansion and competition (firm size and age in the baseline model, and a wider set of controls in robustness checks), and firm and year fixed effects. The results show that higher domestic concentration (competition) is associated with significantly lower (higher) foreign sales expansion. Economically, a one-unit increase in TNIC HHI is associated with a decline of 3.9 in output offshore counts, corresponding to a 19.6% decline relative to the sample mean. The result is robust to specifications absorbing industry-by-year, state-by-year, and industry-by-state-by-year shocks, and to alternative measures of competition, including product market fluidity (Hoberg, Phillips, and Prabhala (Reference Hoberg, Phillips and Prabhala2014)), product similarity (Hoberg and Phillips (Reference Hoberg and Phillips2016)), and the number of industry rivals (e.g., Morellec and Zhdanov (Reference Morellec and Zhdanov2019)). Overall, these results support the salubrious competition hypothesis.
Next, to address endogeneity concerns, we exploit staggered state-level rejections of the Inevitable Disclosure Doctrine (IDD) as a labor mobility shock (see, e.g., Na (Reference Na2020)). A well-established economics literature argues that labor mobility restrictions stifle competition by erecting entry barriers and shifting labor and product market power to incumbents and industry leaders (see, e.g., Marx and Fleming (Reference Marx and Fleming2012), Starr (Reference Starr2026)). As such, policies lifting labor mobility restrictions have pro-competitive effects. We interpret IDD rejections as labor mobility shocks that increase competitive pressure through two related margins: first, through the reallocation of workers and poaching by rivals; and second, through the greater diffusion of knowledge via employees moving between firms. The difference-in-differences (DiD) estimates using the Callaway and Sant’Anna (Reference Callaway and Sant’Anna2021) framework to account for heterogeneous treatment effects show that firms headquartered in states rejecting IDD significantly increase output offshoring relative to comparable firms in unaffected states. Dynamic treatment effects show no significant pre-treatment differences and become positive only after rejection, supporting the parallel trends assumption. Additional evidence using the Labor Mobility Index (LMI) of Bai, Eldemire, and Serfling (Reference Bai, Eldemire and Serfling2024) indicates that greater labor mobility increases foreign sales, especially in initially concentrated industries, consistent with labor mobility relaxing frictions that protect incumbent firms.
We next examine the economic channels plausibly explaining these effects by analyzing which firms respond more strongly to labor mobility-induced competitive shocks. Guided by the view that competition operates not only through efficiency but also through differentiation, we argue that the effects depend on i) whether firms possess strong intangible and organizational capabilities (such as advantages in technology, organizational capital, and brand capital), ii) whether they have sufficiently high profitability and iii) whether they have valuable investment opportunities to support their foreign operations. We estimate the IDD rejection effects separately for high and low subsamples based on pre-treatment firm characteristics.
The evidence from the heterogeneity tests is strongest for firms with greater intangible and organizational capabilities, especially organizational and brand capital, and for firms with higher profitability. This pattern is consistent with the labor mobility nature of the IDD shock. Specifically, when workers and knowledge become more mobile across firms, firms with stronger organizational and brand capital are better able to preserve differentiation, commercialize innovations, and redeploy knowledge in foreign markets. Profitability, in turn, provides the internal resources needed to absorb the fixed costs and risks of foreign expansion. The evidence for growth opportunities is positive but weaker, and we therefore interpret it as suggestive. Overall, these findings suggest that domestic competition does not induce foreign expansion uniformly across firms but stimulates output offshoring primarily among firms with the capabilities needed to convert competitive pressure into foreign sales.
Although our main focus is on output offshoring, we also examine whether domestic competition affects input offshoring. This extension is important because output and input offshoring are related but economically distinct. Output offshoring captures foreign market expansion, whereas input offshoring reflects cost-side sourcing and production decisions. Using the IDD rejection setting, we find that labor mobility-induced competitive pressure positively affects input offshoring, but through a different channel. The response is strongest among firms with high employment growth and exposure to growing industry-level labor costs. Together, this evidence suggests that labor mobility shocks that intensify competitive pressure shape firms’ internationalization strategies on both the revenue and cost sides, but through distinct economic channels.
Our article contributes to the literature in several ways. First, it adds to the literature on finance and offshoring. Hoberg and Moon (Reference Hoberg and Moon2017) show that firms offshore as an operational hedge, Hoberg and Moon (Reference Hoberg and Moon2019) and Bretscher (Reference Bretscher2023) document return and risk implications of offshoring, Choi, Ju, Trigeorgis, and Zhang (Reference Choi, Ju, Trigeorgis and Zhang2021) show that financially constrained firms are more likely to engage in foreign outsourcing, and Chen, Dasgupta, Huynh, and Xia (Reference Chen, Dasgupta, Huynh and Xia2023) show that offshoring reduces the marginal benefits of tax avoidance. By contrast, we show that domestic competition is a key determinant of firms’ decisions to expand abroad into horizontal foreign markets. By focusing on output offshoring as a strategic sales decision, our analysis highlights how competition shapes firms’ revenue expansion abroad. Moreover, we add an international dimension to the debate on the relation between market structures and firm outcomes, such as economies of scope and scale (e.g., Hoberg and Phillips (Reference Hoberg and Phillips2025)), profitability and valuations (e.g., Grullon et al. (Reference Grullon, Larkin and Michaely2019)), and investment policy (e.g., Gutiérrez and Philippon (Reference Gutiérrez and Philippon2017)).
Second, our article contributes to the literature on product market competition and corporate investment. Prior work shows that competition disciplines managers and improves investment efficiency (see, e.g., Hart (Reference Hart1983), Nickell (Reference Nickell1996), Schmidt (Reference Schmidt1997), Raith (Reference Raith2003), and Giroud and Mueller (Reference Giroud and Mueller2011)), affects investment timing (Akdoğu and MacKay (Reference Akdoğu and MacKay2008)) and firms’ strategic response to entry threats (Frésard and Valta (Reference Frésard and Valta2016)). However, how competition affects firms’ investments aimed at foreign market expansion remains unsettled. For instance, while Bertrand and Capron (Reference Bertrand and Capron2015) find that firms from more competitive domestic markets are more likely to make cross-border acquisitions, Loncan (Reference Loncan2023) finds that domestic competition is associated with a lower propensity to conduct greenfield FDI. We advance this literature by showing that domestic competition affects firms’ decisions to sell output abroad, particularly among firms with stronger intangible assets and organizational capabilities, as well as sufficient financial resources to support foreign market expansion.
Third, our article contributes to the literature on competition and internationalization. Existing studies primarily focus on exports or industry-level outcomes (see, e.g., White (Reference White1974), Caves (Reference Caves1974), Porter (Reference Porter1990), Ito and Pucik (Reference Ito and Pucik1993), Ito (Reference Ito1997), Kim and Marion (Reference Kim and Marion1997), Elango (Reference Elango1998), Sakakibara and Porter (Reference Sakakibara and Porter2001), Hollis (Reference Hollis2003), Clougherty and Zhang (Reference Clougherty and Zhang2009), Hutzschenreuter and Gröne (Reference Hutzschenreuter and Gröne2009), Francois and Wooton (Reference Francois and Wooton2010), Grøgaard, Gioia, and Benito (Reference Grøgaard, Gioia and Benito2013), and Bertrand and Capron (Reference Bertrand and Capron2015)). Using firm-level, text-based measures of output offshoring, we provide new evidence on how domestic market structure affects foreign market expansion, including horizontal foreign presence and expansion through means beyond exports, such as sales, customer service, and distribution networks.
II. Related Literature and Hypotheses
The theoretical and empirical analysis of the effects of domestic competition on firms’ decision to export and to engage abroad has received considerable attention in the literature over the past decades.Footnote 3 The main takeaway from this literature is that domestic competition has the potential to be a key determinant of export performance and international expansion.
The discussion about how domestic competition shapes firms’ decisions to sell products and services abroad, however, is not settled. First, most of the literature focuses on firms’ export performance. This focus on export performance is relatively narrow. Firms can expand internationally through other means, such as foreign direct investment (FDI), strategic alliances, or mergers and acquisitions (see, e.g., Bertrand and Capron (Reference Bertrand and Capron2015), Loncan (Reference Loncan2023)). In this article, we therefore analyze a more general form of firms’ foreign activity using novel data from Hoberg and Moon (Reference Hoberg and Moon2017) and Hoberg and Moon (Reference Hoberg and Moon2019) on firms’ output offshoring, which includes various means of expansion abroad. Moreover, most studies looking at FDI (e.g., greenfield and M&As) do not explicitly identify firms’ strategic intent in going abroad, since FDI can be vertical or horizontal in nature. The detailed measure of output offshoring that we use in this article allows us to capture horizontal expansion via foreign sales more precisely. Second, existing research typically uses aggregate data by industry or data on only one specific industry (e.g., airlines in Clougherty and Zhang (Reference Clougherty and Zhang2009)) to explore the relation between competition and export performance. While this research provides valuable insights, it does not allow us to exploit within- and cross-firm variation to analyze the specific economic channels that allow firms to overcome the barriers to expanding abroad. In this article, we advance the literature by performing a firm-level analysis with detailed data on firms’ output offshoring.
The literature on the effects of domestic competition on exports broadly distinguishes two competing views (see, e.g., Clougherty and Zhang (Reference Clougherty and Zhang2009)). The first view is that domestic competition promotes firm-specific productivity, which generates efficiency-enhancing capital reallocations within industries that improve firms’ strengths and capabilities. However, we view competition more broadly as operating not only through cost discipline and efficiency but also through differentiation, such as product positioning, innovation, or the protection of intangible assets (Hotelling (Reference Hotelling1929), Chamberlin (Reference Chamberlin1933)). In such a setting, firms’ ability to differentiate their products and protect or redeploy intangible assets becomes central to how they respond to competition. Hence, improvements in both efficiency and differentiation can help firms build the capabilities needed to access foreign markets and compete with rivals abroad. We call this the salubrious competition view.
The alternative view contends that domestic concentration fosters firms’ expansion abroad. By accessing horizontal foreign markets, firms in concentrated markets can generate additional economies of scale and profits. In this view, which we call the national champions view, firms in concentrated markets can realize further returns to scale by going abroad. We summarize these views in the following two hypotheses:
Hypothesis 1a (Salubrious Competition). Domestic competition is positively associated with output offshoring.
Hypothesis 1b (National Champions). Domestic competition is negatively associated with output offshoring.
III. Data and Research Design
This section describes the data set, the construction of the variables used in the analysis, and the empirical method.
A. Data and Variables
We employ the offshoring data set by Hoberg and Moon (Reference Hoberg and Moon2017), (Reference Hoberg and Moon2019) for the main outcome variable. The authors develop text-based offshoring variables by parsing through firms’ SEC EDGAR (10-K) filings. They create two vocabulary dictionaries: the first identifies firms’ footprint in foreign countries (based on country names); the second contains a set of neighbor words closely linked with offshoring activities that co-exist with the countries’ words. The offshoring variables created from this process capture the raw counts of how often firms mention having offshoring activities in each country-year pair from 1997 to 2017.
There are four variables capturing different offshoring activities: Output (which refers to sales in foreign countries), external input (which refers to the outsourcing of inputs from suppliers in foreign countries), internal input (which refers to the production of inputs within the firm in foreign countries), and overall input (capturing both external and internal inputs).
Given that our primary interest is to study how domestic product market competition affects foreign market expansion (sales), we focus our analysis on the output offshoring variable. For instance, words such as Sell, Sales, Revenues, Markets, Consumers, Store, Export, and Distribute are all considered as words associated with output offshoring activities. The rich vocabulary describing firms’ output offshoring activities captures more elaborate means of expanding into foreign markets rather than simply via exports (which is just one word out of many in the vocabulary). Hence, we interpret output offshore as a more encompassing measure of firms’ presence and expansion into foreign markets. The logic behind this choice is that competitive pressure in firms’ home product market should affect their sales strategy and, hence, whether and how to offshore their output to foreign markets. Thus, we measure output offshoring (OUTPUT_OFFSHORE) as the aggregate raw counts of how often firms mention offshoring output in any given year. In additional tests, we also analyze how competition relates to input offshoring (INPUT_OFFSHORE) to get a more comprehensive understanding of how competitive pressure affects firms’ overall foreign activities.
To measure product market competition, we employ the text-based Herfindahl–Hirschman Index (TNIC_HHI) developed by Hoberg and Phillips (Reference Hoberg and Phillips2016). The HHI index measures industry sales concentration on a scale from 0 to 1. The HHI index is an inverse measure of competition, with higher values implying a higher concentration of sales within the industry, and thus weaker product market competition. The TNIC_HHI measure of competition has advantages compared to other typical measures (such as the HHI ratio based on SIC codes, for instance) because the text-based network industry classification (TNIC) allows firms to shift across industries depending on the similarity of their product vocabularies with respect to their competitors. Hence, TNIC_HHI displays within-firm variation, allowing for a cleaner identification of competition.
We perform several sensitivity checks on the measurement of both competition and OUTPUT_OFFSHORE. As alternative measures of competition, we use the product market fluidity variable developed by Hoberg et al. (Reference Hoberg, Phillips and Prabhala2014), which is a text-based variable that captures product market threats; the product similarity variable developed by Hoberg and Phillips (Reference Hoberg and Phillips2016), which captures competitive pressure firms face from close substitutes; and the number of firms in 3-digit SIC industries (e.g., Morellec and Zhdanov (Reference Morellec and Zhdanov2019)). Regarding foreign sales, we also measure it as a dummy variable equal to 1 if firms mention offshoring output, and equal to 0 otherwise.
We further merge the data set with Compustat and construct control variables. In our main specifications, we control for well-known structural drivers of internationalization, namely firm size (natural log of market value of equity) and maturity (natural log of firm age). Nevertheless, we also conduct robustness tests with additional controls to absorb greater variance (see Section VI). We define this extended vector of controls following Hoberg and Moon (Reference Hoberg and Moon2019), including growth opportunities (TOBIN’S_Q), OPERATING_PROFITABILITY (operating income before depreciation divided by total assets), LEVERAGE (long-term plus short-term debt divided by total assets), a dummy for dividend payers, CASH_HOLDINGS (cash and equivalents divided by total assets), TANGIBILITY (gross property, plant and equipment divided by total assets), INVESTMENT (capital expenditures divided by sales), R&D_ASSETS (R&D divided by total assets), ORGANIZATIONAL_CAPITAL (following the perpetual inventory method by Eisfeldt and Papanikolaou (Reference Eisfeldt and Papanikolaou2013)), and capital-labor intensity (the natural log of gross property, plant and equipment divided by the total number of employees). After excluding firms from the financial and utilities sectors, our main data set contains 5,759 firms and 53,732 firm-year observations. All variables are defined in the Appendix.
Table 1 shows descriptive statistics for the sample. The mean value of OUTPUT_OFFSHORE (C) is 19.9, meaning that on average, the raw count of output offshore mentions is roughly 20. Hence, the average firm in the sample mentions offshoring output 20 times per year. The mean value of OUTPUT_OFFSHORE (D) is 0.844, indicating that most firms (84%) in the sample engage in foreign sales activity. The mean value of the TNIC_HHI variable is 0.319, indicating an industry sales concentration ratio of about 32%. The descriptive statistics of the remaining variables are similar to those in related studies (see, e.g., Hoberg and Moon (Reference Hoberg and Moon2019), Loncan (Reference Loncan2023)).

TABLE 1 Long description
The table contains 36 rows of variables with columns for Mean, Std. Dev., P 25, P 50, P 75, and No. of Obs. Most variables have 53,732 observations. Key data points include:
* O U T P U T underscore O F F S H O R E (C): Mean 19.972, Std. Dev. 27.730.
* O U T P U T underscore O F F S H O R E (D): Mean 0.844, Std. Dev. 0.363.
* T N I C underscore H H I: Mean 0.319, Std. Dev. 0.283.
* L n (M E): Mean 5.883, Std. Dev. 2.163.
* T O B I N’ S underscore Q: Mean 2.187, Std. Dev. 2.546.
* O P E R A T I N G underscore P R O F I T A B I L I T Y: Mean 0.051, Std. Dev. 0.301.
* L E V E R A G E: Mean 0.216, Std. Dev. 0.252.
* C A S H underscore H O L D I N G S: Mean 0.201, Std. Dev. 0.214.
* T A N G I B I L I T Y: Mean 0.489, Std. Dev. 0.393.
* R and D underscore A S S E T S: Mean 0.056, Std. Dev. 0.111.
* I N P U T underscore O F F S H O R E (C): Mean 19.615, Std. Dev. 30.868.
* F L U I D I T Y: Mean 6.313, Std. Dev. 3.123 (53,310 observations).
* C O M P E T I T O R S (N): Mean 156.931, Std. Dev. 220.499.
* N E T underscore P R O F I T A B I L I T Y: Mean minus 0.055, Std. Dev. 0.422.
* P A T E N T underscore S T O C K: Mean 156.111, Std. Dev. 1337.054.
* B R A N D underscore C A P I T A L: Mean 0.097, Std. Dev. 0.167 (21,853 observations).
* L n (A S S E T S): Mean 5.854, Std. Dev. 2.074.
* L n (E M P L O Y M E N T): Mean 0.300, Std. Dev. 2.066.
* I D D R: Mean 0.363, Std. Dev. 0.481.
* L n (G D P) (State): Mean 13.305, Std. Dev. 0.873 (52,256 observations).
B. Empirical Model
We aim at explaining firms’ output offshoring activity with domestic market competition. We therefore regress the output offshoring variable on TNIC HHI as a measure of competition, control variables, and fixed effects. The baseline regression model is as followsFootnote 4:

The dependent variable, OUTPUT_OFFSHORE
$ {}_{it}^C $
 , is the raw counts of how often firms mention offshoring output. Since our dependent variable is a count-based outcome, we follow the recent developments in the empirical literature and estimate the model via Poisson fixed-effects regressions. As noted by Cohn, Liu, and Wardlaw (Reference Cohn, Liu and Wardlaw2022), the Poisson model produces consistent and reasonably efficient estimates that are compliant with more general assumptions.
The main explanatory variable is the TNIC_HHI sales concentration ratio.
$ {X}_{it-1} $
 is the vector of control variables that includes firm size and age. We account for firm and time unobserved heterogeneity by including firm (
$ {\alpha}_i $
 ) and year (
$ {\alpha}_t $
 ) fixed effects. We also estimate models absorbing time-varying industry and regional shocks by including industry × year, state × year, or industry × state × year fixed effects. TNIC_HHI and all explanatory variables are lagged by 1 year. Standard errors are clustered by firm. The coefficient of interest is
$ \beta $
 . A negative coefficient is consistent with the salubrious competition hypothesis, whereas a positive coefficient supports the national champions hypothesis.
IV. Results
This section presents the main results. It also demonstrates that the main findings are robust to using alternative measures for competition. Moreover, we address potential endogeneity concerns regarding competition and show that the results are robust to state-level policy changes that affect firms’ exposure to competitive pressure.
A. Main Results
The main findings are reported in Table 2. Column 1 reports the estimates from our baseline specification that includes firm and year fixed effects but no control variables. The result shows a statistically significant and negative association between OUTPUT_OFFSHORE and TNIC_HHI. Given that TNIC_HHI captures industry concentration (being an inverse measure of competition), this result indicates that higher concentration (competition) is significantly and negatively (positively) associated with foreign sales activity. In columns 2 and 3, we include firm size and age as control variables and continue to observe a significantly negative coefficient. These results support the salubrious competition hypothesis, which predicts that stiffer domestic product market competition is positively associated with firms’ foreign market expansion.

TABLE 2 Long description
The table presents results from six Poisson regression models where the dependent variable is O U T P U T underscore O F F S H O R E (C).
* Column headers are numbered 1 through 6.
* T N I C underscore H H I: Shows a consistent negative coefficient across all models, ranging from -0.195 to -0.216, all significant at the 0.01 level. Standard errors are approximately 0.034 to 0.051.
* Ln(M E): Shows a positive coefficient from 0.048 to 0.056, significant at the 0.01 level (not included in model 1).
* Ln(A G E): Shows a negative coefficient from -0.073 to -0.095, significant at the 0.05 or 0.10 levels (not included in models 1 and 2).
* Fixed Effects (F E): All models include Firm F E. Models 1, 2, and 3 include Year F E. Model 4 includes Industry times Year F E. Model 5 includes State times Year F E. Model 6 includes Industry times State times Year F E.
* Observations (N): Ranges from 53,732 in models 1-3 down to 33,480 in model 6.
* Pseudo R-squared: Ranges from 0.698 to 0.735.
The Poisson model is nonlinear; hence, the coefficient estimates do not directly measure the magnitude (size) of the economic effects. To understand the economic impacts of concentration (competition) on OUTPUT_OFFSHORE, we compute the marginal effect (dydx) associated with the estimated coefficient. The marginal effect of the coefficient of TNIC_HHI reported in column 3 (−0.195) is equal to −3.90. This estimate implies that a one-unit increase in TNIC_HHI is associated with a decrease of 3.90 in the output offshore count. Relative to the mean OUTPUT_OFFSHORE of 19.9 counts, this represents an approximately 19.6% decrease in counts. This change is economically important.
We estimate additional specifications to minimize concerns that the results are driven by industry-wide or regional time-varying unobserved effects. For example, there could be industry-specific economic shocks (e.g., demand shocks) that affect both domestic competition and offshoring decisions. Similarly, there could be regional economic shocks that affect offshoring (e.g., local productivity shocks). To deal with these sources of time-varying confounding effects, we replace the year fixed effects with industry × year fixed effects in column 4, state × year fixed effects in column 5, and industry × state × year fixed effects in column 6. These fixed effects absorb any time-varying shocks at industry, state, or industry-state (e.g., regional industry shocks) levels and hence cleanse our estimates of unobserved factors that change over time and could affect firms’ decisions to sell their products and services abroad. The results reported in columns 4, 5, and 6 continue to show that, despite controlling for industry and state-level shocks, TNIC_HHI has a significantly negative association with OUTPUT_OFFSHORE, with coefficient estimates of similar size.
The coefficients of the control variables are as expected. Consistent with Hoberg and Moon (Reference Hoberg and Moon2019), we find a significantly positive association between firm size and output offshoring, in line with the established view that larger firms are more likely to operate multinationally (see, e.g., Tomiura (Reference Tomiura2007)). The coefficient for firm age is also consistent with Hoberg and Moon (Reference Hoberg and Moon2019), as we find a significantly negative association between age and foreign sales. This finding resonates with studies suggesting a nuanced view of the role of maturity in firms’ internationalization (e.g., see Carr, Haggard, Hmieleski, and Zahra (Reference Carr, Haggard, Hmieleski and Zahra2010)).
A potential concern with our analysis so far is that competition is endogenous. First, a firm’s product market (structure) and its position in that market can be affected by its past offshoring decisions, raising the concern of reverse causality. Second, unobserved (time-varying) variables could be driving both the firm’s product market choices and offshoring decisions. In the following, we propose multiple tests to deal with these endogeneity concerns. First, we use alternative measures of competition, such as product market fluidity, product similarity, and the number of competitors to mitigate measurement issues. Second, we estimate models exploiting state-level policy changes that plausibly affect firms’ exposure to competition. Third, we employ an instrumental variable approach. Finally, we estimate models lagging TNIC HHI by several years to mitigate reverse causality, and execute further robustness checks regarding estimation methods and the measurement of output offshoring.
B. Alternative Measures for Competition
To mitigate endogeneity concerns that stem from measurement issues, we present in Table 3 additional versions of the baseline model with alternative measures for competition.

TABLE 3 Long description
A table with four columns labeled 1 through 4. The dependent variable for all columns is O U T P U T underscore O F F S H O R E (C).
Independent Variables:
* C O M P E T I T I V E underscore I N D U S T R I E S (D): Column 1 shows 0.079 with three asterisks and a standard error of 0.015.
* F L U I D I T Y: Column 2 shows 0.039 with three asterisks and a standard error of 0.004.
* P R O D U C T underscore S I M I L A R I T Y: Column 3 shows 0.012 with three asterisks and a standard error of 0.003.
* C O M P E T I T O R S (N): Column 4 shows 0.001 with three asterisks and a standard error of 0.000.
Fixed Effects and Controls:
* Controls: Yes for all columns.
* Firm F E: Yes for all columns.
* Year F E: Yes for all columns.
Summary Statistics:
* N (Sample Size): 53,732 (Col 1), 53,303 (Col 2), 53,732 (Col 3), 53,267 (Col 4).
* Pseudo R super 2: 0.699 (Col 1), 0.700 (Col 2), 0.699 (Col 3), 0.699 (Col 4).
Note: Three asterisks denote statistical significance at the 0.01 level.
First, we use a discrete (categorical) version of the TNIC_HHI variable to identify industries where concentration (competition) is high. We calculate the variable COMPETITIVE_INDUSTRIES, which is equal to 1 for firms in industries where the HHI sales concentration index is below the median (more competitive), and 0 if it is above the median (more concentrated). The result in column 1 shows a positive association between OUTPUT_OFFSHORE and the dummy variable for competitive industries, suggesting that firms are more (less) likely to sell output abroad when they operate within more competitive (concentrated) industries. The marginal effect associated with the estimated coefficient of 0.079 is equal to 1.57. This estimate implies that offshore counts are 1.57 higher for a representative firm operating in a competitive industry (below the median in the distribution of TNIC_HHI) when compared to a representative firm operating in a concentrated industry (above the median). Relative to the average (median) of output offshore of 19.9 (10), this represents an approximately 7.9% (15.7%) increase in counts for firms in more competitive industries versus concentrated industries.
In column 2, we use product market fluidity (FLUIDITY) as a measure of domestic competition. FLUIDITY captures product market threats and is positively associated with domestic competition. We find a significantly positive association between FLUIDITY and OUTPUT_OFFSHORE. In column 3, we use the product similarity variable to measure competition. PRODUCT_SIMILARITY is a measure that captures the intensity of rivalry from close substitutes and is positively linked with stiffer competition. We find a significantly positive association between PRODUCT_SIMILARITY and OUTPUT_OFFSHORE. Finally, in column 4, we measure competition as the number of rivals operating within the same 3-digit SIC industry. We find a significantly positive association between the number of firms operating within firms’ industries (hence, stronger competition) and OUTPUT_OFFSHORE.Footnote 5
C. Foreign Expansion and Competitive Effects of Labor Mobility
In this section, we explore policy-induced variation in firms’ competitive environment arising from changes in labor market regulation. Specifically, we explore the relaxation of labor mobility restrictions as a regulatory shock to product market competition.
Policies lifting labor mobility restrictions provide plausibly exogenous variation to competition because such impediments to the free flow of labor condition the allocation of human capital across firms and within industries. When labor mobility is restricted (for instance, by non-compete contractual clauses), incumbent firms are better able to retain workers, giving leading firms an edge over rivals as their labor market power increases, thus inflating hiring costs for followers and potential entrants. This asymmetry in labor market power brought about by labor mobility restrictions raises effective barriers to entry and shifts product market power to established firms, leading to industry consolidation and concentration (see, e.g., Marx and Fleming (Reference Marx and Fleming2012), Posner (Reference Posner2020), Kang and Fleming (Reference Kang and Fleming2020), and Starr (Reference Starr2026)).
As such, policies that relax labor mobility restrictions have pro-competitive effects and limit industry consolidation. Building on this notion, we explore the staggered state-level rejection of the IDD as a labor mobility-induced shock to competition (see, e.g., Na (Reference Na2020)). IDD recognition empowers state courts to enjoin former employees from working for competitors, since workers changing jobs bring alongside proprietary knowledge that inevitably discloses the former employer’s trade secrets. Thus, IDD recognition restricts labor mobility, whereas its rejection produces opposite effects, lifting impediments to the free flow of labor and hence stimulating competition. Therefore, we explore the rejection of IDD (IDDR) as a labor mobility policy shock that propagates to output offshoring through its pro-competitive effects.
An important issue to consider is that IDD rejections can affect firms through several margins. By limiting firms’ ability to prevent employees from joining competitors, IDD rejections can intensify competition directly through worker reallocation and rival poaching. At the same time, because skilled workers have firm-specific knowledge, greater labor mobility can also make proprietary information more portable across firms. We therefore interpret IDD rejection not as a narrow shock to product market competition only, but as a labor mobility shock that increases competitive pressure through both labor reallocation and potential knowledge diffusion. This interpretation is consistent with a view in which differentiation becomes relevant for firms in a competitive setting. Specifically, when knowledge becomes more mobile through movements of labor, firms’ ability to preserve rents increasingly depends on product differentiation, innovation, brand capital, and organizational capabilities. This labor mobility interpretation also guides our later cross-sectional tests. If IDD rejections make workers and knowledge more mobile across firms, then firms’ ability to respond through foreign expansion should depend especially on their intangible, organizational, and brand capital.
Following Na (Reference Na2020), we set as treated firms those headquartered in states rejecting the Inevitable Disclosure Doctrine (IDDR indicator variable equal to 1), starting in the year of the first court decision explicitly repudiating the doctrine. Such rejections occurred in 16 states between 1999 and 2014: Virginia (1999), Florida (2001), California (2002), Michigan (2002), Texas (2003), Maryland (2004), Ohio (2008), New York (2009), Arkansas (2009), Wisconsin (2009), New Hampshire (2010), Massachusetts (2012), New Jersey (2012), Washington (2012), Georgia (2013), and North Carolina (2014). All other states did not experience a documented rejection of the IDD. Thus, firms headquartered in such states form the control group in our sample (IDDR indicator variable equal to 0).
Following the recent literature (see, e.g., Baker, Larcker, and Wang (Reference Baker, Larcker and Wang2022)), we estimate a staggered DiD model using the regression adjustment method by Callaway and Sant’Anna (Reference Callaway and Sant’Anna2021), which allows for heterogeneous treatment effects:

In equation (2), we regress the OUTPUT_OFFSHORE
$ {}_{it}^C $
 variable against the IDDR indicator variable, lagged firm size and age, and firm and year fixed effects. In addition, we control for lagged state GDP to account for structural state economic characteristics. Table 4 presents the results.

TABLE 4 Long description
The table is divided into two sections.
Panel A, titled DiD A T E T, shows the overall effect of I D D R. The coefficient is 2.316 with a standard error of 0.929, significant at the 0.05 level.
Panel B, titled Dynamic Effects, lists coefficients by Event Time relative to the treatment year t equals 0.
* Event Time minus 5: 0.064 (0.704)
* Event Time minus 4: minus 0.135 (0.284)
* Event Time minus 3: 0.176 (0.306)
* Event Time minus 2: minus 0.044 (0.471)
* Event Time minus 1: 0.667 (0.411)
* Event Time t equals 0: 1.033 (0.412), significant at the 0.05 level
* Event Time plus 1: 1.118 (0.681)
* Event Time plus 2: 1.908 (0.805), significant at the 0.05 level
* Event Time plus 3: 2.136 (0.936), significant at the 0.05 level
* Event Time plus 4: 1.265 (1.041)
* Event Time plus 5: 1.876 (1.199)
Both panels include Firm F E, Year F E, and Controls. The total number of observations for both models is 47,033.
Panel A reports the overall average treatment effect on the treated (ATET), whereas Panel B shows dynamic effects. In Panel A, we find a significantly positive coefficient of 2.32 on IDDR, suggesting that firms operating in treated states increase output offshoring significantly compared to firms operating in control states after the IDD is rejected. Economically, the coefficient suggests that output offshore counts increase by about 11.6% relative to the sample mean (19.9). Panel B shows the dynamic treatment effects, and Figure 1 plots the coefficient estimates to facilitate visual inspection. The coefficient estimates are all insignificant prior to the treatment and become statistically significant only after the IDD is rejected, supporting the parallel trends assumption. Also important, the sizes of the coefficient estimates increase up to 3 years after the treatment and stabilize thereafter. This finding indicates that exposed firms adjust foreign sales activity as a response to the labor mobility shock and is consistent with such effects operating via a gradually increasing degree of competition.
Figure 1 plots the dynamic average treatment effects (ATETs) of IDD rejections on OUTPUT_OFFSHORE. 95% confidence intervals (whiskers) are shown for every point estimate.

FIGURE 1 Long description
The horizontal X-axis is labeled Event Time (Years Relative to I D D Rejection) and ranges from minus 5 to 5. The vertical Y-axis is labeled A T E T on Output underscore Offshore and ranges from minus 2 to 6. A horizontal dashed line is at Y equals 0 and a vertical dotted line is at X equals 0.
Data points from year minus 5 to minus 1 are hollow circles, representing the pre-period. These points are clustered near the zero line with whiskers crossing the zero line, indicating no significant pre-trend.
At year 0, the point is a solid dark circle positioned at approximately 1.
From years 1 to 5, the points are solid grey circles representing the post-period.
* Year 1 is at approximately 1.1.
* Year 2 is at approximately 1.9.
* Year 3 is at approximately 2.1.
* Year 4 is at approximately 1.3.
* Year 5 is at approximately 1.9.
All post-period points from year 0 to 3 have 95 percent confidence interval whiskers that remain entirely above the zero line, suggesting a statistically significant increase in output offshoring following an I D D rejection. Whiskers for years 4 and 5 are wider and cross the zero line.
We conduct an additional test to show that the effect of labor mobility on output offshoring is strongest where product market competition is initially weaker, consistent with the view that labor mobility relaxes frictions that protect incumbents and thereby intensifies competitive pressure. To do so, we employ the LMI proposed by Bai et al. (Reference Bai, Eldemire and Serfling2024) as an empirical proxy for the degree of state-level labor mobility. The LMI is measured on an increasing basis (higher values of the index indicating higher labor mobility) and is constructed using the number of non-compete clauses prevailing in each state (thus being an inverse measure of labor mobility restrictions). In this test, we estimate regressions of output offshore on the LMI, industry concentration measured as a dummy (equal to 1 if TNIC HHI is above the median, and 0 otherwise), and an interaction term between LMI and industry concentration. Table 5 reports the results.

TABLE 5 Long description
The table consists of three columns representing different regression models.
* Column 1 (O L S): L M I coefficient is 1.257 with a standard error of 0.373, significant at the 0.01 level.
* Column 2 (O L S): L M I coefficient is 1.174 (0.382 standard error, 0.01 significance). Concentrated Industries (D) is -3.200 (0.802 standard error, 0.01 significance). The interaction term L M I times Concentrated Industries (D) is 0.176 (0.078 standard error, 0.05 significance).
* Column 3 (Poisson): L M I coefficient is 0.036 (0.024 standard error). Concentrated Industries (D) is -0.142 (0.041 standard error, 0.01 significance). The interaction term L M I times Concentrated Industries (D) is 0.008 (0.004 standard error, 0.05 significance).
All models include Controls, Firm F E, and Year F E. Sample size N is 51,820 for O L S models and 51,798 for the Poisson model. R-squared is 0.736 for O L S models, and Pseudo R-squared is 0.693 for the Poisson model.
In column 1, we report the results of a regression in which OUTPUT_OFFSHORE is regressed against the LMI. We find a significantly positive coefficient on LMI, suggesting that higher state-level labor mobility is associated with greater foreign sales activity. This result is consistent with our previous findings from the staggered rejection of the IDD. Columns 2 (OLS) and 3 (Poisson) condition this relation on the degree of industry concentration. We find a significantly positive coefficient on the interaction term between the LMI and the dummy for concentrated industries, alongside a significantly negative coefficient on concentration. These findings indicate that firms operating in concentrated industries offshore output less when labor mobility is low. However, as labor mobility increases, foreign sales activity increases relatively more among firms in concentrated industries.
Overall, these findings suggest that labor mobility operates as a pro-competitive force. The LMI marginally reverses the negative effect of concentration on output offshoring, indicating that labor mobility affects foreign sales especially where incumbent firms are initially more insulated from competition. A plausible channel is that higher labor mobility eases restrictions on labor flows, reduces incumbents’ ability to retain workers, and increases the transfer of knowledge across firms. In this sense, the IDD setting captures a labor mobility shock that intensifies competitive pressure.
V. Heterogeneity and Economic Channels
So far, we have uncovered a robust effect of competition on foreign sales expansion, consistent with the salubrious competition hypothesis. Next, we examine plausible economic channels that can explain this effect using the IDD setting, where the shock operates not only by increasing rivalry for workers, but also by making knowledge more transferable across firms. We therefore analyze whether the response to IDD rejections depends on firm characteristics that capture firms’ ability to preserve differentiation, finance foreign expansion, and exploit opportunities abroad. We discuss and theoretically motivate the characteristics in the following subsections. To empirically test for these economic channels, we re-estimate the DiD models for samples split at the yearly sample median (high if above the median, low if below) based on firm characteristics measured prior to the IDD rejection shock.Footnote 6
A. Intangible and Organizational Capabilities
The interpretation of IDD rejections as a labor mobility shock highlights the role of intangible and organizational capital. If greater labor mobility intensifies competition partly by making knowledge more transferable across firms, then firms’ responses to such shocks should depend on their ability to preserve rents through differentiation. Firms with stronger technological knowledge, organizational capital, and brand capital are better positioned to differentiate their products, commercialize innovations, and manage expansion across markets. Moreover, the literature on firm internationalization also highlights that firms with stronger intangible resources and organizational capabilities are more likely to expand abroad (Grubaugh (Reference Grubaugh1987), Morck and Yeung (Reference Morck and Yeung1992)).
We use three proxies for firms’ intangible and organizational capabilities. First, innovation and product quality shape the relation between domestic competition and foreign expansion. Existing research shows that multinational firms have high innovation capabilities (Markusen (Reference Markusen1995)), that knowledge assets are a core source of ownership advantage that enables successful internationalization (Dunning (Reference Dunning1980)), and that investments in innovation are positively associated with export sales (McGuinness and Little (Reference McGuinness and Little1981), Kogut and Chang (Reference Kogut and Chang1991), Ito and Pucik (Reference Ito and Pucik1993), and Salomon and Shaver (Reference Salomon and Shaver2005)). Moreover, domestic competition affects firms’ incentives to innovate and to improve product quality (e.g., Aghion, Bloom, Blundell, Griffith, and Howitt (Reference Aghion, Bloom, Blundell, Griffith and Howitt2005)). Therefore, we expect that firms with higher innovation capabilities will be able to sell more products and services abroad when faced with more intense domestic competition. To measure innovation capability, we use data on patent counts (Bena, Ferreira, Matos, and Pires (Reference Bena, Ferreira, Matos and Pires2017), Barkemeyer, Bena, and Li (Reference Barkemeyer, Bena and Li2026)) to construct a measure of the cumulative stock of patents (PATENT_STOCK). Patent stock is well-suited in the IDD setting because it captures accumulated technological knowledge that may help firms maintain differentiation when worker mobility increases the diffusion of know-how across domestic rivals.
Second, we use organizational capital as a measure of intangible capital that is embodied in the firm’s key employees (e.g., Eisfeldt and Papanikolaou (Reference Eisfeldt and Papanikolaou2013)). Existing research shows that organizational capital enables firms to access foreign markets. For example, the model by Yeaple (Reference Yeaple2023) shows that firms are heterogeneous in their ability to accumulate and deploy organizational capital abroad. Firms with greater organizational capital have an absolute advantage because they are able to support larger global operations across a wider product mix. Consistent with this, Yeaple (Reference Yeaple2023) provides evidence that firms with greater organizational capital have higher exports and foreign sales. Organizational capital may also help firms deploy knowledge and routines across markets when domestic competition intensifies, making it easier to respond to competitive pressure through foreign expansion. As such, we expect that firms with greater organizational capital are better able to respond to domestic competitive shocks by expanding abroad. We measure ORGANIZATIONAL_CAPITAL following Eisfeldt and Papanikolaou (Reference Eisfeldt and Papanikolaou2013) and construct the stock of organization capital using the perpetual inventory method.Footnote 7
Third, we use brand capital as another measure of intangible capital. Firms that are better able to internalize marketing capabilities, consumer goodwill and leverage such capabilities, are more likely to expand into foreign markets and succeed abroad (Grubaugh (Reference Grubaugh1987), Morck and Yeung (Reference Morck and Yeung1992), and Salomon and Jin (Reference Salomon and Jin2010)). Moreover, from the perspective of differentiation, brand capital is relevant because it allows firms to preserve customer loyalty and product distinctiveness even when competition and knowledge diffusion increase. Therefore, we expect that firms with strong brand capital will respond to domestic competitive shocks by offshoring output more compared to firms with weak brand capital. We measure BRAND_CAPITAL as the ratio of 3-year cumulative advertising expenses to total assets.
Each year, we split the sample at the median of the three measures of intangible and organizational capabilities and allocate firms into the high or low subsample. Next, we separately estimate for each subsample the DiD model, where the IDD rejection indicator is the explanatory variable and output offshore is the dependent variable. Table 6 presents the results.

TABLE 6 Long description
The table presents difference-in-differences regression results for the variable I D D R across six columns divided into three categories: PATENT_STOCK (Columns 1 and 2), O R G_CAPITAL (Columns 3 and 4), and BRAND_CAPITAL (Columns 5 and 6). Each category is split into High (H) and Low (L) sub-samples.
* Row 1: I D D R coefficients.
- PATENT_STOCK: H = 3.882 (significant at 0.01 level); L = 0.283.
- O R G_CAPITAL: H = 4.801 (significant at 0.01 level); L = minus 1.032.
- BRAND_CAPITAL: H = 9.809 (significant at 0.01 level); L = minus 5.565.
* Row 2: Standard errors in parentheses.
- PATENT_STOCK: H = (1.380); L = (1.312).
- O R G_CAPITAL: H = (1.210); L = (1.107).
- BRAND_CAPITAL: H = (2.080); L = (4.562).
* Row 3: Difference H minus L (p-value).
- PATENT_STOCK: 0.166.
- O R G_CAPITAL: 0.013.
- BRAND_CAPITAL: 0.008.
* Row 4-6: Controls, Firm F E, and Year F E are all marked ‘Yes’ for all columns.
* Row 7: Observations (N).
- PATENT_STOCK: H = 20,751; L = 25,386.
- O R G_CAPITAL: H = 22,604; L = 22,602.
- BRAND_CAPITAL: H = 8,664; L = 8,012.
Columns 1 and 2 in Table 6 report the results for the stock of patents. We find a significantly positive effect of IDD rejections for firms with a larger patent stock (coefficient estimate of 3.882), and an insignificant effect for firms with a smaller stock of patents (coefficient estimate of 0.283), although the difference in the effects across the high and low subsamples is not statistically significant (p-value = 0.166). This finding provides suggestive evidence that firms possessing intangible technological advantages respond more strongly to IDD rejections by expanding abroad.
Columns 3 and 4 show the results for organizational capital. Consistent with the results for patent stock, we find a significantly positive effect of IDD rejections for firms with greater organizational capital (coefficient estimate of 4.801), and an insignificant effect for firms with weaker organizational capital (coefficient estimate of −1.032). The difference between the two estimated coefficients is statistically significant (p-value = 0.013), providing evidence that organizational capital strengthens firms’ ability to respond to labor mobility-induced competitive shocks through foreign expansion. Lastly, columns 5 and 6 report the results for brand capital. We find a significantly positive effect of IDD rejections for firms with high advertising intensity (coefficient estimate of 9.809), and an insignificant effect for firms with low intensity (coefficient estimate of −5.565). The difference in the two estimates is statistically significant (p-value = 0.008), suggesting that firms with stronger brand capital are in a better position to respond to IDD rejections through foreign expansion.Footnote 8
In sum, these findings suggest that firms with stronger intangible and organizational capabilities are better able to respond to labor mobility-induced competitive pressure by expanding abroad. The strongest responses are observed for organizational and brand capital, for which the effect of IDD rejections differs significantly between the high and low subsamples, while the evidence for patent stocks is more suggestive. Thus, the findings support the interpretation that when employee mobility increases and knowledge becomes more transferable across firms, firms with stronger organizational and brand capital are better positioned to preserve differentiation, redeploy knowledge, and compete in foreign markets.
B. Profitability
Firms need to be sufficiently profitable to overcome the fixed costs of expanding abroad and realizing foreign sales. Indeed, a key finding in the international economics literature is that more productive firms self-select into international activities (see, e.g., Melitz and Redding (Reference Melitz, Redding, Gopinath, Helpman and Rogof2014)). For example, Van den Berg, van Marrewijk, and Tamminen (Reference Van den Berg, van Marrewijk and Tamminen2018) show that firms with higher productivity have higher profit margins and are more likely to export. Bellone, Musso, Nesta, and Schiavo (Reference Bellone, Musso, Nesta and Schiavo2010) show that firms enjoying better financial health are more likely to become exporters, whereas Greenaway, Guariglia, and Kneller (Reference Greenaway, Guariglia and Kneller2007) find a positive relation between financial health and exporting that is concentrated in continuous exporters rather than in starters. Buch, Kesternich, Lipponer, and Schnitzer (Reference Buch, Kesternich, Lipponer and Schnitzer2014) further highlight that financing constraints limit firms’ ability to expand abroad.
As such, we hypothesize that financial capabilities in the form of sufficiently high profits are important drivers of foreign expansion under competitive pressure. Since domestic competition creates winners and losers, only firms that are sufficiently profitable and in good financial health will be able to expand abroad. Therefore, we expect that firms with higher profitability are more likely to respond to domestic competitive shocks by expanding abroad. To measure profitability, we employ three complementary measures to ensure robustness: NET_PROFITABILITY (net income divided by total assets), OPERATING_PROFITABILITY (operating income divided by total assets), and GROSS_PROFITABILITY (gross profit divided by total assets). As before, we split the sample at the yearly median and estimate separate DiD models for firms with high and low profitability. Table 7 reports the results.

TABLE 7 Long description
A data table with six columns of regression results. The primary independent variable is I D D R.
Columns 1 and 2: N E T underscore P R O F.
* Column 1 (High): I D D R coefficient is 3.664 with three asterisks, standard error 1.374. N is 23,300.
* Column 2 (Low): I D D R coefficient is minus 0.357, standard error 1.409. N is 21,571.
* Difference H minus L p-value is 0.171.
Columns 3 and 4: O P E R A T I N G underscore P R O F.
* Column 3 (High): I D D R coefficient is 4.352 with three asterisks, standard error 1.269. N is 23,306.
* Column 4 (Low): I D D R coefficient is minus 0.765, standard error 1.723. N is 21,627.
* Difference H minus L p-value is 0.089.
Columns 5 and 6: G R O S S underscore P R O F.
* Column 5 (High): I D D R coefficient is 5.605 with three asterisks, standard error 1.821. N is 22,824.
* Column 6 (Low): I D D R coefficient is minus 1.756, standard error 1.075. N is 22,477.
* Difference H minus L p-value is 0.046.
All columns include Controls, Firm F E, and Year F E marked as Yes.
Columns 1 and 2 show the results for samples split based on net profitability. We find a significantly positive effect of IDD rejections for firms with high profitability (coefficient estimate of 3.664), and an insignificant effect for firms with low net profitability (coefficient estimate of −0.357). We find similar results in columns 3 and 4 (operating profitability) and 5 and 6 (gross profitability). These results indicate that more profitable firms are better able to afford the investments required to support foreign expansion when exposed to IDD rejection shocks. Moreover, the comparisons between the high and low subsamples provide additional support for this interpretation. While the difference in the estimated effects is not statistically significant for net profitability (p-value = 0.171), we observe significant differences for operating profitability (p-value = 0.089) and gross profitability (p-value = 0.046). Overall, these results suggest that firms with stronger profitability are better able to absorb the fixed costs of foreign expansion when exposed to labor mobility shocks that intensify domestic competitive pressure.
C. Growth Capabilities
Firms’ ability and willingness to offshore output also depend on growth opportunities. Specifically, firms with high growth opportunities and little domestic competition may not need to expand abroad, while growth firms in more competitive domestic markets will seek to offshore output to capture growth in foreign markets. Existing empirical evidence supports the view that growth opportunities are positively correlated with foreign expansion. For example, Loncan (Reference Loncan2023) finds that under high domestic competitive pressure, firms with stronger growth opportunities are more likely to conduct greenfield FDI. Similarly, Bodnar and Weintrop (Reference Bodnar and Weintrop1997) find that growth opportunities are associated with stronger foreign sales performance. Furthermore, Doukas (Reference Doukas1995) shows that the returns to cross-border acquisitions are higher for firms with stronger growth opportunities.
Hence, we expect that firms with stronger growth opportunities will offshore output more when faced with more intense domestic competition. We measure growth opportunities in several ways. We use TOBIN’S_Q, SALES_GROWTH (growth rate of total sales), and ASSET_GROWTH (growth rate of total assets). Table 8 presents the results of the DiD models estimated for split samples based on these measures of growth capabilities.

TABLE 8 Long description
The table presents difference-in-differences regression results for the variable I D D R across six columns.
Column headers from left to right are: Variables, Tobin’s Q (Columns 1 and 2), Sales Growth (Columns 3 and 4), and Asset Growth (Columns 5 and 6). Each growth category is split into H (High) and L (Low) subsamples.
Row 1: I D D R coefficients.
- Tobin’s Q: Column 1 (H) is 3.356 with one asterisk; Column 2 (L) is 0.061.
- Sales Growth: Column 3 (H) is 3.031 with one asterisk; Column 4 (L) is 1.109.
- Asset Growth: Column 5 (H) is 3.593 with one asterisk; Column 6 (L) is 0.043.
Row 2: Standard errors in parentheses.
- Tobin’s Q: (1.873) for H; (1.049) for L.
- Sales Growth: (1.682) for H; (0.827) for L.
- Asset Growth: (2.138) for H; (1.110) for L.
Row 3: Difference H minus L (p-value).
- Tobin’s Q: 0.344.
- Sales Growth: 0.423.
- Asset Growth: 0.263.
Rows 4-6: Controls, Firm F E, and Year F E are all marked ‘Yes’ for all columns.
Row 7: N (Sample size).
- Tobin’s Q: 22,395 (H); 22,350 (L).
- Sales Growth: 22,175 (H); 22,301 (L).
- Asset Growth: 22,422 (H); 22,346 (L).
Columns 1 and 2 report the results for TOBIN’S_Q. We find a weakly significant and positive effect of IDD rejections for firms with high TOBIN’S_Q (coefficient estimate of 3.356), and an insignificant effect for firms with low TOBIN’S_Q (coefficient estimate of 0.061). Columns 3 and 4 split firms in terms of SALES_GROWTH. We find a weakly significant effect among firms with higher SALES_GROWTH, and an insignificant effect for firms with low SALES_GROWTH. Finally, in columns 5 and 6, we find a weakly significant and positive effect for firms with high ASSET_GROWTH, and an insignificant effect for firms with low ASSET_GROWTH. Yet, the comparisons between the high and low subsamples are statistically insignificant for all variables.
Overall, the growth opportunities results are positive but weaker than the evidence for intangible and organizational capabilities and profitability. Although firms with higher Tobin’s Q, sales growth, and asset growth exhibit larger estimated responses to IDD rejections, the differences are not statistically significant in the split sample tests. We therefore interpret these findings as suggestive evidence that growth opportunities may increase firms’ incentives to expand into foreign markets following IDD rejection shocks.
D. Firm Scale
Finally, we explore the effects of competitive shocks considering two potential structural drivers of foreign expansion: firm size and maturity (age). Regarding firm size, the literature suggests that larger firms are more likely to overcome the elevated fixed costs of internationalization (e.g., Markusen (Reference Markusen1995)). For example, Tomiura (Reference Tomiura2007) shows that the gap between globalization and domestic orientation widens with firm size. Given their resourcefulness and ability to deploy scale economies, we expect that larger firms will respond more strongly to domestic competitive shocks by offshoring output.
The role of firm age is less clear. On the one hand, older firms are more resourceful, and this enables them to overcome the high fixed costs associated with expanding abroad (Li, Zhang, and Shi (Reference Li, Zhang and Shi2020)). On the other hand, Carr et al. (Reference Carr, Haggard, Hmieleski and Zahra2010) argue that firm age can manifest both in terms of a liability of newness and a liability of aging. While older firms may be more resourceful, younger firms are more agile. Corroborating the latter view, the findings from Hoberg and Moon (Reference Hoberg and Moon2017) point toward a negative association between firm age and output offshoring. Given such mixed views, we remain agnostic about the role of age for firms’ response in output offshoring to competitive shocks.
We measure size with the log of market equity (Ln(ME)) and divide the sample into large (above the median) and small (below the median) firms. For age (Ln(AGE)), we count the years since a firm appears in Compustat and split the sample at the yearly median. Table 9 reports the results.

TABLE 9 Long description
The table presents difference-in-differences regression results for the variable I D D R across four columns.
Columns 1 and 2 split the sample by L n (M E) into Large and Small firms.
- Column 1 (Large): Coefficient is 2.689 with a standard error of 1.581, significant at the 0.10 level.
- Column 2 (Small): Coefficient is 1.396 with a standard error of 0.996.
- The p-value for the difference between Large and Small is 0.622.
Columns 3 and 4 split the sample by L n (A G E) into Old and Young firms.
- Column 3 (Old): Coefficient is 1.467 with a standard error of 1.428.
- Column 4 (Young): Coefficient is 3.321 with a standard error of 1.912, significant at the 0.10 level.
- The p-value for the difference between Old and Young is 0.588.
All columns include Controls, Firm F E, and Year F E. The sample size N is 23,435 for Large, 22,067 for Small, 23,868 for Old, and 22,120 for Young.
Columns 1 and 2 show the results for firm size. We find a weakly significant and positive effect of IDD rejections among large firms (coefficient estimate of 2.689), and an insignificant effect among small firms (coefficient estimate of 1.396). Columns 3 and 4 present the results for firm age. We find a weakly significant and positive effect of IDD rejections among younger firms (coefficient estimate of 3.321), and an insignificant effect for older firms (coefficient estimate of 1.467). For both the size and age variables, the comparisons between subsamples return insignificant results. We therefore interpret the scale and age results as suggestive at most. While larger and younger firms exhibit positive estimated responses to IDD rejections, the evidence does not indicate that these responses are statistically different from those of smaller or older firms.
Overall, the results in this section suggest that firms’ foreign sales response to labor mobility-induced competitive shocks is concentrated among firms with stronger pre-existing capabilities. The evidence is strongest for intangible and organizational capabilities, especially organizational capital and brand capital, and for profitability, particularly operating and gross profitability. The evidence for growth opportunities and scale is weaker and should be interpreted as suggestive. The patterns are consistent with the idea that IDD rejections increase competitive pressure by making workers and knowledge more mobile across firms, but that only some firms are able to respond by expanding abroad. Specifically, organizational capital and brand capital help firms preserve differentiation, redeploy knowledge across markets, and protect rents when labor mobility increases. Profitability, in turn, provides the internal resources needed to absorb the fixed costs and risks of foreign expansion. These findings suggest that labor mobility-induced competitive pressure stimulates output offshoring primarily among firms with the capabilities needed to translate greater domestic pressure into foreign sales expansion.
VI. Extensions and Robustness
So far, our analysis has focused on the effects of competition on firms’ sales expansion abroad. In this section, we analyze input offshoring. Moreover, we conduct several robustness tests.
A. Evidence on Input Offshoring
Our analysis shows that domestic competition has a positive and significant effect on the revenue side of firms’ internationalization. Domestic competition, however, could also affect firms’ foreign activities through a cost side channel. Specifically, competitive shocks can induce firms to reorganize production and sourcing activities internationally to reduce costs. We therefore explore if and how domestic competition affects firms’ input offshoring activity.
Output and input offshoring are correlated because firms often combine foreign sales with foreign sourcing or production. For example, Hoberg and Moon (Reference Hoberg and Moon2017) show that firms use offshore input purchases partly as an operational hedge against foreign currency exposure arising from foreign output sales. However, while correlated, output and input offshoring are conceptually distinct, and the economic channels that affect firms’ decisions to offshore output versus input are different. While output offshoring captures foreign market expansion, input offshoring captures firms’ decisions to procure, produce, or source inputs abroad. As such, input offshoring is tightly linked to cost reduction motives and production reorganization.
The idea that input offshoring reduces costs is consistent with the international trade literature on offshoring. For example, Feenstra and Hanson (Reference Feenstra and Hanson1996), (Reference Feenstra and Hanson1999) emphasize that foreign outsourcing allows firms to relocate parts of production to locations with different factor costs, thereby changing firms’ effective input costs and domestic labor demand. Grossman and Rossi-Hansberg (Reference Grossman and Rossi-Hansberg2008) develop a model in which offshoring reduces the cost of performing particular tasks and generates cost savings for firms. Moreover, Egger, Kreickemeier, and Wrona (Reference Egger, Kreickemeier and Wrona2015) and Braconier, Norbäck, and Urban (Reference Braconier, Norbäck and Urban2005) show that offshoring input allows firms from high-income countries to hire workers for routine tasks at a lower wage abroad. Because competition puts pressure on firms’ margins and thus incentivizes firms to save costs (see, e.g., Raith (Reference Raith2003)), we expect that higher domestic competition leads to more input offshoring because it allows firms to reduce labor costs.
We test whether domestic competition affects input offshoring in two steps. First, we re-estimate the baseline model (1) and replace the dependent variable with input offshoring. Second, we use the IDD rejection framework to analyze whether labor mobility-induced competitive shocks affect input offshoring more strongly among firms for which labor cost savings are likely to be more valuable. Specifically, we estimate the model separately for firms with high and low employment levels, high and low employment growth, and firms operating in industries with high and low labor cost growth.Footnote 9 As in the previous tests, we split the sample at the yearly median in the pre-treatment period. The three variables capture different dimensions of firms’ exposure to labor costs. Firms with a larger workforce have a larger domestic labor cost base. Firms with faster employment growth face rising labor demand and potentially greater pressure to contain labor costs. Firms in industries with rising labor costs have stronger incentives to substitute toward lower cost foreign inputs when competition intensifies. Panel A of Table 10 presents the baseline regression results, and Panel B shows the results of the IDD rejection tests.

TABLE 10 Long description
Panel A. Baseline Model. This panel presents Poisson regressions with T N I C underscore H H I as the primary independent variable across five columns.
* Column 1: Coefficient -0.131 (standard error 0.038), significant at 0.01 level. Includes Firm and Year F E. N = 50,701.
* Column 2: Coefficient -0.123 (standard error 0.038), significant at 0.01 level. Adds Controls. N = 50,701.
* Column 3: Coefficient -0.128 (standard error 0.039), significant at 0.01 level. Includes Industry cross Year F E. N = 49,558.
* Column 4: Coefficient -0.133 (standard error 0.039), significant at 0.01 level. Includes State cross Year F E. N = 48,773.
* Column 5: Coefficient -0.082 (standard error 0.054). Includes Industry cross State cross Year F E. N = 31,071.
Panel B. I D D R Difference-in-Differences Model. This panel reports the effect of I D D R on input offshoring across seven columns.
* Column 1 (Full Sample): Coefficient 1.553 (standard error 0.927), significant at 0.10 level. N = 47,033.
* Columns 2 and 3 (Ln EMPLOY): High (H) coefficient 3.232 (significant at 0.10 level) vs Low (L) coefficient -0.103. Difference p-value is 0.213.
* Columns 4 and 5 (E M P underscore G R O W T H): High (H) coefficient 7.090 (significant at 0.01 level) vs Low (L) coefficient -0.567. Difference p-value is 0.013.
* Columns 6 and 7 (L A B underscore C O S T underscore G R O W T H): High (H) coefficient 5.422 (significant at 0.01 level) vs Low (L) coefficient -0.315. Difference p-value is 0.038.
All models in Panel B include Controls, Firm F E, and Year F E.
The results in Table 10 broadly support the cost minimization interpretation. In Panel A, the TNIC_HHI variable is negatively and significantly associated with INPUT_OFFSHORE in all specifications except in the specification that includes industry×state×year fixed effects. The marginal effect associated with the estimated coefficient of −0.123 (column 2) is −2.55. This implies a 2.5 decrease in counts of INPUT_OFFSHORE for a one-unit increase in TNIC_HHI. With a sample average of 19.6, this effect implies a 13% relative decline in input counts.
Panel B presents evidence using IDD rejections as competitive shocks. Column 1 shows that IDD rejections have a weakly significant and positive effect on input offshoring for the full sample (coefficient estimate of 1.55).Footnote 10 Furthermore, the findings in columns 2 to 7 indicate that firms’ input offshoring response to IDD rejection shocks is concentrated among firms with high labor cost exposure. Firms with high employment in levels and growth, as well as firms in industries experiencing high labor cost growth, increase input offshoring significantly following IDD rejections. We do not observe such a reaction for firms with low employment in levels and growth, nor in industries with low labor cost growth.Footnote 11 Moreover, we find statistically significant differences in the estimates across the high and low subsamples for employment growth (p-value = 0.013) and for labor cost growth (p-value = 0.038). These findings suggest that domestic competition affects input offshoring through a distinct cost efficiency channel. When domestic competitive pressure increases, firms with greater labor cost exposure are more likely to shift sourcing or production activities abroad.
These results complement our main findings on output offshoring. The results on output offshoring indicate that competition encourages firms to expand into foreign markets, especially when they possess the intangible and financial capabilities needed to compete abroad. The results on input offshoring point to a different margin of adjustment. Competition also induces firms to reduce production costs by reorganizing input sourcing internationally, particularly when labor cost savings are likely to be economically important. Overall, the evidence suggests that labor mobility shocks that increase domestic competition shape firms’ internationalization strategies on both the revenue and cost sides, but through economically distinct channels.
B. Robustness Tests
In this section, we discuss further tests to account for potential endogeneity, reverse causality, and simultaneity between competition and foreign market expansion, as well as measurement and estimation issues (these additional results are reported in the Supplementary Material).
First, we re-estimate the baseline specification (1) and expand the vector of firm control variables to absorb greater variation. Following Hoberg and Moon (Reference Hoberg and Moon2019), we control for growth opportunities, operating profitability, leverage, a dummy for dividend payers, cash holdings, asset tangibility, investment, R&D intensity, organizational capital, and capital-labor intensity. The results are reported in Table OA1 in the Supplementary Material. We continue to observe a significantly negative (positive) association between concentration (competition) and output offshoring.
Second, we employ an instrumental variable approach. We follow Gutiérrez and Philippon (Reference Gutiérrez and Philippon2017) and construct a measure of excess entry in industries in the 1990s as an instrumental variable for concentration in the following decade (2000–2009). They propose a model to study the effect of industry concentration on investment and suggest that an instrument that randomly changes the opportunity cost of entry across industries is suitable to instrument for industry concentration. They argue that the peculiar dynamics of entry in the 1990s, in particular regarding abnormally high equity valuations, can satisfy such requirements.
We calculate the instrumental variable EXCESS_ENTRY
$ {}_j^{90s} $
 as the residual of a cross-sectional industry-level (3-digit SIC) regression in which entry (the growth rate in the number of firms in each industry between 1990 and 1999) is predicted by a set of industry fundamentals (corresponding to the same period) obtained from Compustat, including Tobin’s Q, sales growth, cash flow to assets, and firms’ mean assets and age at the beginning of the decade (as of 1989). The residual of this predictive regression arguably captures entry of competitors that is orthogonal to fundamentals, thus capturing excess entry and hence excess competition.
The results of the IV models are reported in Table OA2 in the Supplementary Material. The first-stage results show that EXCESS_ENTRY
$ {}_j^{90s} $
 in the 1990s significantly predicts weaker concentration (TNIC_HHI) and stronger competition (FLUIDITY) in the next decade (2000–2009).Footnote
12 In the second-stage regressions, akin to the IV setting, we use GMM and, hence, measure output offshoring as a dummy (thus fitting a pooled linear probability model). The second-stage results indicate that both TNIC_HHI and FLUIDITY (instrumented by EXCESS_ENTRY
$ {}_j^{90s} $
 ) have significantly negative and positive effects, respectively, on the propensity of foreign market expansion.
Third, we analyze whether the effect of competition remains robust when we introduce a longer temporal distance between TNIC_HHI and OUTPUT_OFFSHORE. To do so, we lag TNIC_HHI by 2, 3, 4, and 5 years. The results are reported in Table OA3 in the Supplementary Material. While the relation between TNIC_HHI and OUTPUT_OFFSHORE remains statistically significant, it becomes economically weaker for longer lags, fading out when concentration is lagged by 5 years or more. Overall, these results suggest that our findings are unlikely to be affected by reverse causality, and that the effect of concentration (competition) on output offshoring is persistent over time, though eventually decreasing in the long run.
Fourth, we perform additional tests on measurement and estimation, reported in Table OA4 in the Supplementary Material. We i) estimate the baseline model via OLS (instead of Poisson), ii) estimate the effect of changes in concentration on changes in OUTPUT_OFFSHORE via first-difference models, iii) use the ABNORMAL_OUTPUT variable following the orthogonal transformation suggested in Hoberg and Moon (Reference Hoberg and Moon2019), measured as the residual of a regression in which the dependent variable is (1 + log) output counts and the explanatory variable is (1 + log) Input counts (also implementing the orthogonal transformation for positive entries of Output and Input, hence without applying the 1 + log operator), iv) estimate the effect of concentration (competition) on the propensity to offshore output with an output dummy as dependent variable, via both logit and probit regressions. The main result remains robust to all these additional analyses.
Fifth, we conduct robustness tests on the estimation of the DiD model for the IDD rejections. Specifically, we estimate stacked DiD models (see, e.g., Gormley and Matsa (Reference Gormley and Matsa2011), (Reference Gormley and Matsa2016)) as an alternative possibility to account for heterogeneous treatment effects. Moreover, the stacked DiD models allow us to test for the channels (organizational capabilities, profitability, growth options, and firm scale) using interactions between the IDD rejection indicator and the variables capturing such characteristics. Table OA5 in the Supplementary Material presents the results. The coefficient estimates on the interaction terms all have the expected positive sign and are statistically significant in 8 out of 11 specifications. Only for organizational capital, Tobin’s Q, and age, the interaction coefficient with the IDD rejection indicator variable is not statistically significant. Overall, these results support our main finding of a positive effect of IDD rejection shocks on firms’ foreign sales activity and our interpretation that firms’ intangible, organizational, and financial capabilities are potential economic channels.
VII. Conclusions
We study the effects of domestic product market competition on firms’ foreign market expansion. Using text-based measures of output offshoring for U.S. public firms from 1997 to 2017, we show that firms facing stronger domestic competition are more likely to expand their sales activities abroad. We further exploit staggered state-level rejections of the IDD as a labor mobility shock that increases competitive pressure through worker reallocation and knowledge diffusion. The evidence from these tests indicates that firms exposed to such shocks increase output offshoring significantly more than comparable firms in unaffected states.
Cross-sectional analyses support the view that labor mobility-induced competitive pressure at home can strengthen firms’ incentives to compete abroad. Firms’ response is strongest among firms with greater organizational and brand capital and higher profitability, while the evidence for patent stock, growth opportunities, and scale is more suggestive. These findings indicate that firms respond to these shocks more strongly when they possess the capabilities needed to differentiate their products and absorb the fixed costs of foreign expansion. Additional tests show that IDD rejection shocks also affect input offshoring, but through a distinct cost side channel. Firms with greater exposure to labor costs increase input offshoring more strongly after the shocks, consistent with cost minimization and production reorganization. Thus, labor mobility shocks that intensify competitive pressure shape firms’ internationalization strategies on both the revenue and cost sides, but through economically distinct channels.
The article contributes to the literature on product market competition, corporate investment, and internationalization by showing that domestic market structure shapes firms’ global expansion decisions. Existing research has studied how competition affects investment, innovation, productivity, and exports. We add evidence that competition also affects firms’ decisions to sell output abroad, and that this response is concentrated among firms with the organizational, brand, and financial capabilities needed to compete in foreign markets. Our findings also speak to the policy debate on domestic concentration, labor mobility, and international competitiveness. Specifically, they suggest that policies affecting domestic competitive pressure and the mobility of workers and knowledge may influence not only the allocation of resources within national markets but also firms’ ability and incentives to participate in foreign markets.
Appendix
Variable Descriptions
- OUTPUT_OFFSHORE (C)
-
The raw counts of how many times output offshore activity is mentioned by firm i in year t. Source: Hoberg and Moon (Reference Hoberg and Moon2017), (Reference Hoberg and Moon2019).
- OUTPUT_OFFSHORE (D)
-
A dummy variable that is equal to 1 if the counts of output offshore by firm i in year t > 0, and equal to 0 otherwise. Source: Hoberg and Moon (Reference Hoberg and Moon2017), (Reference Hoberg and Moon2019).
- TNIC_HHI
-
TNIC-based HHI industry concentration index. Source: Hoberg and Phillips (Reference Hoberg and Phillips2016).
- Ln(ME)
-
Natural log of MVE—the market value of equity (me) [ln(prcc_f*csho)]. Source: Compustat.
- TOBIN’S_Q
-
Market value of assets divided by the book value of assets [(me+lt + pstk)/at]. Source: Compustat.
- OPERATING_PROFITABILITY
-
Operating income before depreciation divided by assets [oibdp/at]. Source: Compustat.
- LEVERAGE
-
Total leverage divided by total assets [(dltt+dlc)/at]. Source: Compustat.
- DIVIDENDS (D)
-
A dummy variable =1 if firm pays dividends, =0 otherwise [=1 if dvc $ > $
 0; =0 if dvc = 0]. Source: Compustat.
- CASH_HOLDINGS
-
Cash and equivalents divided by total assets [che/at]. Source: Compustat.
- TANGIBILITY
-
Gross property, plant and equipment divided by total assets [ppegt/at]. Source: Compustat.
- INVESTMENT
-
Capital expenditures divided by sales [capx/sale]. Source: Compustat.
- R&D_ASSETS
-
R&D divided by assets [xrd/at]. Source: Compustat.
- ORGANIZATIONAL_CAPITAL
-
Stock of organizational capital constructed using the perpetual inventory method (Eisfeldt and Papanikolaou (Reference Eisfeldt and Papanikolaou2013)). Source: Compustat.
- Ln(K-L)
-
Natural log of gross property, plant, and equipment divided by employees [ln(ppegt/emp)]. Source: Compustat.
- INPUT_OFFSHORE
-
The raw counts of how many times Input Offshore activity is mentioned by firm i in year t. Source: Hoberg and Moon (Reference Hoberg and Moon2017), (Reference Hoberg and Moon2019).
- Ln(AGE)
-
Natural log of Firm Age (number of years since first appearance in Compustat). Source: Compustat.
- COMPETITIVE_INDUSTRIES (D)
-
A dummy =1 in competitive industries (TNIC HHI $ < $
median), and = 0 in concentrated industries (TNIC HHI
$ > $
median). Source: Hoberg and Phillips (Reference Hoberg and Phillips2016). - FLUIDITY
-
Overlap between firms’ and changes in industry’s product vocabulary [prodmktfluid]. Source: Hoberg et al. (Reference Hoberg, Phillips and Prabhala2014).
- PRODUCT_SIMILARITY
-
Inverse measure of product differentiation [tnictsimm]. Source: Hoberg and Phillips (Reference Hoberg and Phillips2016).
- COMPETITORS (N)
-
Number of competitors in 3-digit SIC industries. Source: Compustat.
- PATENT_STOCK
-
Cumulative stock of patents. Source: UVA Darden Global Corporate Patent Dataset.
- NET_PROFITABILITY
-
Net income divided by assets [ni/at]. Source: Compustat.
- GROSS_PROFITABILITY
-
Gross profit divided by assets [gp/at]. Source: Compustat.
- BRAND_CAPITAL
-
Advertising expenses (3-year cumulative) divided by assets [xad/at]. Source: Compustat.
- Ln(ASSETS)
-
Natural log of assets [ln at]. Source: Compustat.
- Ln(SALES)
-
Natural log of sales [ln sale]. Source: Compustat.
- Ln(EMPLOYMENT)
-
Natural log of employment [ln emp]. Source: Compustat.
- ASSET_GROWTH
-
Growth rate of assets [ $ \Delta $
log at]. Source: Compustat. - SALES_GROWTH
-
Growth rate of sales [ $ \Delta $
log sale]. Source: Compustat. - EMPLOYMENT_GROWTH
-
Growth rate of employment [ $ \Delta $
log emp]. Source: Compustat. - LABOR_COST_GROWTH (Industry)
-
Growth rate of industry average wages (SIC 2-digit) [ $ \Delta $
log (xlr/emp)]. Source: Compustat. - IDDR
-
=1 for state-years rejecting the Inevitable Disclosure Doctrine, =0 otherwise. Source: Authors.
- Ln(GDP)
-
The natural log of state GDP. Source: BEA.
- LMI
-
12 minus the number of noncompete clauses prevailing in firms’ states. Source: Bai et al. (Reference Bai, Eldemire and Serfling2024).
- EXCESS_ENTRY
-
(Industry) The residual of an industry-level (3-digit SIC) cross-sectional regression of Entry against industry fundamentals in the 1990s. Source: Authors.
- ABNORMAL_OUTPUT (C)
-
The residual of a regression of (1 + log) Output as dependent variable and (1 + log) Input as explanatory variable. Source: Authors.


Supplementary Material
To view supplementary material for this article, please visit http://doi.org/10.1017/S0022109026103354.


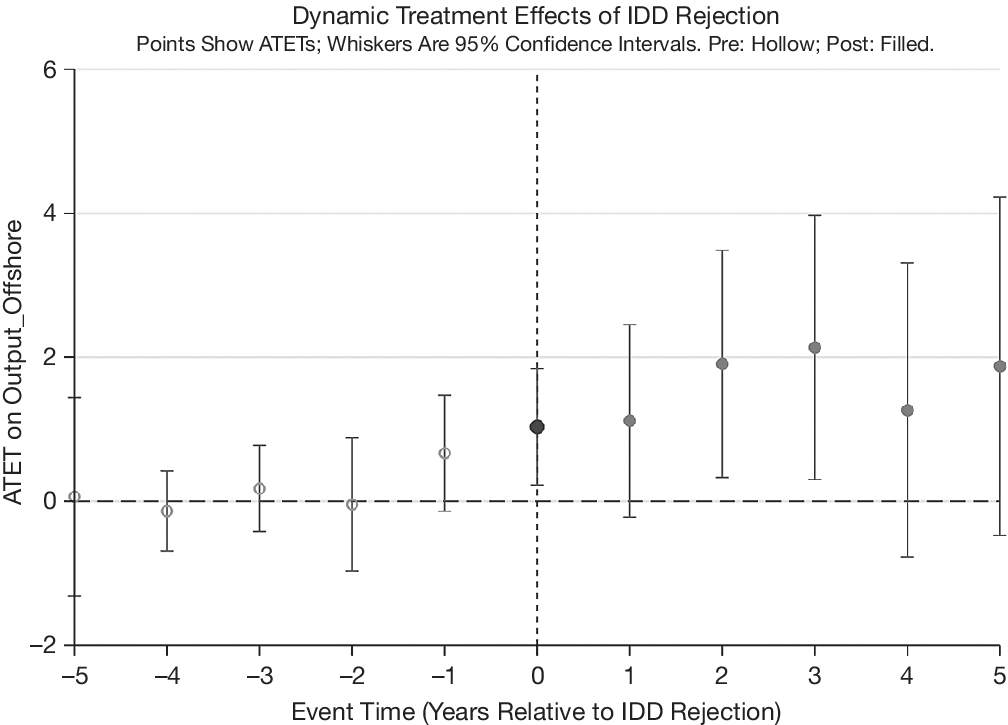


 Open access

