INTRODUCTION
In agricultural research for development, on-farm demonstrations are a common strategy to introduce agricultural technologies to farmers. When laid out in an experimental design, these demonstrations are often simultaneously used to evaluate the performance of these technologies under farm conditions. Sometimes referred to as ‘demonstration-trials’, these experiments are geared towards technology dissemination – as is implied by the notion of ‘demonstration’ and complementary activities such as farmer training and field days. The experiments are often designed by researchers, while extension workers or trained technicians usually supervise their implementation by farmers in farmers’ fields. Although on-farm demonstration-trials often do not replicate farmer conditions exactly, as input levels and management are guided by research protocols, they are nevertheless closer to farmers’ farming reality compared with on-station trials because management is carried out by farmers and influenced by their preferences and constraints (e.g. delays in weeding due to labour shortage or attendance of community events). In development-oriented agronomic research, which aims at improving farmer practice and livelihood, this kind of collaborative work of researchers and farmers is based on two implicit assumptions: (1) that the performance of new agricultural technologies on trial plots is indicative of what farmers in the area can achieve on their farm once they fully master the new technologies/practices, and; (2) that through their participation, trial-hosting farmers will learn, and be the early adopters of new agricultural technologies (Rogers Reference Rogers2003). The current study analyses these assumptions for on-farm conservation agriculture (CA) experiments, adopting a farm-level perspective.
Conservation agriculture is a cropping systems management approach that entails three principles: (1) reduced soil disturbance, (2) residue retention on the soil surface and (3) crop rotations and associations (FAO 2002). It has been widely promoted in Southern Africa (Thierfelder et al. Reference Thierfelder, Rusinamhodzi, Ngwira, Mupangwa, Nyagumbo, Kassie and Cairns2015a ) and a number of on-farm demonstration-trials have been implemented in the last decade (Thierfelder & Wall Reference Thierfelder and Wall2012; Thierfelder et al. Reference Thierfelder, Cheesman and Rusinamhodzi2013a , Reference Thierfelder, Chisui, Gama, Cheesman, Jere, Bunderson, Eash and Rusinamhodzi b , Reference Thierfelder, Mwila and Rusinamhodzi c , Reference Thierfelder, Matemba-Mutasa and Rusinamhodzi2015b , Reference Thierfelder, Mutenje, Mujeye and Mupangwa c ). Results from these on-farm studies suggest that CA has the potential to increase yields. Nevertheless, farmer adoption of CA technologies in southern Africa is generally (s)low, often partial and limited to small land areas (Andersson & D'Souza Reference Andersson and D'Souza2014). A common explanation given for this is that CA is knowledge-intensive, requiring numerous changes to the cropping system (Wall Reference Wall2007; Kassam et al. Reference Kassam, Friedrich, Shaxson and Pretty2009; Wall et al. Reference Wall, Thierfelder, Ngwira, Govaerts, Nyagumbo, Baudron, Jat, Sahrawat and Kassam2013). The current farm-level study therefore focuses on the technology adoption dynamics among a small group of increasingly knowledgeable, trial-hosting farmers. Comparing farming communities that have hosted similar CA demonstration-trials for at least seven consecutive seasons, the effect of a closing knowledge gap on farmer practice and its performance was studied. Although the current study uses the case of CA, the approach taken has wider relevance, and is applicable to other technologies as well.
A yield gap (YG) is commonly defined as the difference between potential yield under optimal management (that is, crop growth that is not limited by water and nutrients, or pests and diseases) and the yield actually achieved on farmers’ fields for a given crop in a certain location and cropping system (van Ittersum et al. Reference van Ittersum, Cassman, Grassini, Wolf, Tittonell and Hochman2013). Yield gaps are assessed to ‘better quantify and understand the potential for improving food production in a given region or system’ (van Ittersum & Cassman Reference van Ittersum and Cassman2013). There are different methods to estimate potential yield and, consequently, a number of YG measures exist: model-based (YGM); experiment-based (YGE); and farmer-based (YGF) (Lobell et al. Reference Lobell, Cassman and Field2009). What is referred to as the YG in the current study is similar to YGF, but instead of calculating a YG for a region, it was calculated for individual farmers’ fields. Also, instead of potential yield on farmers’ fields, a more practical notion of ‘attainable yield’ is used, which is defined as the best-performing CA demonstration-trial treatment managed by the same farmer. Located on the same farm, it was assumed that crop growth in demonstration-trial plots and farmer fields takes place under the same climatic conditions and water limitations. Nutrient supply and management is assumed to be closer to an optimum in the demonstration-trial plots as compared with the farmers’ fields. Hence, the current study does not study absolute YGs and their closure, but merely the effect of a closing knowledge gap on a reduction – or closure – of a farmer-attainable YG.
The current study analyses experimental and farm data in three land classification areas of Zimbabwe. This classification of farm land, which has its roots in the colonial era, represents differences in agro-ecologies and agricultural potential, as well as socio-economic status and infrastructural development. Communal Areas are smallholder farming areas that were established as so-called ‘African Reserves’ around 1910 (Floyd Reference Floyd1962; Palmer Reference Palmer1977). Originally intended as labour reserves for an expanding capitalist economy, Communal Areas are generally characterized by degradation-prone (granite-derived) sandy soils with poor soil fertility and high population densities. Such areas of low agricultural potential are often also characterized by limited connection to markets for agricultural inputs and produce. Resettlement Areas were first established in the mid-1980s on land that white settler farmers had occupied during the colonial period. Farms were given out to aspiring African farmers who had successfully completed a ‘Master Farmer’ training programme. As part of Zimbabwe's post-2000 land-reform programme more Resettlement Areas were created. With better soils and far lower population densities than the Communal Areas, Resettlement Areas are usually seen as commercially oriented farming areas. The current study thus compares farming households with different livelihood orientations and within heterogeneous socio-ecological niches (Ojiem et al. Reference Ojiem, de Ridder, Vanlauwe and Giller2006), which may have different potential for CA adoption. By comparing the actual farm practices of trial-hosting farmers in the studied areas to plot-level data from demonstration-trials, the current study illuminates how higher-scale factors, relating to the agro-ecological and socio-economic farming environment, shape farm practices and the adoptability of CA or its components. As the farmers have implemented CA demonstration-trials for at least seven consecutive seasons, a closing knowledge gap on CA is assumed – a lack of knowledge is no longer regarded as a factor limiting farmers’ uptake of CA related practices on their farms.
MATERIALS AND METHODS
Study area
The current study compared the results of on-farm demonstration-trials with management and performance of farmer fields in different land classification areas in Mashonaland Central province, Zimbabwe. Three sites, all within a radius of 50 km from Bindura town, were considered: Hereford and Chavakadzi Resettlement Areas established in 2002 and 1987, respectively, and Madziwa Communal Area (Fig. 1). The three sites represented a gradient of decreasing agricultural potential. In the Resettlement Areas, soil texture varied from sandy loam to sandy clay loam and the predominant soil types were Chromic Luvisols and Lixisols (IUSS Working Group WRB 2014), which are better suited for agricultural production than Madziwa's Arenosols (IUSS Working Group WRB 2014).
Schematic representation of the land use in the three studied sites in Mashonaland central province (Zimbabwe), including the land holdings of the interviewed farmers (for Madziwa four out of eight are displayed).

Figure 1 shows site locations, a schematic representation of the different landscapes in the sites, and provides an indication of farm sizes. In Madziwa, little forest land was found along rivers or hills and non-cultivated land was mostly grassland. Farm sizes were very variable: most farmers had 1–2 ha farms, while others had 10–20 ha. The analysis therefore distinguished Madziwa large (9–16·5 ha) and Madziwa small (1–2·5 ha). In Chavakadzi and Hereford farm sizes were more similar – but larger in Chavakadzi – as these Resettlement Areas resulted from land use planning. Wood and grassland where cattle graze made up a substantial part of the landscape. Another major difference between Madziwa and the redistributed lands of Chavakadzi and Hereford was that in the former, homesteads were located within the farm while in the latter there were designated housing areas where homesteads were concentrated.
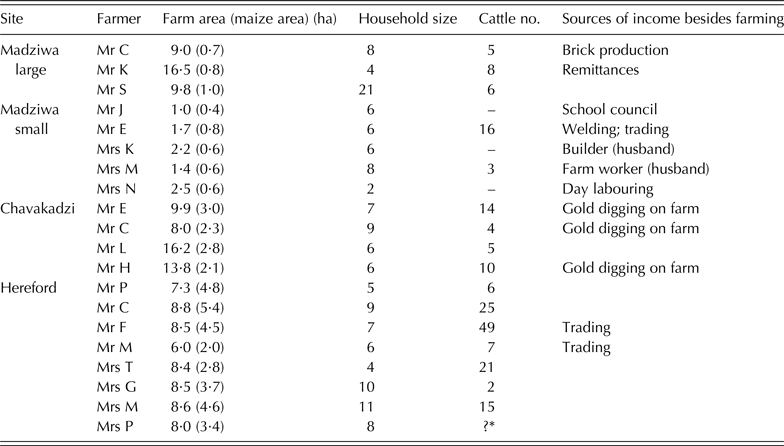
Table 1 provides a brief overview of the interviewed farmers that hosted CA trials in the three sites. The most striking difference between the sites was the diverging importance of farming and off-farm income for rural livelihoods. While farmers in Hereford almost exclusively relied on agricultural production to secure their livelihood, in Madziwa other income-generating activities were more important and often subsidized food production-oriented cropping activities. In Chavakadzi farming was also the main activity, but on-farm gold digging provided additional income. Although household size was similar across all sites (6–8 persons) the farm area allocated to maize, the main staple food, differed. In Madziwa maize was grown on 0·4–1·0 ha, in Chavakadzi on 2·1–3·0 ha and in Hereford on 2·0–5·4 ha (constituting 0·05–0·47, 0·15–0·30 and 0·33–0·66 of the farm area, respectively). Cattle numbers were very variable both between and within sites. The highest numbers of cattle were recorded in Hereford, while farmers in Madziwa with small landholdings often had no cattle at all.
Characterization of interviewed farmers

* No information about how many.
Demonstration-trials
The demonstration-trials (demo-trials) were first established in Chavakadzi during the 2004/05 cropping season and during the 2005/06 season in Madziwa and Hereford. The original aim of these trials was: (1) to collect agronomic and socio-economic data on the performance and practicability of different practices associated with the three CA principles and; (2) to demonstrate CA to farmers. In each site four to eight replications of 0·3 ha were established, on which three tillage treatments were tested:
-
1. Conventional ploughing (CP): The crop was manually seeded and fertilized after the land had been tilled once to a shallow depth (10–15 cm) with an animal-drawn mouldboard plough. Crop stubbles of the previous season were thus incorporated into the soil. Permanent soil cover was not practised, as most of the residues had been removed or grazed during the dry season. No herbicides were used.
-
2. Conservation Agriculture, ripping (CA-RI): The crop was manually seeded and fertilized in rip-lines opened using a Magoye ripper tine; a residue cover of 2·5–3 t/ha was ensured at the beginning of the rainy season either by fencing the plot area, stacking the residues up during the dry season, or importing residues (i.e. thatching grass). A pre-emergence application of glyphosate (N-(phosphono-methyl) glycine) at a rate of 2·5 litres/ha was used to eliminate weeds at seeding, followed by hoe-weeding whenever weeds were 10 cm tall or 10 cm diameter for weeds with stoloniferous or rhizomatous growth habit.
-
3. Conservation Agriculture, direct seeding (CA-DS): The crop was seeded and fertilized in one passage using an animal-drawn direct seeder (Fitarelli Machinas, Brazil; http://www.fitarelli.com.br); residue management and weed control (including herbicide use) was the same as for CA-RI.
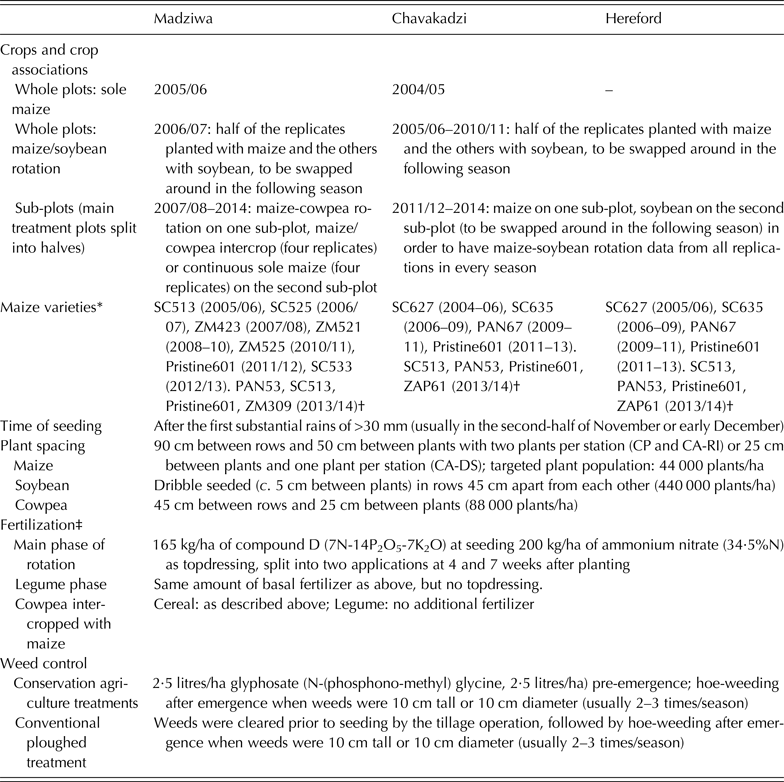
All treatments used maize and a legume in rotation – soybean in Chavakadzi and Hereford, and cowpea on the sandier soils of Madziwa. Additional details on demo-trial management are given in the Table 2.
Demonstration-trial management: details on crops and crop associations grown, maize varieties used, time of seeding, plant spacing, fertilization as well as weed control

CA, conservation agriculture, CP, conventional ploughing; DS, direct seeding; RI, ripping.
* Year of cultivation is given in brackets. The same variety was used on all replicates within a site and season but sometimes changed between seasons to make use of genetic improvement over time.
† In the 2013/14 cropping season in all three sites the maize subplot was further subdivided to accommodate four different maize varieties to test for possible management by environment (M × E) interactions.
‡ Fertilizer rates were the same for the three main treatments for all sites and seasons.
The demo-trials were implemented by farmers on a dedicated piece of land on their farm. Trial-hosting farmers were selected in community sensitization meetings prior to the first season of the experiment's establishment. Scientists from the International Maize and Wheat Improvement Centre (CIMMYT) were responsible for trial design and protocols as well as any changes to the treatments, taking into account farmers’ preferences (e.g. type of legume or maize varieties to be used). Direct seeders and ripper tines as well as the inputs for the trials (seed, fertilizer and herbicides) were made available by CIMMYT. In Chavakadzi and Hereford, each trial-hosting farmer was responsible for the day-to-day management of the trial on his/her land, receiving support from the local extension service and CIMMYT technicians. Their labour was rewarded with the produce from the demo-trials. In Madziwa, on the other hand, demo-trials were implemented on a specific piece of land owned by one farmer, but trial management was done jointly, by a group of 6–10 farmers who, at the end of the season, shared the harvest.
Various biophysical (and socio-economic) parameters were measured on the demo-trials across the different seasons of trial implementation. For the current study, rainfall and yield records were used. During the growing season, farmers recorded daily rainfall collected in a rain gauge on their farm. At harvest, grain and stover biomass yields were recorded for maize and legume crops each season following the procedure described in Thierfelder et al. (Reference Thierfelder, Mutenje, Mujeye and Mupangwa2015c ).
Methodology
Focus group discussions with trial-hosting farmers were held at each site to collect farmers’ opinions on the CA trials and the key lessons learned. Individual recall interviews with trial-hosting farmers were held on three occasions during the 2013/14 cropping season (prior to seeding, mid-season and after harvest). These semi-structured interviews were conducted during or after global positioning system (GPS)-tracked farm walks. The interviews focused on land preparation practices, fertilization and other input use, crop sequences and production. For each trial-hosting farmer interviewed, data on the entire farm was collected recording information about each field for the 2011/12, 2012/13 and 2013/14 cropping seasons. In addition, farm household information was recorded (Table 1). The GPS data collected during the farm walks were used to draw farm maps using Google Earth version 6.0 (Google, http://www.googleearth.com) and calculate farm and field sizes using Earth Point (W. Clark, http://www.earthpoint.us). The calculated field sizes were then used to transform field-level input and output data into per hectare data, to allow for comparison with the demo-trial data. The comparisons between demo-trials and farmer fields focused on performance (yields) as well as the three CA principles and their implementation.
Maize yield comparisons between demo-trials and farmer fields
In a first step, maize yield differences between demo-trials and farmers’ self-managed fields were investigated. When comparing differences in yields, fertilization rates and tillage methods were taken into account. As fertilization appeared to be crucial in explaining maize yield differences between farmers’ fields and demo-trials, an economic analysis of fertilizer cost v. potential income in maize production was conducted. In addition, a soil surface budget for nitrogen (N), phosphorus (P) and potassium (K) was calculated to assess possible nutrient mining.
Yield gaps
Building on earlier studies from the investigated sites (Thierfelder et al. Reference Thierfelder, Cheesman and Rusinamhodzi2012; Thierfelder & Wall Reference Thierfelder and Wall2012) it was assumed that the CA technology used in the demo-trials improves yields. Since the CA-DS treatment gave the highest yields most frequently in the demo-trials, it was selected as the attainable maize yield for a given farmer at a given site. For each farmer the maize yield on his/her self-managed fields was expressed as a proportion of the CA-DS yield of the demo-trial he/she had managed in the past seven or more seasons. In the current study, the YG was thus defined as the difference between the CA-DS treatment of the demo-trial and farmers’ field yield. The YG calculations were repeated using the ripped (CA-RI) or ploughed (CP) demo-trial treatment as the attainable yield, but since similar trends were observed, only the CA-DS v. farmers’ field results are reported and discussed. The farmer field yields used, correspond to single fields or the entire maize area of one farmer in a given season, depending on the farmer's ability to provide plot-level or farm-level maize yield data.
Fertilizer cost v. potential income in maize production
For each farmer and season (2012/13 and 2013/14), fertilizer costs for maize production were calculated as:
 $$\eqalign{\hbox{Maize fertilizer cost } ({\rm US}\$ ) &= \hbox{total fertilizer applied to} \cr & \qquad \hbox {maize} \times \hbox{price of fertilizer}}$$
Similarly, potential crop-derived income per farm from maize sales (US$) was calculated by multiplying total maize grain harvested by the price of maize, and the net revenue (US$) per farm was calculated as the difference between potential income and fertilizer costs. Data on fertilizer expenses for maize production, potential income and net revenue from maize sales was aggregated per site and recalculated on a per hectare basis in order to make comparisons.
Soil surface budget for nitrogen, phosphorus and potassium
A ‘soil surface budget records all nutrients that enter the soil via the surface and that leave the soil via crop uptake’ (Oenema et al. Reference Oenema, Kros and de Vries2003). Nutrient inputs through fertilizer (kg/ha) were calculated on the basis of amount of fertilizer applied (kg) as indicated by the farmer during interviews and maize field area (ha) calculated from the GPS-based field maps. Nutrient exports through grain and stover were calculated on the basis of the maize grain harvest data collected during interviews and the field size. In the absence of information on stover biomass a 1 : 1 ratio was assumed between grain and stover production. The following figures on nutrient content in plant material were used to calculate the nutrient export via grain and stover. Grain: 15·1 kg N, 3·5 kg P and 4·2 kg K/t dry matter (DM); stover: 9 kg N, 0·9 kg P and 16·6 kg K/t DM (Fritsch Reference Fritsch2012). Although in the current study possible inputs through manure and nutrient losses to the environment were neglected due to lack of data, the soil surface budget allowed for a rough assessment of soil nutrient mining.
Crop residue use
Farmers did not usually retain crop residues for permanent soil cover on their fields. Consequently, no quantitative data on residue retention were collected/analysed. The qualitative data collected during interviews and farm walks focused on understanding why residues were not retained.
Crop rotation
A second set of analyses focused on crop rotation and fallowing practices in farmer fields. These aimed to establish what farmers learned from the rotation practices in the CA demo-trials. Farmers’ rotation and fallowing practices were identified using the plot allocation and plot size data of successive seasons (2011/12, 2012/13 and 2013/14). Crop rotation and fallowing practices combined with farmers’ explanations during the interviews yielded insights into soil fertility management practices and the drivers of fallowing.
Land allocations to different crop categories and fallow
Crops were first sub-divided into four categories: maize, legumes (groundnut, bambara nut, sugar bean, cowpea and soybean), cash crops (tobacco and cotton) and others (sunflower, sorghum, millet, sweet potato and oilseed rape). Additionally, two categories for fallow, short (⩽3 years) and long (>3 years) were defined. For each farmer and season the proportion of land, out of the total, allocated to each of these six categories was calculated. Thereafter the average proportion per category was calculated for each site and these data were compiled into pie charts. Data from the 2011/12 cropping season was not considered as there were too many fields for which information was not available because farmers could not remember.
Three year crop sequences
The same four crop categories used to compile the land allocation pie charts were considered to investigate how frequently a certain type of crop was repeated within the 3-year cropping window for which data were available. As an example: for Chavakadzi complete data were available for 25 different fields, of which five (0·20) had been planted with 2 consecutive years of maize within the 3 years.
Two year crop sequences
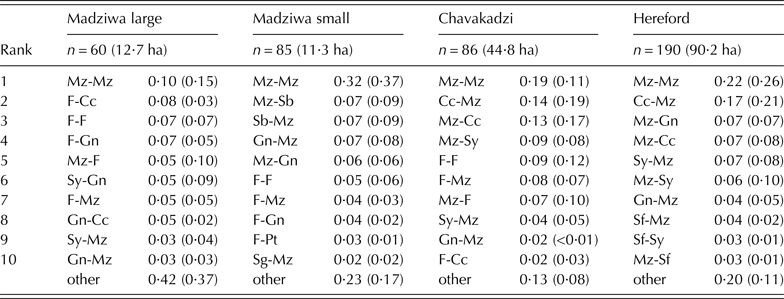
Two year crop sequences were compiled for each crop species, except for tobacco and cotton that were again taken together as cash crops. The total number of available 2-year crop sequences was determined and the frequency (proportion of fields from the total) of each observed crop sequence was calculated. In addition to the frequency (no. of fields) the proportion of the area covered by that particular crop sequence within the site was calculated. As an example: in Madziwa small a total of 85 2-year crop sequences were recorded, accounting for a total area of 11·3 ha; in 0·32 of the cases (27 fields) maize was planted after maize; in terms of area, maize after maize accounted for 0·37 of the total area, that is 4·23 ha out of 11·3 ha. Only the ten most frequent 2-year crop sequences were compiled into a table.
Statistical analysis
Descriptive statistics for farmer maize grain yields as well as a one way analysis of variance (ANOVA), performed to verify for significant differences in fertilizer costs and potential income in maize production across the three sites, were carried out using StatistiX version 9.0 (Analytical Software, http://www.statistix.com). Standard errors in all other figures were compiled when drawing the graphs using SigmaPlot version 11·0 (Systat Software Inc., http://www.sigmaplot.com).
RESULTS
Farmers practice as compared with demo-trials
Variability of maize yields
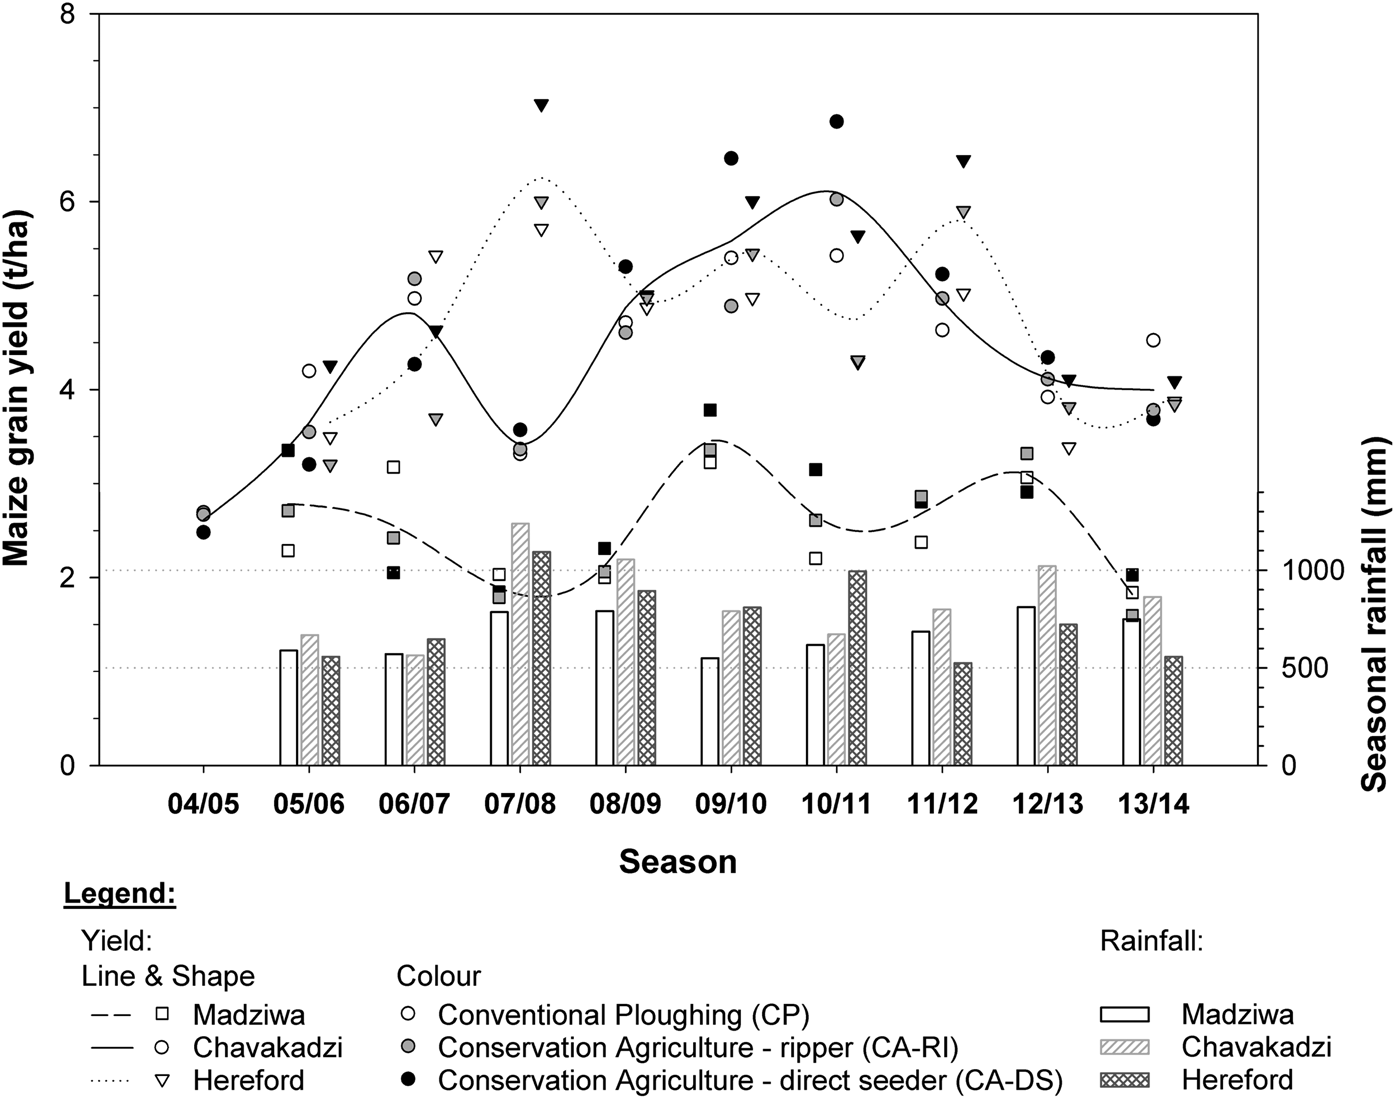
Maize grain yields on the demo-trials were very variable, both in time and within and across sites (Fig. 2). In all sites the variability in yields between seasons was greater than between treatments (Fig. 2), highlighting that above any management practice, rainfall and soil properties were the major yield determinants. In Madziwa, maize grain yields between 1·5 and 3·5 t/ha were recorded; while in Chavakadzi and Hereford they ranged from 2·5 to 7 t/ha (Fig. 2). Rainfall recorded across the nine seasons ranged between 550 and 811, 564 and 1239 and 525 and 1094 mm per season in Madziwa, Chavakadzi and Hereford, respectively (Fig. 2).
Average maize grain yield of the three treatments (conventional ploughing (CP), conservation agriculture, ripping (CA-RI) and conservation agriculture, direct seeding (CA-DS)) and total rainfall recorded since the onset of the on-farm demonstration-trials in Madziwa, Chavakadzi and Hereford. The lines are drawn on the basis of the average yield between treatments in each site and season.

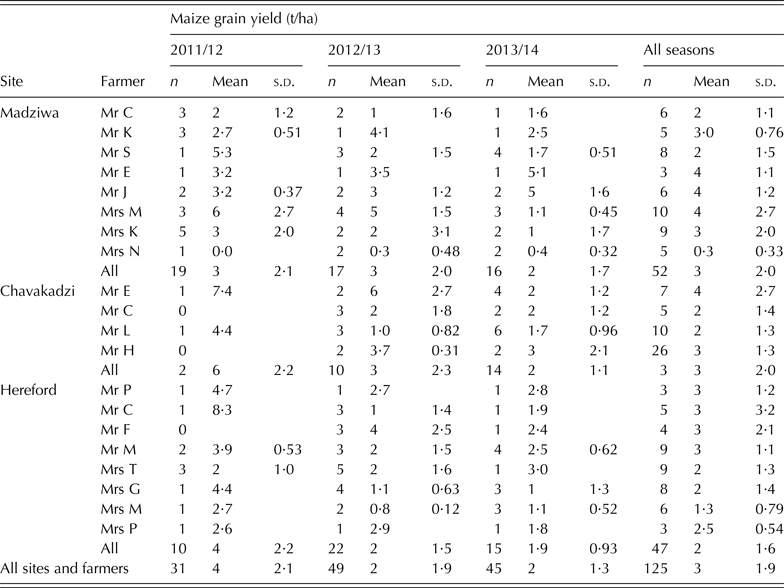
Similar to the demo-trials, maize grain yields of farmers’ self-managed fields also displayed considerable variability across seasons and sites as well as within sites, that is, between farmers (Table 3). Overall, the variability in farmers’ maize grain yields was highest in Madziwa and lowest in Hereford. This is likely to be a result of differences in soil quality and rainfall reliability, as well as a measure of farmer heterogeneity in the different communities – larger in Madziwa than in the resettlement sites. Maize yield variability within farms was also very high; some fields were more fertile, cropped more intensively (receiving more inputs or more care), or seeded earlier. Such differences in management are likely to result from preferential treatment of particular fields by farmers facing labour and input shortages.
Average and standard deviation (s.d.) of maize grain yield (t/ha) harvested on farmers’ fields in Madziwa, Chavakadzi and Hereford for the investigated seasons. The number of observations is indicated with ‘n’

Maize yield gaps
While a YG between the CA-DS demo-trial treatment and farmer fields was recorded for all three seasons in Hereford, in Madziwa both large and small farms increasingly outperformed the CA-DS treatment over the three cropping seasons studied (Fig. 3). The current study's YG definition thus resulted in a ‘negative yield gap’ for Madziwa. In 2011/12, 2012/13 and 2013/14, large farms in Madziwa achieved average maize grain yields of 87, 143 and 211% of the CA-DS treatment, respectively, while small farms achieved 110, 108 and 157%, respectively.
Maize grain yields on farmer fields expressed as percentage of the maize grain yield of the direct seeded conservation agriculture (CA) treatment in the demonstration-trial. Mean and standard errors are displayed shifted to the right from the respective season and site observations. The number of observations in each site and season are indicated with ‘n’. The solid horizontal line indicates equal yields on farmers’ fields and demonstration-trials.

In Chavakadzi an emerging YG between demo-trial and farm yields was observed. Maize grain yields on farmers’ fields were 121, 98 and 47% of the CA-DS treatment in the 2011/12, 2012/13 and 2013/14 seasons, respectively. In Hereford, a widening YG was observed; farmers’ fields produced on average 65, 48 and 49% of the CA-DS treatment in the 2011/12, 2012/13 and 2013/14 seasons, respectively.
Maize yield gaps as influenced by tillage method and nitrogen fertilization
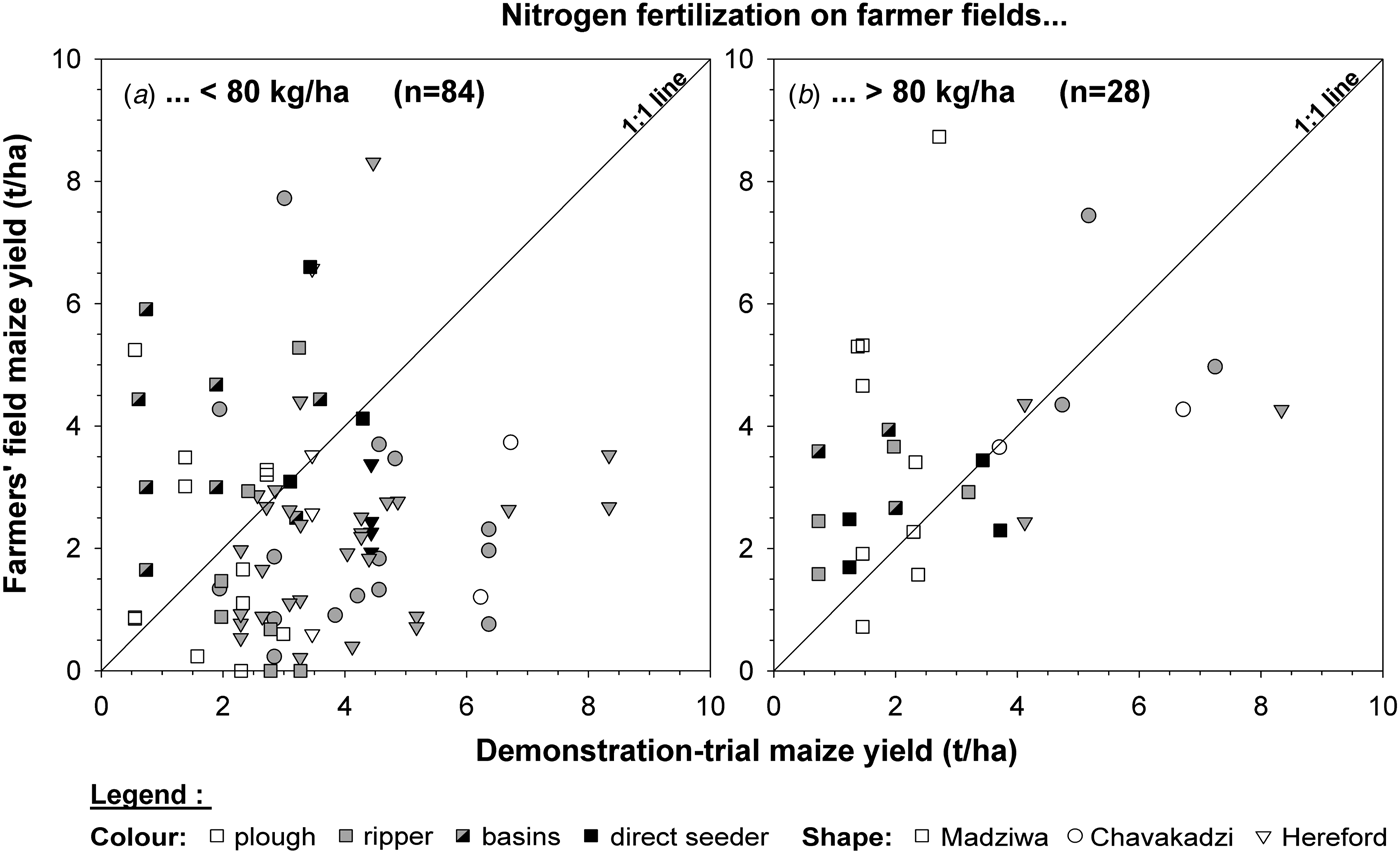
To assess the influence of tillage method on maize yields, farmers’ fields were compared with the demo-trial treatment that was most similar to their own practice in terms of tillage practice (Fig. 4). For example, a farmer's maize field planted in rip-lines was compared with the CA-RI treatment of that farmer's demo-trial (basin fields, i.e. a method for reducing tillage where the crop is sown into small holes (15 × 15 × 15 cm3) dug with a hoe, were also compared with the CA-RI treatment). The difference in fertilizer rates applied on farmers’ fields as compared with the demo-trial was taken into account by displaying farmer fields with lower N fertilization than the demo-trial vs those with higher N fertilization (Figs 4 (a) and (b), respectively).
One to one comparison of farmers’ field maize grain yield and the yield of the most comparable demonstration-trial treatment taking into account tillage method and nitrogen (N) fertilization rates. Graph (a) and (b) display observations for farmer fields fertilized at a lower and higher N rate than the demonstration-trials (80 kg N per hectare), respectively. The number of observations (n) is indicated in brackets.

From a total of 112 paired observations, 70 (almost two-thirds) presented a higher yield on the demo-trial than on the farmer field (Fig. 4). Differences in N fertilization rates were clearly a major determinant of this yield difference. Lower fertilization in the farmers’ fields was observed in 59 of the 70 cases where a YG was recorded. However, in a number of cases, farmers achieved higher yields in their own fields than in the CA-DS demo-trial treatment, despite lower (<80 kg/ha) N fertilization rates (n = 25). Such fields were mainly found in Madziwa (n = 17). Farmers’ fields fertilized at a higher rate (>80 kg/ha of N) than the demo-trials were also mainly observed in Madziwa (n = 20).
Fertilization rate on farmers’ fields
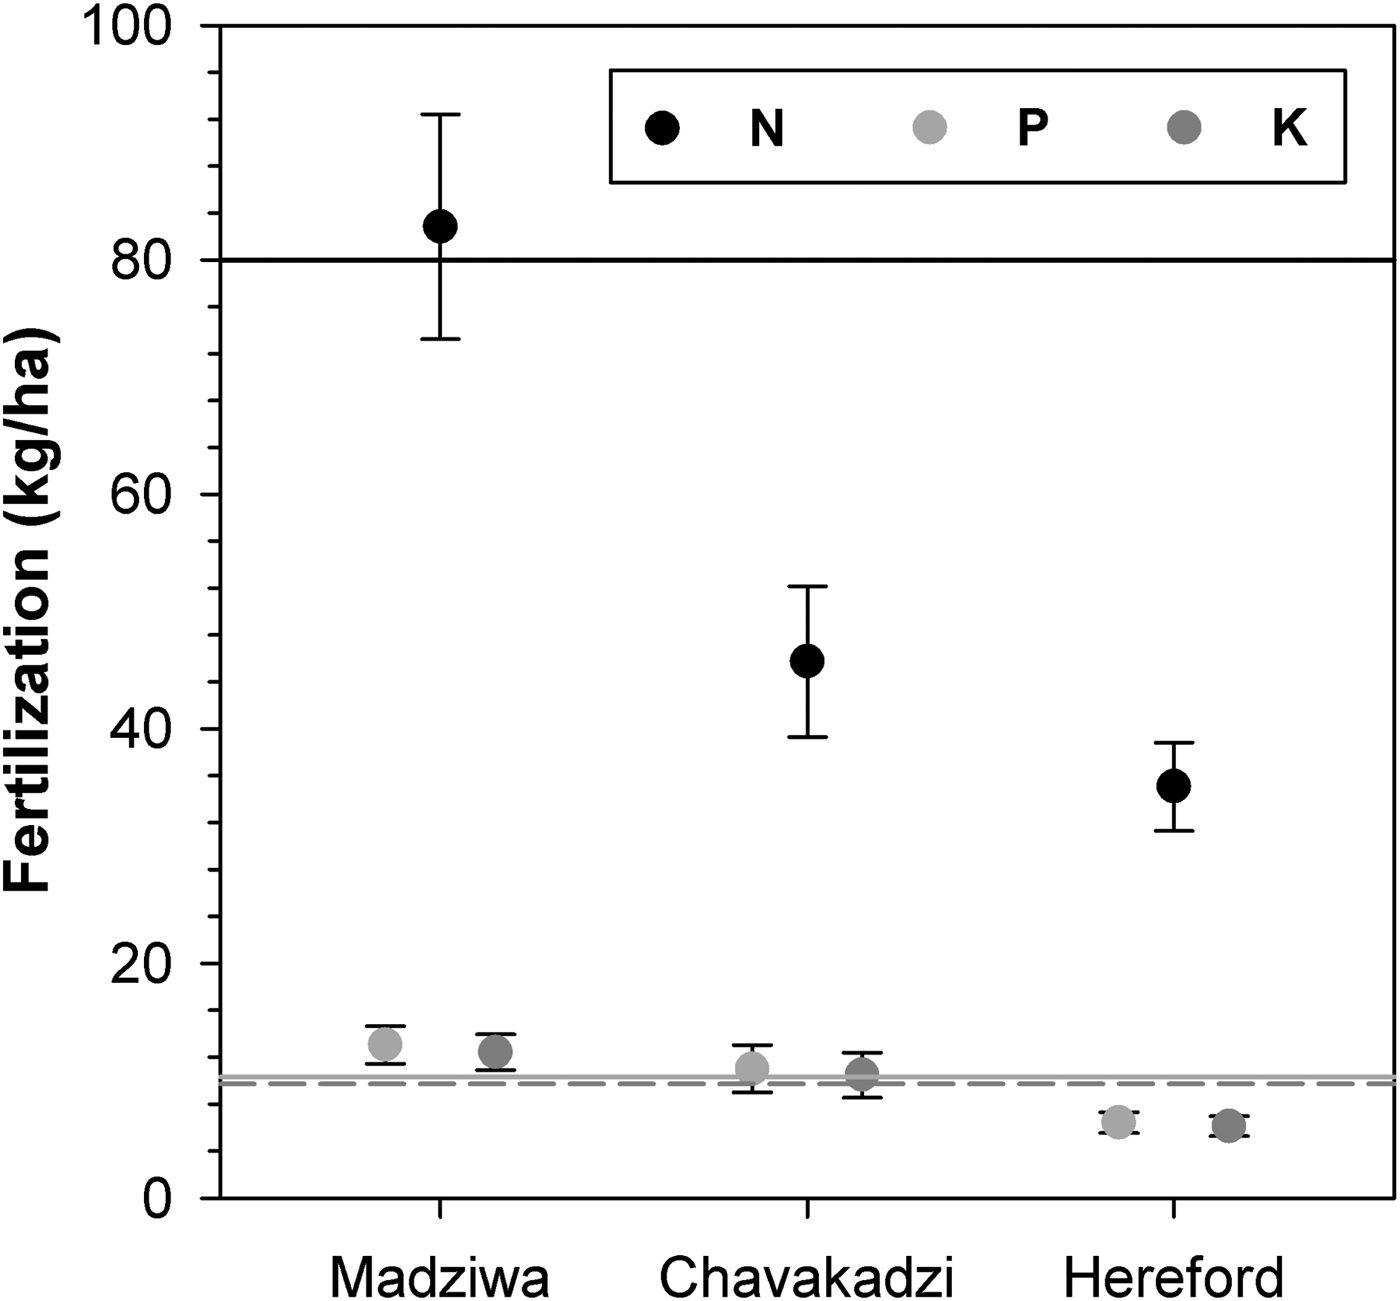
Fertilizer application on maize was lower in farmers’ fields than in the demo-trials in Chavakadzi and Hereford, while in Madziwa they were comparable (Fig. 5). In Chavakadzi, basal fertilization on farmers’ fields was similar to the amounts applied on the demo-trials (11N : 10P : 10 K kg/ha). The observed difference in fertilization largely resulted from much lower topdressing rates (c. 26 kg N/ha compared with 69 kg N/ha applied on the demo-trials). In Hereford, lower rates of fertilizer were applied for both basal and topdressing (c. 7N : 6P : 6 K kg/ha and 21 kg N/ha). In Madziwa, farmers on average fertilized their maize with 200 kg basal fertilizer/ha (14N : 12P : 12 K kg/ha; slightly higher than the fertilization rate on the demo-trials) and 200 kg/ha of topdressing (69 kg N/ha). The highest variability in maize field fertilization was recorded in Madziwa, indicating diverse management choices (Fig. 5).
Average amount of chemical fertilizer (in kg/ha of nitrogen (N), phosphorus (P) and potassium (K)) applied to maize in farmers’ fields in Chavakadzi (n = 29), Hereford (n = 47) and Madziwa (n = 53) between 2011 and 2014. As a reference the horizontal lines display the amounts applied on the demonstration-trials: 80 kg/ha N (continuous black line), 10 kg/ha P (continuous grey line) and 10 kg/ha K (dashed grey line).

Fertilizer cost v. potential income in maize production
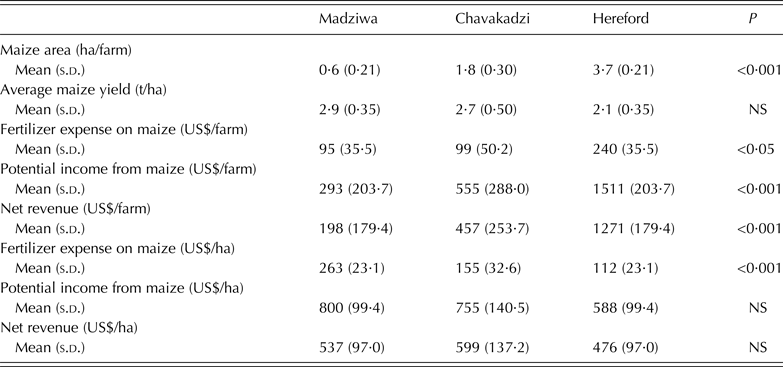
The fertilizer amounts and costs referred to in this paragraph are limited to maize production only. Fertilizer used by farmers for other crops (i.e. cotton, tobacco, soybean) was not considered. Farmers in Hereford spent much more money on fertilizer (US$240) than in Chavakadzi (US$99) and Madziwa (US$95) (Table 4). The significantly larger maize area in Hereford (3·7 ha) as compared with the other two sites (Chavakadzi 1·8 ha; Madziwa 0·6 ha) explains this larger expenditure. On a per hectare basis, farmers in Madziwa spent significantly more money on fertilizer than farmers in Chavakadzi and Hereford, but the higher investment did not translate into increased income. No significant difference in potential income (US$/ha) was found between the three sites. That is, if farmers were to sell all their harvest from 1 ha they would earn the same amount of US$. This lack of return on investment for Madziwa farmers is due to the poorer soils.
Average per farm of total fertilizer cost on maize and potential income from maize in Madziwa, Chavakadzi and Hereford

NS, not significant.
Soil surface nutrient budget
The soil surface nutrient budget calculated for N, P and K showed that average mineral fertilizer amounts applied in Madziwa equated to the N exported from the fields through both grain and stover harvested (Fig. 6). In Chavakadzi, N fertilization only covered the nutrient exports through the harvested maize grain and at Hereford slightly more N was exported through the grain than added in the form of mineral fertilizer (Fig. 6). The amounts of P applied were sufficient to cover the exports via the grain at Madziwa and Chavakadzi but not at Hereford (Fig. 6). Potassium fertilization was too low to cover for exports in harvested produce at the three sites, especially if grain and stover exports were considered. The full exportation of stover through cattle grazing on crop residues led to a negative P and K balance at all sites and to a negative N balance at Chavakadzi and Hereford. Cattle droppings occurred during free grazing in the dry season but at night, animals were kept in kraals and most manure was collected there. This manure is applied to fields before planting but farmers explained that only a few fields receive manure in a given year. Nutrient deficiencies were not only apparent from the relatively low yields in the three sites investigated in the current study, but could also be observed in the field. Symptoms of N and P deficiencies, for example, were observed in fields at all three sites.
Average and standard errors for nutrient inputs through mineral fertilizer (nitrogen (N), phosphorus (P) and potassium (K)) and exports through harvested produce from farmers’ maize fields in Madziwa, Chavakadzi and Hereford.

Tillage and mulching practices on farmers’ fields
At Chavakadzi and Hereford most farmers’ fields were ripped (18 out of 22 for Chavakadzi and 32 out of 40 for Hereford) instead of ploughed (Fig. 4). During the interviews, farmers pointed to the labour and time savings that can be realized with ripping. Most farmers ripped with a mouldboard plough rather than a ripper tine. Farmers would hold the plough in such a way that it merely opens a furrow instead of inverting the soil surface of the field. It was observed that after this ‘plough-ripping’, farmers used the plough to close the lines, simply by passing next to the planted line in the opposite direction. This was much quicker than covering seed and fertilizer using a hand hoe. Although this way of closing the lines disturbed the soil more than conventional ripping, it can still be considered as reduced tillage when compared with ploughing because the proportion of the field surface disturbed using this method is considerably less than in conventional tillage. Farmers have thus generally adopted the CA principle of reduced soil disturbance as introduced in the on-farm demo-trials. However, reduced tillage was not practised for all crops. For instance, tobacco fields were often ploughed and/or ridged. Unlike reduced soil disturbance, permanent soil cover (CA principle 2) was hardly practised. Farmers have not increased mulch levels on their fields, considering this to be too laborious. Burning of crop residues has been abandoned as a land cleaning method but free grazing during the dry season is still common and crop residue levels as a consequence were usually low at seeding time.
In Madziwa, ploughing was still common (21 out of 50 fields) (Fig. 4). However, some farmers have adopted the CA principle of minimum soil disturbance by digging planting basins on some parts of their land. Basin-planted fields were generally small (0·05–0·15 ha), close to the homesteads and generously mulched (up to full soil coverage). Of the 11 basin-planted fields, ten out-yielded the CA-RI demo-trial treatment, but only three were fertilized at a higher rate (Fig. 4).
Across the three sites very few farmers’ fields (12) were planted with an ox-drawn direct seeder (Fig. 4). Farmers appreciated the precision, ease and speed with which a field can be seeded using a direct seeder, but for various reasons they did not invest in one and the particular type of direct seeder used is not readily available on the local market. The direct seeder that farmers used was invariably borrowed from the on-farm demo-trial project, but as they had to take turns, the number of farmers who could use the machine to seed fields was limited.
Crop rotation and fallowing
Fallow land and land allocations to different crop categories
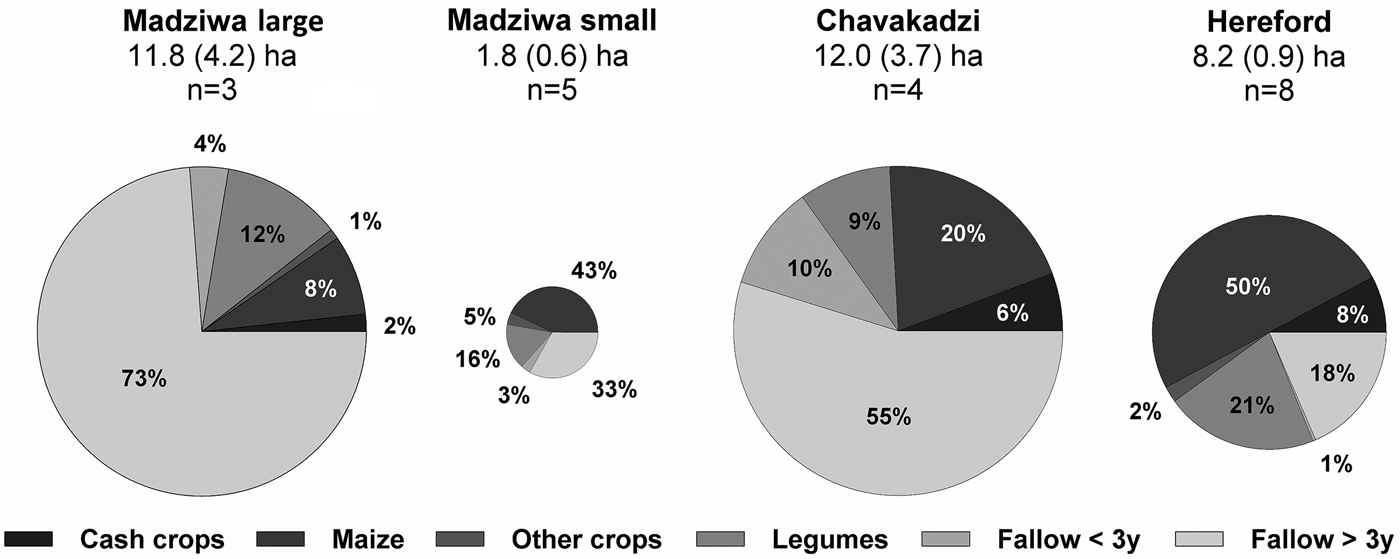
Across the three sites studied farmers did not cultivate all their land. Fallow land accounted for 0·19 of farmers’ total land area in Hereford, 0·65 of the farm land in Chavakadzi and 0·32 and 0·76 in Madziwa small and large farms, respectively (Fig. 7). This suggests considerable scope for crop rotation if farmers would include fallow land in their rotation schemes. Yet, as Fig. 7 shows, only a small proportion of the fallow land had been cropped in the last three seasons. Hence, farmers only included fallow in their rotations to a limited extent. While fallowing was common at all sites, at Hereford the land area that remained fallow was relatively small compared with the other sites and consisted largely of unusable land (contour ridges, gullies). In this relatively recently resettled area, farmers cultivate not merely for productive reasons, but also to reinforce their claim on the land. In Madziwa, it was found that farmers with large farms had about six times more land than those with small farms; however they still only cropped about twice the land area of small farmers.
Averages of total farm size and land allocations to different crop types and fallow land for Madziwa large and small farms, Chavakadzi and Hereford. The number of farmers (n) interviewed, the average farm size (ha) as well as its standard deviation (in brackets) are indicated for each site. The varying diameter of the circles represents the differences in average farm size.

The land areas farmers allocated to different crops was site-specific (Fig. 7). In the case of Madziwa, where farmers were subdivided according to landholding size, such land allocations were also farm-size dependent. For instance, cash crop production was more important in Hereford and Chavakadzi than in Madziwa, where only farmers with large farms grew cash crops and only on a small area of their land. In Madziwa, the proportion of total area given to maize was larger on small farms, but the absolute maize area cultivated on large and small farms in Madziwa did not differ much (0·7–1·0 and 0·4–0·8 ha, respectively; Table 1). In Chavakadzi and Hereford, land allocations to different crops were very different (Fig. 7). In Chavakadzi the average farm size recorded was 12 ha, of which on average only 0·35 was cultivated. The largest share of farmland was allocated to maize (0·20), followed by legumes (0·09) and cash crops (0·06). In earlier years cotton was grown as a cash crop, but prices have dropped and so tobacco has become the main cash crop grown. Other crops (e.g. sunflower) were not grown on a regular basis, or were grown on such small areas that farmers did not even mention them. In contrast, Hereford farmers allocated half of their land to maize production, 0·21 to legumes, 0·08 to cash crops and 0·02 to other crops (e.g. sunflower, but also sorghum or millet were recorded).
Crop sequences and their rationale
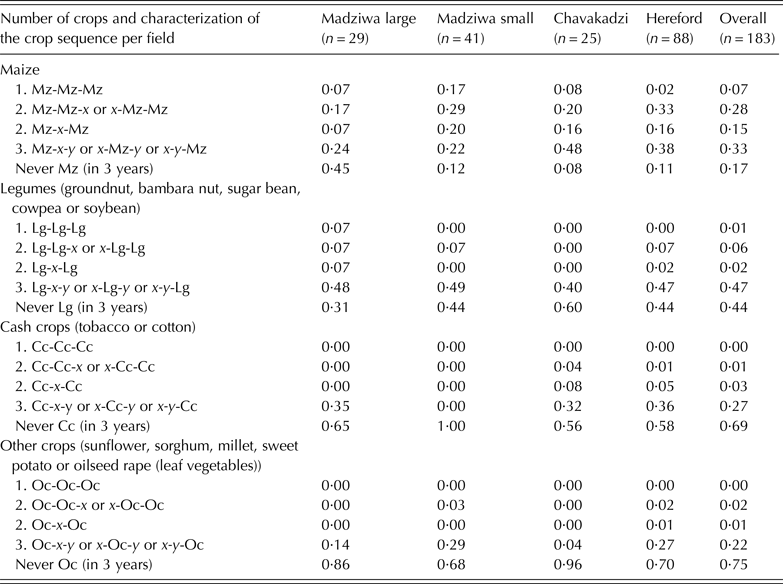
Crop rotation was found to be common practice at all sites (Table 5). Analysing 3-year crop sequences it was found that 3 years of continuous maize or legume cropping only occurred on 0·07 and 0·01 of farmer fields, respectively. Three consecutive years of cash crops or other crops were not observed. This shows that farmers were able to practise crop rotation, despite the predominance of maize in the cropping system. Across the three sites 0·83 of fields were grown with maize at least once every 3 years, while legumes were grown at least once in 3 years in only 0·44 of the cases. Cash crops (cotton and tobacco) were mainly grown in Chavakadzi and Hereford, but 0·55–0·60 of fields had no cash crop grown for at least 3 years in a row. In Madziwa only farmers with bigger landholdings grew cash crops and only on 0·14 of their fields once in 3 years.
Frequency (proportion) of 3-year crop sequences by crop category on farmer fields. The number of fields (n) recorded at each site is indicated in brackets

Focusing on the ten most common 2-year crop sequences, the dominance of maize in all three sites was again immediately apparent (Table 6). Of these ten, nine crop sequences included maize at Hereford, eight at Chavakadzi, and five and seven in large and small farms, respectively, at Madziwa. In addition, maize after maize was the most common crop succession observed in all three communities covering 0·10–0·32 of the fields and 0·15–0·37 of the cropped area. Two consecutive years of fallow was commonly observed in both Chavakadzi and Madziwa (but not in Hereford). Across the three sites maize was commonly grown after a legume (groundnut, sugar bean or soybean), which suggests that farmers know about the fertility benefits of such a practice. Another common crop sequence was maize after a cash crop (cotton or tobacco): practised on 0·14 and 0·17 of the fields in Chavakadzi and Hereford, respectively. Cash crops were usually grown under contract-farming arrangements which include fertilizer provision and farmers explained that they grow maize after a cash crop to make use of residual fertilizer effects. Farmers also mentioned practising crop rotation for disease management and in fact, except for maize fields, very few fields were observed to be cropped for 2 consecutive years with the same crop.
Frequency (proportion) of specific 2-year crop sequences in fields of Madziwa large, Madziwa small, Chavakadzi and Hereford. The proportion of the total area of the ‘n’ number of fields allocated to a specific crop sequence is given in brackets*

Mz, maize; Cc, cash crop: cotton or tobacco; Sy, soybean; Gn, groundnut; F, fallow; Sf, sunflower; Pt, sweet potato; Sb, sugar bean.
* Fields that have been fallow 3 or more years are not considered in this table.
DISCUSSION
Knowledge gaps as a problem of technology adoption?
While it was found that the YG between the on-farm demo-trials and farmers’ maize fields is not closing after years of on-farm experiments, interviews and observations of farmer practise revealed that demo-trial-hosting farmers have gained considerable knowledge about CA. The closing knowledge gap on CA is not only evidenced by demo-trial hosting farmers’ ability to explain the benefits of CA as commonly put forward in the scientific literature and extension materials. Demo-trial hosting farmers also adopted specific CA practices on their farms or adapted these to suit their needs and circumstances. For instance, minimum tillage practices such as planting basins, ripping and direct seeding were widely practised at the study sites, either following the example of the demo-trials or, as in the case of planting basins, following the recommendations made by other (project) interventions. Planting basin-based CA has been widely promoted in Zimbabwe as part of humanitarian relief programmes in the 2000s (Andersson & Giller Reference Andersson, Giller, Sumberg and Thompson2012). At some sites ‘plough-ripping’ has emerged as an adaptation that combines the advantages of ripping with the ease and fast covering of seeds with soil, using the mouldboard of the plough.
Other practices demonstrated and tested in the on-farm demo-trials, such as crop rotation (CA principle 3), are also widely practised by demo-trial hosting farmers. Promoted to Zimbabwean farmers since the 1920s (Bolding Reference Bolding, Bolding, Mutimba and van der Zaag2003), and still part and parcel of the Master Farmer training that most demo-trial hosting farmers have received, crop rotation is not a practice that they learned from the demo-trials. Although crop rotation is extensively practised – informed by soil fertility and disease management considerations – its extent is mostly limited by the predominance of maize in the cropping systems.
For other CA-related practices, demo-trial hosting farmers’ learning has not resulted in their adaptation or adoption of the technology. Crop residue retention or mulching (CA principle 2), as implemented in the on-farm demo-trials, is not practised on farmers’ fields. Competing uses for crop residues – as livestock feed – is commonly cited in the literature on CA as a factor hampering adoption and this applies also to the sites studied (Erenstein Reference Erenstein2003; Giller et al. Reference Giller, Witter, Corbeels and Tittonell2009; Valbuena et al. Reference Valbuena, Erenstein, Homann-Kee Tui, Abdoulaye, Claessens, Duncan, Gérard, Rufino, Teufel, van Rooyen and van Wijk2012, Reference Valbuena, Homann-Kee Tui, Erenstein, Teufel, Duncan, Abdoulaye, Swain, Mekonnen, Germaine and Gérard2015). However, even in Chavakadzi and Hereford, where there is substantial (fallow) land and therefore no apparent competing use for crop residues, farmers did not make an effort to protect crop residues – for instance through fencing, off-season storage of residues, or collective arrangements – from being grazed by free-roaming cattle in the dry season. In short, acquired knowledge and experience on residue management, and CA at large, did not result in full CA cropping systems on farmer fields.
Adoption dynamics and the socio-ecological niche for CA: markets and rural livelihoods in Zimbabwe's Communal Areas, old and new Resettlement Areas
To understand the CA adoption dynamics of trial hosting farmers in the different farming areas, and especially their limited interest in CA-based land use intensification, it is useful to consider the performance differences between trial treatments and farmer fields, the partial adoption and adaptation of CA practices, farmers’ production orientations and the wider market environment.
Conservation agriculture's yield effects: their visibility and farm-level replicability/applicability
Firstly, as earlier studies showed, there is a strong relationship between total annual rainfall and maize yield (Smith Reference Smith1988; Rusinamhodzi et al. Reference Rusinamhodzi, Corbeels, van Wijk, Rufino, Nyamangara and Giller2011). Although yield benefits of CA have been found to build over time (Thierfelder et al. Reference Thierfelder, Chisui, Gama, Cheesman, Jere, Bunderson, Eash and Rusinamhodzi2013b ), Thierfelder et al. (Reference Thierfelder, Matemba-Mutasa and Rusinamhodzi2015b ) found that the influence of season on maize yields is far stronger than the number of years of CA practise. Hence, the superiority of the CA treatments is not immediately apparent to the observer or implementer of the on-farm demo-trials, which can be seen as undermining the very purpose of on-farm demonstration.
Secondly, differences in fertilizer inputs were found to have a far greater effect on the observed YGs between trial treatments and farmers’ fields than did CA. These findings are in line with the increasingly accepted view in the literature on CA that sufficient fertilization is a prerequisite for CA to have any positive yield effects (Ngwira et al. Reference Ngwira, Aune and Thierfelder2014; Vanlauwe et al. Reference Vanlauwe, Wendt, Giller, Corbeels, Gerard and Nolte2014). In addition, any possible yield benefits resulting from practising CA components, such as minimum tillage that enables early planting, are likely to remain obscured in the generally under-fertilized fields of demo-trial hosting farmers. Farmers in the study sites realized this need for fertilization, as evidenced by a Hereford farmer's statement during a field visit: ‘The problem is fertilizer. If you get into this (CA) system without fertilizer, then you are a write-off that year’ (informal interview with resettlement farmers during field visit, Hereford, Zimbabwe 26 February 2013).
The driver of partial conservation agriculture adoption and adaptation: labour savings
Without clearly visible yield benefits, Hereford and Chavakadzi farmers’ partial adoption of CA practices – ripping – was not motivated by yield considerations. Nor did erosion control appear an important consideration among farmers; the uptake of minimum tillage practices was not accompanied by an uptake of run-off reducing mulching practices. As found for large-scale mechanized farming in the Americas, Australia and South Africa, cost savings and increased speed of operations motivated their adoption of reduced tillage (Fowler & Rockström Reference Fowler and Rockström2001). Farmers interviewed in Hereford and Chavakadzi pointed to the labour and time savings that can be realized with ripping. Draft power is a limited resource; a span of oxen can be used to work in the fields only 4–5 h a day and most farmers do not have more than one span. Not having to plough enables farmers to prepare for seeding much more quickly. As planting windows are relatively short in Zimbabwe, this is an important advantage of ripping. Labour-saving considerations are also apparent in weed control practices. To address the increased weed pressure in reduced tillage fields that have little residue cover, farmers in Chavakadzi often resort to the use of a cultivator; another example of technology adaptation. In Hereford, farmers stressed the need for herbicides for weed control.
In Madziwa farmers hardly adopted any mechanized CA practice evaluated in the on-farm demo-trials. The potential for labour savings through the adoption of CA practices was therefore absent. As the YG between the CA trials and farmer fields was negative, the demo-trials obviously did not motivate farmers to try and increase yields through CA. Madziwa farmers indicated they prefer ploughing because, without residue retention, the weed pressure on reduced tillage plots is too high and herbicides are too expensive. Nevertheless, some farmers practised planting basins and crop residue retention on small fields close to homesteads. The maize yields achieved by farmers on these fields usually outperformed the ones on the demonstration-trials. A likely explanation for this is that a history of high levels of management and input use on fields near homesteads has resulted in improved soil fertility (Zingore et al. Reference Zingore, Murwira, Delve and Giller2007a , Reference Zingore, Murwira, Delve and Giller b ). However, the location of these planting basin fields close to the homestead also limits options for crop rotation. Farmers indicated that they prefer to plant legumes further away from the house because chickens can destroy their flowers. Moreover, the size of these ‘almost CA’ plots is limited by the high labour requirements for land preparation and weeding (Rusinamhodzi Reference Rusinamhodzi2015).
The concept of rotation is known, but maize dominates the system
Rotations, which break disease cycles and can improve crop performance when legumes are incorporated, are widely practised in all of the sites studied. Discussions with farmers confirmed that they were already aware of the benefits of crop rotation before the start of the CA demo-trials. Observed crop rotation practices on farmer fields are therefore neither the result of a knowledge gap or a closure of such a gap. They largely result from the dominance of maize in the cropping system, fertility and disease management considerations, field characteristics (e.g. avoiding planting legumes on waterlogging prone area), farmers’ personal preferences and non-agronomic factors such as gendered crop cultivation practices. For instance, in many parts of Zimbabwe husbands allocate their wives a small area of the farm to grow their crops. Groundnut, leaf vegetables and some other crops – which may be regarded as ‘women's crops’ – grown on these plots may thus not be included in the larger farmer's crop rotation sequence. The current good market for soybean is an opportunity that might lead to an increase in the farm area where crop rotations are practised; however, cash flow constraints – i.e. for soybean seed purchase, which is much more expensive than maize seed – are still a limiting factor for growing more soybeans.
Farmers extensify rather than intensify
Besides the small planting basins fields in Madziwa's homesteads, a lack of interest in increasing yields through CA adoption among the trial-hosting farmers is an issue at all study sites. Indications of this disinterest are the large areas of uncultivated land on the farms of trial-hosting farmers, as well as their focus on achieving a particular maize production output (for food security), rather than a particular yield level. In a situation of relative land abundance (and perceived insecure tenure in the case of Hereford), high fertilizer prices, labour-limited production and low producer prices, there is simply no drive to increase maize yields. These findings are similar to those of Baudron et al. (Reference Baudron, Andersson, Corbeels and Giller2012), who showed that on the relatively fertile soils of an agricultural frontier zone in northern Zimbabwe, farmers embarked on an extensification rather than a land use intensification farm development pathway. Cash-constrained Hereford and Chavakadzi farmers cultivate maize with relatively low levels of input, resulting in the recorded negative nutrient balances at these sites. On Madziwa's poor, sandy soils, pursuing an extensification farm development pathway is more difficult. Here, the use of fertilizer is crucial to achieve any yield. The current study's analysis showed that in Madziwa significantly more financial resources were invested in mineral fertilizer (on a hectare basis) to achieve maize grain yields similar to the other two sites. However, farming households in all sites do not strive to maximize yields, but target an output-level for maize that meets household food needs. Farmers are thus unlikely to invest in land use intensification to achieve higher yields for their maize crop, the primary crop used in the on-farm trials.
From the above it follows that for farmers in Chavakadzi, Hereford and Madziwa, maize is primarily a food crop. Any marketable surplus of this crop they generate can be regarded as what Allan (Reference Allan1965) has called the ‘normal surplus’, that is, production beyond what was targeted for household use. Growing one's own maize appears to be a strong social force in all farming areas studied, despite different livelihood orientations in the sites. For instance, in Madziwa, where households are not primarily farming-oriented, maize production is largely financed through other income-generating activities. As substantial investments are needed to produce enough maize for food needs, it may be cheaper for Madziwa households to buy their maize than to grow it themselves. In Chavakadzi and Hereford livelihoods are primarily farming-based, and agricultural production is more commercially oriented. Here, tobacco and soybean are the main crops grown for sale. Revenue from maize production is low and would probably not be economical if higher levels of inputs would be used for its production. Hence, the different farm practices and livelihood orientations that can be observed in the three study sites may be indicative of different socio-ecological niches, none of which are particularly suitable for CA-based land use intensification.
Increasing yield gaps in Zimbabwe's most productive areas
In Chavakadzi and Hereford, the Resettlement Areas located on Zimbabwe's more productive soils, declining maize yields on farmers’ fields and increasing YGs were observed. The soil surface budget for N, P, K showed that fertilizer rates applied at these two sites did not cover nutrient exports from crop production, particularly as residues were generally also exported. The presented soil surface nutrient budget only considered mineral fertilizer input and nutrient export through the produce, ignoring inputs through manure and losses through leaching, erosion, volatilization and denitrification. Manure inputs could not be quantified in the current study but for similar smallholder settings it was shown that the amounts of manure applied are low and the quality poor, as most nutrients are lost by the time the manure reaches the field (Rufino et al. Reference Rufino, Rowe, Delve and Giller2006). This might not apply for the less mobile nutrients such as P. Nevertheless, a likely long-term effect of this nutrient mining is soil nutrient depletion. Chavakadzi and Hereford farmers may thus increasingly find themselves in a similar situation to Madziwa farmers, who already have to apply higher fertilizer rates to sustain crop production.
CONCLUSIONS
As the current study has shown, farmers increased knowledge of CA did not result in full adoption of this cropping system on their farms. When comparing experimental plot data with yields on farmers’ fields, no evidence was found that a closing knowledge gap for CA resulted in closing YGs. A limited capacity and reach of the existing knowledge providing infrastructure is undoubtedly an important factor hampering large-scale adoption of new farming technologies in many African countries. Yet, the view that ‘CA is more knowledge-intensive than input-intensive’ (Wall Reference Wall2007) appears an insufficient explanation for farmers’ limited interest in CA-based land use intensification in different smallholder farming areas in Zimbabwe. Input constraints (especially fertilizer), combined with low producer prices, result in large areas of uncultivated land, even in densely populated Communal Areas, such as Madziwa. Where farmers do make an effort to cultivate all their land, as in Hereford, this is motivated by land tenure security considerations and accompanied by lower rather than higher yields.
While other studies have argued that the yield-increasing effects of CA are limited in general, and specifically to low and erratic rainfall areas (Pittelkow et al. Reference Pittelkow, Liang, Linquist, van Groenigen, Lee, Lundy, van Gestel, Six, Venterea and van Kessel2015), the current study shows that even if there are yield effects of CA, these often remain invisible to farmers because rainfall and fertilization levels are far more important determinants of yield than the CA-related practices evaluated in the on-farm demonstration-trials.
Although it was found that farmers with different production orientations do adopt and adapt different CA practices, uptake was motivated by (labour) cost-saving considerations, rather than yield improvement or environmental (soil erosion) considerations. High input prices and low producer prices constitute a powerful disincentive for investments in land use intensification. This argument is particularly true for maize, the focal crop in the on-farm demonstration-trials. In the areas studied, maize production is hardly profitable, and its production is therefore primarily motivated by food security considerations, rather than yield maximization. Hence, closing YGs appears to be an interest of researchers, rather than labour and input-constrained African smallholder farmers.
The current study was carried out under the CGIAR Research Program (CRP) on MAIZE. The on-farm demonstration-trials studied were implemented in the context of the project ‘Understanding the Adoption and Application of Conservation Agriculture in Southern Africa’ financed by the International Fund for Agriculture Development (IFAD). The Swiss Agency for Development and Cooperation (SDC) is acknowledged for funding the PhD position within which the research was carried out. For their indispensable support during the farm walks and interviews Blessing Mhlanga, Sign Phiri and Herbert Chipara are thanked. And most importantly: this study would not have been possible without the interviewed farmers who agreed to spend time answering questions and showing their farm, thank you.
ACKNOWLEDGEMENT
The original version of this article was published with an omission from the title. A notice detailing this has been published and the error rectified in the online PDF and HTML copies.