I. INTRODUCTION
The synthetic methods for preparation of CdSe nanocrystals (NCs) have improved over the past decade by optimizing the precursors, ligands, and solvents. Since Peng's group Reference Peng and Peng1 used an alternative Cd source instead of an unstable, explosive, highly toxic, and pyrophoric dimethyl Cd to prepare high quality cadmium chalcogenides, CdO has been widely used to prepare Cd chalcogenide NCs. Reference Peng and Peng1–Reference Yu, Singh, Patrito and Chu4 In these methods, an additional preparation process of high temperature above 250 °C was used for the Cd ions to bind to the ligand. However, the expensive and toxic phosphine derivatives were still reported to be used as coordinating ligands in the above synthetic procedures. This often limited the production of QDs in organics to milligram quantities and the need for synthesis of CdSe NCs in phosphine free organics Reference Li, Wang, Xie, Zhu and Zhao5,Reference Liu, Jiang, Wang, Li, Ln, Chen and Zhong6 had gained importance. After a decade, Peng's group Reference Yu and Peng7 reported the replacement of ligand, trioctyl phosphine oxide (TOPO) by oleic acid and oleic acid was used as a capping ligand for the NCs in the presence of a long chain alkene 1-octadecene (ODE) as a solvent. The capping agent's ability to avoid particle agglomeration and promote nucleation was an important aspect in such synthesis of arrested precipitation. In general, phosphine free ligands like carboxylic acids, Reference Li, Wang, Xie, Zhu and Zhao5 mercaptans, and amines Reference Liu, Jiang, Wang, Li, Ln, Chen and Zhong6 that absorb quickly to bare particle surface to minimize the Van der Wall's interactions and interactions within crystallites by steric hindrance and solvation forces were identified as efficient capping agents. Ligands which bind strongly to monomers as soluble complexes would enhance the rate of nuclei growth, but decrease the rate of nucleation. Contrarily, if ligands bind to NCs surface to form insoluble surface precipitate, both the growth of nuclei and dissolution are kinetically hindered to form small sized and more numbered NCs. Hence, a combination of two ligands (one of them being a phosphine ligand) was experimented by Van Embden et al. for better yield and quality of NCs. Reference Embden and Mulvaney8 The present study reports a unique combination of oleic acid (OA) and octadecyl amine (ODA) as a binary ligand system for optimization of nucleation rate (number), nuclei growth (size), and monodispersity during a less hazardous and nonorganometallic routed (CdO as Cd precursor) NC synthesis. Oleic acid molecules are known to bind to Cd atoms Reference Li, Wang, Xie, Zhu and Zhao5 while ODA molecules surround CdSe NCs as a dense layer due to their surface binding.
Further the choices of solvent for the synthesis of NCs are equally important, particularly for scaling up the production of NCs. CdSe NCs are currently available commercially, but are relatively expensive. Many research groups Reference Reiss, Bleuse and Pron3,Reference Embden and Mulvaney8,Reference Al-Salim, Young, Tilley, James McQuilan and Xia9 have reported ODE as an ideal solvent for good nucleation and growth kinetics during NC synthesis, but ODE accounts to majority of material cost in preparing one batch of CdSe QDs. This has led to the replacement of ODE by a combination of unsaturated oils like olive oil which is much cheaper. Reference Sapra, Andrey Rogach and Feldmann10 The present study reports the use of a long chain alkane N-octadecane (NOD) as a solvent at relatively low temperatures (190–220 °C). Attempts have also been made to replace ODE with alkanes, Reference Washington and Strouse11 but study on feasibility of its reuse is new of its kind. The paper demonstrates the use of this reusable solvent as a model solvent to replace the ODE for the synthesis of NCs, which may have a significant effect on prevention of the formation of unsaturated hazardous compounds. The work also aims to understand the effect of replacement of ODE by another heat transfer fluid N-octadecane with compatible properties like better – viscosity, heat capacity, boiling point, stability and melting point and reactivity as represented in Table 1 of the supporting information. The study of synthetic profiles which represented a set of NCs prepared by the proposed method and their characterization was necessary to substantiate the absence of any adverse effects on the quality of NCs obtained.
II. EXPERIMENTAL
A. Materials and methods
Chemicals used were cadmium oxide (99%, Aldrich), selenium (99% Fluka), octadecyl amine (90%, Aldrich), trioctyl phosphine (TOP, 90% Fluka), oleic acid (90%, Merck), N-octadecane (99.9%, Aldrich), and 1-octadecene (90%, Sigma Aldrich). The solvents ethanol and toluene were of AR grade from Merck.
B. Synthesis of nanocrystals
The protocol used for the synthesis of NCs was similar to the one described in Ref. Reference Yu and Peng7. All the reactions were performed in a 100-mL three necked round bottomed flask under a N2 atmosphere. 4.0 g of NOD and 0.34 g of ODA were heated to dissolution, once dissolved 13 mg of CdO was added and degassed followed by the addition of 0.5 mL OA. The above reaction mixture also named as mother solution was degassed again at 80 °C for 2 min prior to being heated to injection temperature (IT) of 200 °C. At this stage, 0.076 g of Se precursor (prepared by mixing 0.5 mL of TOP and 4 g of NOD at 150°) was swiftly injected into the mother solution. The temperature falls and was allowed to rise back to a growth temperature (GT) of 190 °C and the aliquots were collected from the stirring NCs at every 20 s interval. The NCs growth was quenched in toluene and the crude CdSe NCs were purified by precipitation with ethanol followed by centrifugation at 5000 rpm for 10 min. The purified NCs were resuspended in toluene and used for characterization. One set of NCs synthesis was also conducted with ODE as the solvent (as reported by Peng and coworkers) for a comparative study of the solvent effect. Particle sizes, molar extinction coefficient, and concentration of NCs were calculated as per Yu et al. Reference Yu, Qu, Guo and Peng12 Photoluminescence quantum yield (QY) was determined by comparing the PL intensities of the NCs with that of Rhodamine B.
An attempt was made to calculate the exact quantity of NOD and ODE in the recovered samples through gas chromatography mass spectrometry (GCMS) analysis. Accurate quantities of 0.0175 g of ODE pure and 0.0306 g of ODE sample made upto 25 mL and 0.0051 g of NOD pure and 0.0038 g of NOD recovered made upto 50 mL using n-hexane were used for quantitative estimations. Equal volumes of these solutions were injected for a quantitative analysis. The total ion chromatograms of both pure and recovered sample were evaluated for the responses that are obtained only due to the peaks at 5.418 min (for NOD) and 5.37 min (for ODE). Then the responses recorded for the actual content of ODE/NOD in the recovered sample were used for calculating the purity by using the below equation Reference Hubschmann13
 $$\% \;{\rm{Purity}} = {{{\rm{Peak}}\;{\rm{area}}\;{\rm{with}}\;{\rm{recovered}}} \over {{\rm{Peak}}\;{\rm{area}}\;{\rm{with}}\;{\rm{pure}}}} \times {{{\rm{Standard}}\;{\rm{weight}}\;{\rm{pure}}} \over {{\rm{Recovered}}\;{\rm{sample}}\;{\rm{weight}}}}\quad {\rm{.}}$$
Instrumentation: All the property–structure measurements were performed without any post-preparative size sorting, at room temperature and at atmospheric pressure. Absorption (Ab) spectra were recorded using Shimadzu UV 1800 PC spectrophotometer (Shimadzu, Kyoto, Japan). Photoemission (PL) experiments were performed on a Shimadzu RF 5301 PC spectrofluorometer. Powder x-ray diffraction (XRD) patterns were recorded using a Shimadzu 7000 diffractometer with Cu Kα radiation and a scan rate of 4°/min. The high resolution transmission election microscopy (HRTEM) images were obtained from JEM-2010 electron microscope (JEOL, Tokyo, Japan) at an accelerating voltage of 200 kV. Carl Zeiss field emission scanning electron microscope (FESEM) conjugated with energy dispersive x-ray spectrometry (EDS) was used for FESEM micrographs and EDS patterns. Dynamic Light Scattering was done using Malvern Nano DLS (Malvern Instruments Ltd., Malvern, UK). Attenuated total reflection infrared (ATR-IR) spectra were recorded using a Bruker Eco-ATR IR (Bruker Corporation, Billerica, MA). Agilent technologies 6890N network GC system (Agilent, Santa Clara, CA) with 5973 inert mass selective detector and PC-based data system GCMS system were used for GCMS analysis. 0.25-µm film thickness capillary column was used for separation. Oven was initially programmed for 180 °C for 2 min and increased with a ramp of 5 °C/min to 280 °C and maintained the same for 0.1 min. Inlet, MS Source, AUX-2, and MS QUAD were maintained at 260, 230, 280, and 150 °C, respectively. Injection volume was 1 µL and acquisition mode was scanned with a scan range of 50–550 amu.
Sampling: TEM samples were prepared by evaporating a drop of NC solution on a carbon-coated copper mesh grid. XRD, AFM, and EDS samples were prepared by drop casting the purified NCs on to a glass wafer. Samples for GCMS were prepared in chloroform. Absorbance and photoluminescence spectra were deduced for very dilute (0.1/3 mL of toluene) solutions of NCs. For AFM, a solution of NCs (dispersed in chloroform) dropped on mica was imaged in air using Bruker Dimension Icon AFM equipped with a Nanoscope V SPM controller operated in tapping mode. A silicon cantilever with resonance frequency 300–400 kHz and spring constant 42 N/m was used. AFM height images were presented after simple flattening using V9.0 Nanoscope software.
III. RESULTS AND DISCUSSION
A. Effect of binary ligand
Oleic acid is a potential metal site coordinating ligand (via oxygen) while TOP is a chalcogen site coordinating ligand (via protons). OA and ODA have essentially opposing roles in the growth of CdSe nanocrystals though both are complex forming agents added to the solvent and precursors prior to nucleation.
 $${\rm{Cd}}({\rm{OA}}) + {\rm{Se}} \to {\rm{CdSe-OA}} + {\rm{OA}}\quad {\rm{,}}$$
 $${\rm{Cd}} + {\rm{Se}} + {\rm{ODA}} \to {\rm{CdSe-ODA}}\quad {\rm{.}}$$
Solubilizing ligands such as oleic acid complexes with the cadmium monomer through reaction (1) lowering the supersaturation at all times and leading to poorer nucleation. Since the ligand has a strong affinity for the monomer, through complexation it pushes the precipitation reaction toward solubilization. Hence, the situation demands a ligand like ODA, which can increase the driving force for precipitation. The fact that the Cd–ODA complex has more free energy (than the ODA–CdSe surface complex) aids nucleation, reducing the latter's solubility. Hence, a combination of phosphine free ODA and OA was envisaged as a successful binary ligand to yield concentrated CdSe, with the required balance of nucleation and slow growth.
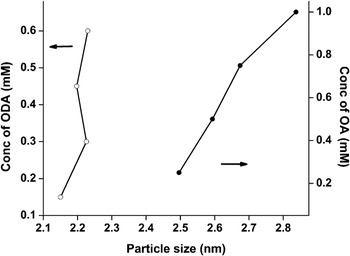
Figure 1 depicts the effect of individual ligand concentration on particle size (PS) during NC synthesis. Increase in concentration of OA drastically increases the PS (PS > 2.5 and rises up to 2.8 nm). ODA concentration seems to have little effect on nuclei growth. OA accelerates particle ripening and nuclei growth, but inhibits nucleation whereas ODA catalyses nucleation and very gradually improves growth to obtain small stable NCs. 0.5 M of OA and 0.3 M of ODA were individually observed to be optimum concentration for growth and nucleation and hence the same concentration was considered to be optimum for the binary ligand.
Changes in nuclei size for NCs (evolved at t = 60 s) synthesized with different concentrations of ODA and OA ligand.

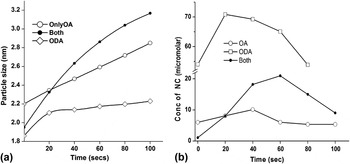
Figures 2(a) and 2(b) represent the effect of growth time on PS and concentration during synthesis of NCs using different ligands. An abrupt increase in nuclei growth or the early time ripening as shown in Fig. 2(a) for OA ligand resulted in a decrease in CdSe NCs concentration (decrease in nuclei number) [Fig. 2(b)] unlike the ODA ligand which facilitates the concentration of NCs to be eight times better. Small nucleus size of ≅2.0 nm in Fig. 2(a) is consistent with the expected improved nucleation for only ODA ligand while an abrupt increase in PS suggests denucleation and ripening causing less concentrated NCs for only OA ligand. Therefore, the proposed binary ligand was observed to optimize both the concentration and exponential growth of CdSe NCs. The obtained NCs from this binary ligand meet all the four fundamental parameters for high quality namely narrow size distribution, high crystallinity, moderate PL and QY, which shall be discussed in sections ahead. The systematic effect of the binary ligand is however substantiated more by AFM studies in further section.
Changes in nuclei size and concentration of CdSe NCs using different ligands during NC synthesis: concentration of OA = 0.5 mM, concentration of ODA = 0.34 mM.

B. Effect of NOD as solvent
For any lyothermic reaction, the temperature required for the nucleation is provided indirectly through convective heating of the precursor (via solvent). The excess energy controlled by heating the NOD solvent allows continuous growth and eliminates multiple nucleation events that can lead to loss of material dispersity. The accessibility of the monomer to the growing NCs can be controlled by a good viscous solvent. The solvent should merely act as a reaction moderator to control explosive growth. NOD being a better viscous and heat transfer fluid facilitates the decrease of reaction temperature (RT) and GT with no adverse effect on NCs quality. Reduction in IT and GT is one of the prominent observations in the above system, but it appears not to influence the NC size, shape, or quality and was involved only in precursor activation and subsequent nucleation.
The well-known 1-octadecene, although used as the solvent in many such ligand mediated CdSe synthesis, Reference Reiss, Bleuse and Pron3,Reference Embden and Mulvaney8,Reference Al-Salim, Young, Tilley, James McQuilan and Xia9 is very clearly one of the consumed molecules which cannot be reused. It is pertinent to mention the usage of TOP in the present study for the preparation of selenium precursor. Selenium is insoluble in NOD unlike ODE (ODE reacts with Se, solution turns yellow in color and loses its double bond characteristics as shown in the spectra of ATIR of supporting information Fig. 1). It requires some amount of TOP to cause chelation. However, this limitation needs to be overcome and shall soon be done with a suitable chelating agent and communicated as a new set of study.
The NOD in reality has the ability to selectively heat molecular precursors without involving in the reaction. An effort is made to substantiate the same after the isolation of NCs from the crude NC solution; ODA was separated by freezing the crude NC solution, followed by a wash with ethanol to eliminate OA and to collect back the used solvent. It is important to mention that the solvent NOD, being used for the GCMS and ATR-IR analysis was the one recovered the second time (obtained after reusing the first time recovered solvent for synthesis of second set of NCs). The TEM, UV-visible, and PL spectra for the synthesized NCs with the second time recovered NOD is as presented in Fig. 2 of supporting information and the quality of NCs appear to have not been affected.
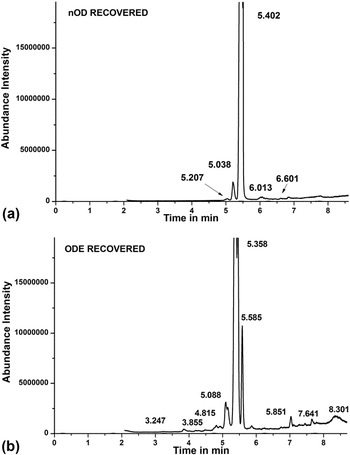
To demonstrate the undisturbed quality of NOD after reuse and to validate its reusability, the GCMS peaks obtained for the two solvents NOD and ODE before and after (recovered second time) the synthesis of NCs were identified with the help of NIST GCMS library. The spectra of the pure sample (Fig. 4 of supplementary information) were recorded before injecting the recovered samples. The prominent peaks eluted at 5.40 min and 5.35 min with m/z values of 254 and 252 are due to N-octadecane and 1-octadecene, respectively, and are present in both the plots ‘a’ and ‘b’ of Figs. 3 and 4 of SI. The actual content of NOD and ODE in the recovered sample determined by the equation mentioned in the experimental section was observed to be 95.6% and 66.1%, respectively. The necessary information on peak area to calculate the percentage of purity of NOD/ODE in recovered samples can be found as supporting information (SI) in Tables 2 and 3. The peaks in Fig. 3 eluting at 5.038, 6.01, and 6.601 min are due to very low impurities of less than 1% for 4-ethyl tetradecane, n-tricosane, and 2-methyl eicosane, with m/z values of 226, 324, and 296, respectively. 3-methyl heptadecane, a structural isomer of NOD was responsible for the major impurity peak eluting at 5.207 min with the m/z value of 254. Plots (a–e) in Fig. 5 of supporting information represent the mass spectra of various fragments present in the recovered NOD. The initial purity of NOD was 99% and this may have been responsible for the presence of the isomer.
GCMS analysis of recovered samples: (a) total ion chromatogram of NOD; (b) total ion chromatogram of ODE.

The GCMS data presented for the first time recovered ODE indicate high level of impurities/side reactions because of which the reusability of ODE was limited. Figure 3(b) depicts a number of peaks eluted at various retention times. The important peaks exclusively eluting at 3.24 min (3%) and 5.585 min (12%) correspond to 7 methyl 9 tridecadienylether and 1-heptadecanol with m/z values of 210 and 256, respectively, probably due to a metal ion catalyzed oxidation process resulting in an ether and alcohol.
The other prominent peaks at 7.029 min (5.57%), 7.641 min, and 8.031 min corresponding to the m/z values of 210, 322, and 282 and are due to cyclopentadecane (a cyclic compound), 9-tricosene, and 6-octadecenoic acid (5%), respectively, and can be attributed to the process of fragmentation, cyclization, oxidation, and hydrogenation caused due to unsaturation in the solvent. Plots (a–f) in Fig. 6 of SI depict the mass spectra of various impurities in the recovered ODE.
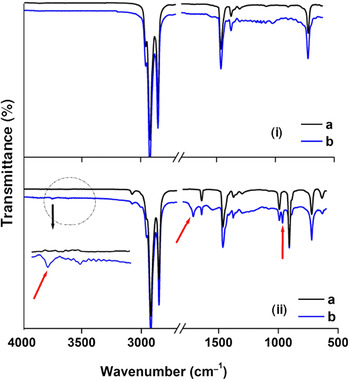
Figure 4(i) shows IR characteristic bands for C–C stretch and bend at 2956, 1118, and 1049 cm−1 (Ref. Reference Dyer14), and NOD remains unaltered post NC synthesis indicating the complete possibility of repeatedly reusing the solvent for the next batch of CdSe NC synthesis. But the IR peaks in the ODE recovered in plot (ii) depict OH stretch at 3750 cm−1 and OH bend (out of plane) at 964 cm−1 and it may be due to 1-heptadecanol with a terminal OH group. Reference Pavia, Lampman, Kriz, Sierra and Shcherbyna15 The β form of the alcohol may have been responsible to give a very weak band at 3750 cm−1 (Ref. Reference Al-Mamun16) and the obtained spectra are much similar to the reported spectra as in Fig. 3 of supporting information. The C=O stretch at 1712 cm−1 in 6-octadecenoic acid and the other overlapping bands suggest the formation of an alcohol, acid, and ether (indicated by red arrow) in NC synthesis via a ODE solvent. These may have aided the in situ release of an enormous smoke when ODE was used as a solvent unlike the NOD which aided a clean synthesis. Hence, the ODE mediated NC synthesis is indicative of an additional amount of energy required for the bonding and debonding. However, the intrinsic transformation mechanisms need more extensive investigations.
(i) ATR-IR spectra of NOD: (a) before synthesis of QD; (b) recovered after two sets of QD synthesis. (ii) ATR-IR spectra for ODE: (a) before synthesis of QD; (b) recovered after one set of QD synthesis.

Each set of NC synthesis requires 8 mL of NOD, and 95% of NOD could be recovered (at our lab purification level) after the reuse. Hence, 8 sets of NC, each set containing ≈15 mg/mL of NC can be synthesized, justifying the economic feasibility of its replacement. More importantly, the harmful by-products and pungent enormous smoke due to unsaturated compounds released via ODE incorporated NC synthesis can also be avoided.
C. Optoelectronic properties of nucleation and growth
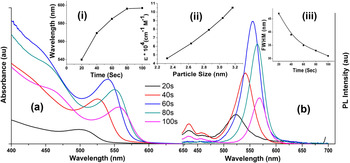
Further study demonstrates the noncompromise in the quality of CdSe NCs prepared by the proposed binary ligand and the reusable solvent. Figure 5 shows the temporal evolution of the absorbance and emission profiles as per the proposed synthesis of CdSe. The continuous red shift of the absorbance with time in the inset of Fig. 5(a) indicates a consecutive growth of the CdSe NCs. The excitation coefficient per mole of NCs at the first absorption peak, for CdTe, CdSe, and CdS NCs was found to be strongly dependent on the size of the NCs, between a square and a cubic dependence, based on the below equation proposed by Yu et al. This relates the wavelength ‘λ’ of the material to their size through their excitonic coefficient value. The mean PS (D) is correlated to the position of exciton peak in the above ensemble Ab spectra Reference Yu, Qu, Guo and Peng12 as per D = (16,122 × 10−9)λ4 − (2.6575 × 10⁻⁶)λ3 + (1624 × 10−3)λ2 − (0.4277)λ + 41.57, ΔE is the transition energy in eV and corresponds to the first absorption peak and λ (nm) is the wavelength of the first excitonic absorption peak of the corresponding samples. The constant values are only for CdSe NCs and shall be different for different NCs (like CdTe and CdS). The concentration of NCs is calculated from the ratio of absorption to extinction coefficient (ε) per mole of CdSe NCs, where ‘ε’ represents the fitting curve of the experimental data using a function similar to the equation ε = 1600 ΔE (D)3 as per the literature, Reference Yu, Qu, Guo and Peng12 ε but with a different proportionality constant and a constant path length of radiation used for recording the spectra.
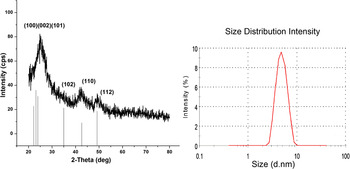
XRD pattern and PS distribution of CdSe NC evolved at t = 120 s.

As per the line represented by both the ligands, in Fig. 2(a), the growth rate is more during the early stages (the nucleation stage) and becomes exponential toward the end. The same was supported by the plot in Fig. 2(b). A continuous increase in the concentration of CdSe NCs was observed initially and it peaked at a maximum concentration at 60 s. This stage is referred to as nucleation phase after which the particle concentration declines with the majority of particle growth attaining completion (growth phase). It might be considered as the particle loss due to sort of back reaction with unstable nuclei simply redissolving in the ligand, most commonly referred to as the phenomenon of denucleation. Reference Sun and Yang17 The monomer that leached into the solution from dissolved particles was contributing to the net increase in PS, and it was a combination of ‘ligand induced ripening’ and ‘normal growth through monomer acceleration’. Reference Al-Salim, Young, Tilley, James McQuilan and Xia9 The Ab spectra of the initial NCs evolved at 20 s show unsharp and indistinct peaks due to imperfect nuclei which can be termed as nonformation of critical nuclei Reference Sun and Yang17 and the same can be observed in PL spectra. There were two other important observations that could be made from Ab spectra in Fig. 5(a). The shoulder peak at higher energy and the decrease in energy gap between the first and the second exciton transition as particles grow in size, indicates complete structure transformation to wurtzite phase. Reference Mohamed, Tonti, Al-Salman, Chemseddine and Chergui18 The obtained NCs matched the NCs produced by other reported methods, Reference Mohamed, Tonti, Al-Salman, Chemseddine and Chergui18 which depict zinc blend (ZB) structure for seed crystals and wurtzite structure as the seeds grow. The energy difference between the two forms ZB and wurtzite phases is very small. The difference in the Ab spectra is expected to originate from different electronic band structures of the crystal planes which exhibit different crystal fields.
(a) Optical absorption and (b) photo luminescence spectra of CdSe NCs evolved at different time intervals. Inset: (i) continuous red shift of NCs as a function of time; (ii) size dependent extinction coefficient per mole of NCs at the first excitonic absorption; (iii) effect of FWHM (dispersity) as a function of time during the synthesis of NCs.

The monodispersity plot in the inset of Fig. 5(b) depicted a very narrow size distribution and high crystallinity with a QY of ∼50%. It also suggested the effect of growth time on size distribution of NCs. When there is a high monomer concentration, as in initial nucleation phase, the size distribution focuses and once the monomer concentration is depleted, the size distribution defocuses, decreasing the FWHM. Reference Murray, Kagan and Bawendi19 The main emission peak at 2.24 eV and weak emission at 1.77 eV are ascribed to the emission of ground state exciton and deep level emission, respectively. Reference Babentsov, Riegler, Schneider, Ehlert, Nann and Fiederle20 The deep level emission arises not from impurity but from intense lattice defect associated to vacancies due to a much greater surface to volume ratio in NCs. This emission does not change with crystallite size unlike the excitonic emission. The high energy emission at 2.79 eV observed immediately after 20 s of attaining GT indicates the presence of interface state in these NCs (at very early stages of growth) which undergo radiative recombination of photogenerated carriers. Reference Vega Macotela, Torchynska and Douda21
D. Structural analysis
The above optoelectronic study of the NCs synthesized by this binary ligand and saturated solvent had optimum nucleation, growth, concentration, and monodispersity. NCs were further analyzed for structural parameters such as crystallite structure, surface morphology, and topology.
The XRD pattern of CdSe crystal motif in Fig. 6 depicted a wurtzite phase and was in agreement with the reported [JCPDS 65-3436], Reference Jasieniak, Bullen and Embden22 with a NC size of 1.17 nm as per Scherrer's equation. The calculated lattice parameters Reference Madelung, Rössler and Schulz23 a = 4.06 Å and c = 7.19 Å were in agreement with the reported values. A ligand plays a very important role in crystal phase formation; addition of ODA as stabilizer slows the growth rate which may have had some effect on the growth of elongated crystals on ‘C’ axis causing a wurtzite phase for even very small particles of size around 4.0 nm. DLS was used to determine the hydrodynamic size of CdSe NCs. The symmetric bell-shaped curve was observed with the narrow PS distribution. The mean PS was 5 ± 1 nm with the distribution ranging from 3 to 5 nm, indicating that NCs to be well dispersed and nonaggregated. Reference Yusuf, Kim, Hoon Lee, Guo and Moffitt24
The atomic percentage of Cd and Se elements as depicted by EDS spectrum [Fig. 8(b) in supporting information] was 43.69% and 56.31%, respectively, with the ratio matching 1:1. FESEM micrographs [Fig. 8(a) in supporting information] represent the quantized aggregation which speculates the quantized number of nanoclusters can aggregate together for fractal geometry and cluster fusion.
Figure 7 in the supplementary information represents images of NCs obtained for each of the single ligand mediated synthesis via oleic acid (OA) and octadecyl amine (ODA) at 120 s and 100 s, respectively. As observed, there is negligible nucleation, but very rapid growth of NCs with the mean particle height of 49 nm (‘a’ of Fig. 7 in SI), when single ligand OA was used. Contradictorily, the single ODA ligand results in enormous nucleated NCs giving island kind of structure and hardly any growth even after 100 s (‘b’ in Fig. 7 in SI) with a mean particle height of 3 nm.
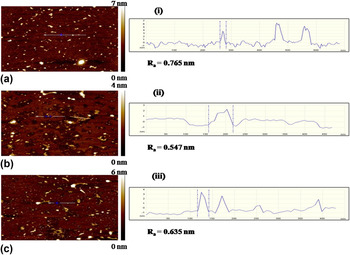
The image ‘a’ in Fig. 7 depicts large number of nucleated NCs, with an average roughness (R a) of 0.765 nm; ‘b’ indicates the ongoing growth of NCs orienting from nucleation phase to growth phase; and ‘c’ indicates further growth, where in Ostwald ripening and agglomeration may have added to increase in PS and roughness with particle height being 4 nm and 6 nm, respectively. HRTEM results substantiate the PS to be ∼4 ± 0.1 nm at t = 100 s, indicating the influence of Ostwald ripening and agglomeration at later stages thus increasing the particle height to 6 nm as shown in AFM analysis. However, size analyzed by various techniques has been shown in Table 4 of the SI. It can also be observed in Fig. 2 that NCs obtained at t = 60 s have the highest concentration beyond which the concentration decreases due to ripening. Reference Merz, Lee and Furdyna25–Reference Lu, Wang, Zeng, Wang, Zhang and Hou30
AFM images of the NCs at (a) t = 20 s, (b) t = 60 s, and (c) t = 120 s with corresponding R a depicting the nucleating and growth phase of the NCs.

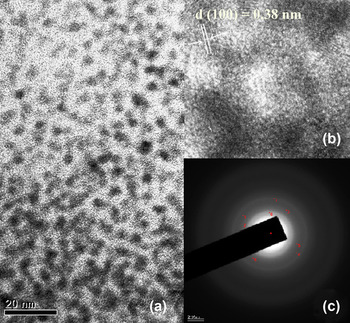
Figure 8 represents the HRTEM images of CdSe nanoparticles, in which well-resolved lattice fringes could be found. When deposited onto the TEM grids, the particles tend to lie with their major (0001) facet parallel to the support film, leading to sets of 0.37 nm lattice fringes of CdSe. NC exhibits a nearly close-packed structure, with interplanar spacing of 0.37 nm for hexagonal CdSe (100) planes. Reference Pillai and Krishna Pai28
(a) Transmission electron micrograph of CdSe NCs evolved at t = 120 s. (b) HRTEM image, which corresponds to the d-spacing of CdSe NCs. (c) SAED pattern of the NCs.

The particles thus exhibit well-defined structural and optical properties identical to quantum confinement effects obtained from any other lyothermly grown NCs.
IV. CONCLUSIONS
OA and ODA have distinct effect as ligands on nucleation and growth of CdSe NCs. ODA avoids early ripening, which can lead to decrease in nuclei number. OA accelerates growth, impeded by ODA. Therefore, a combination of these ligands enables high yields of NCs with predictable size range. N-octadecane can successfully replace ODE as the solvent with an added advantage of repeated reusability, prevention of harmful byproduct formation and release of pungent smoke. The feasibility of reuse is substantiated by GCMS and ATR-IR analysis. The resulting wurtzite phase, PS between 3.0–5.0 nm, and QY of 50% illustrate the positive effects of the ligands and solvent on NC synthesis.
Supplementary Material
To view supplementary material for this article, please visit http://dx.doi.org/jmr.2014.180.
ACKNOWLEDGMENT
The author acknowledges MNRE, India for financial support for providing the facility to carry out the research work.