I. INTRODUCTION
Nanomaterials of conducting oxides have attracted the attention of researchers over the last two decades due to their outstanding applications in solar cells, flat panel displays, photovoltaic devices, smart windows and optical transmission devices.Reference Zhao, Morel and Ferekides1–Reference Yan, Lane, Kannewurf and Chang4 Though CdO was the first reported transparent conducting film,Reference Baedeker5 it has not been extensively studied compared to other oxides like tin dioxide (SnO2), zinc oxide (ZnO) and indium oxide (In2O3) due to its relatively small band gap. However, recently, CdO based transparent conducting oxides have shown keen interest due to their relatively simple crystal structure, high carrier mobilities and nearly metallic conductivities.Reference Kammler, Mason, Young, Coutts, Ko, Poeppelmeier and Williamson6–Reference Jin, Yang, Medvedeva, Ireland, Metz, Ni, Kannewurf, Freeman and Marks9 The band gap of bulk CdO is relatively small, which may lead to the poor optical transparency in short wave length range, thus the physical properties of CdO could be controlled for optoelectronic applications by doping with ions like In,Reference Ferekides, Mamazza, Balasubramanian and Morel10–Reference Flores, Castanedo, Torres and Zelaya13 Sn,Reference Zhao, Morel and Ferekides1, Reference Yan, Lane, Kannewurf and Chang4 Al,Reference Maity and Chattopadhyay14 Sc,Reference Jin, Yang, Medvedeva, Ireland, Metz, Ni, Kannewurf, Freeman and Marks9 and Y,Reference Yang, Jin, Medvedeva, Ireland, Metz, Ni, Hersam, Freeman and Marks15 which improves its n-type conductivity and increases the optical band gap.
Considering the potential applications of CdO, metal doped CdO has stimulated considerable research effort. Therefore, many researchers have investigated the structural and optical properties of various transition elements (In, Sc, Y, Al, Sn, Fe, and Ga) doped CdO.Reference Zhao, Morel and Ferekides1, Reference Yan, Lane, Kannewurf and Chang4, Reference Ferekides, Mamazza, Balasubramanian and Morel10–Reference Dakhel17 The entire range of bulk Cd1−xCaxO (0 ≤ x ≤ 1) has been synthesized and showed wide band gap tunability.Reference Srihar, Sridharan, Chandra, Sastry, Sahu and Sundar18 However, very few reports are available in the literature for the synthesis of Ni-doped CdO. Recently, Cd1−xNixO (x = 0.02, 0.04, 0.06, and 0.08) thin films have been synthesized using a sol-gel based spin coating method in which the increase in band gap was observed (2.26–2.60 eV) with decrease in the grain size (85–50 nm).Reference Yakuphanoglu19 However surface area studies on Ni-doped CdO have not been reported in the literature to the best of our knowledge. Therefore, in this work, Ni-doped CdO nanoparticles were synthesized from an oxalate precursor using a modified solvothermal method.Reference Wani, Khatoon, Ganguly, Ahmed, Ganguli and Ahmad20, Reference Khatoon and Ahmad21 This method is cost effective as the chemical synthesis has been carried out in a simple refluxing glass assembly instead of an expensive autoclave. The oxalate precursor route has several advantages, such as, low decomposition temperature, which helps in synthesizing pure and homogeneous oxide nanoparticles. Also, the oxalate from 3d series is isomorphous in nature, which enables the enhancement of physical properties of oxide semiconductors by doping the precursor in the course of synthesis.Reference Cong, Liao, Li, Fan and Zhang22–Reference Donkova, Milenova and Mehandjiev25 Recently this method has been used for the preparation of nanocrystalline Zn1−xNixO,Reference Khatoon and Ahmad21 Zn1−xCoxO,Reference Ahmad, Khatoon and Coolahan26 In2−xMnxO3Reference Khatoon, Coolahan, Lofland and Ahmad27 and Cd1−xMnxOReference Ahmad, Khatoon, Coolahan and Lofland28 with reasonably controlled size distribution and morphology. In this paper, we have obtained homogeneous nanoparticles of much smaller size with high surface area than reported elsewhere.Reference Yakuphanoglu19 The nanoparticles have been characterized by powder x-ray diffraction, thermogravimetry, Fourier transform infrared (FTIR) spectroscopy, transmission electron microscopy, scanning electron microscopy, inductively coupled plasma and BET surface area studies. The optical and magnetic properties have also been investigated in detail.
II. EXPERIMENTAL
Nanoparticles of Cd1−xNixO (x = 0.047, 0.102 and 0.163) have been synthesized by the solvothermal method through an oxalate precursor route. All the metal solutions were prepared in double distilled water of 0.1 M concentration. Stoichiometric quantities of cadmium acetate dihydrate (Qualigens, India; 98%) and nickel chloride hexahydrate (Merck, India; 97%) were well mixed in 500 mL round bottom flask with constant stirring. Seventy five milliliters of diammonium oxalate monohydrate (Merck; 99%) was added to precipitate the metal ions. Seventy five milliliters of ethanol (Changshu Yangyuan chemical, China; 99.9%) was also added to the system to form low boiling azeotrope. The suspension was refluxed at around 70–80 °C for 12 h in a closed environment so that the volume of the reaction mixture remains constant. A light green precipitate of the oxalate precursor was formed. The precipitate was recovered by centrifugation, washed with double distilled water and finally with acetone (Merck; 99%). The precipitate was dried in an oven at 55 °C for 2 h and finally ground into powder. Brown precipitate of Cd1−xNixO nanoparticles was obtained by thermal decomposition of the precursors at 450 °C for 6 h in air.
III. CHARACTERIZATION
Thermogravimetric (TG) analysis of the precursor was carried out on an EXSTAR 6000 instrument in nitrogen atmosphere at a heating rate of 5 °C/min with alumina as a reference sample. On the basis of TG results, the oxalate precursors were calcined at 450 °C for 6 h in air. Fourier transform infrared spectra of the oxalate precursors were recorded in the wave number range of 500–4000 cm−1 on a Bruker FTIR spectrophotometer (Germany) under neat condition on ZnSe crystals. Powder x-ray diffraction (PXRD) studies were carried out on a Bruker D8 advance diffractometer using Ni-filtered Cu Kα x-rays of wave length (λ) 1.54056 Å. Normal scans were recorded with a step size of 0.05° and a step time of 1 s. Raw data were subjected to background corrections and Kα2 lines were stripped off. The grain size of the powder samples was calculated using the Scherrer’s formulaReference Birks and Friedman29: D XRD = 0.89λ/(Bcosθ), where D XRD is the diameter of the grain, λ is the characteristic wave length of the x-ray used, θ is the diffraction angle and B is the angular width in radians at an intensity equal to half of the maximum peak intensity and calculated by the Warren’s formulaReference Warren and Averbach30MReference Warren and Averbach31: B 2 = (B M2 − B S2), where B M is the full width at half maxima of the sample and B S is the full width at half maxima of the standard quartz with the characteristic grain size of around 2 µm.
The Ni and Cd concentrations in the solid solutions were determined by inductively coupled plasma-mass spectrometer (ICP-MS) using Agilent 7500a inductively coupled plasma with MS detector (Santa Clara, CA). The grain size and morphology of nanoparticles have been studied by transmission electron microscopy (TEM) using a FEI Technai G2 20 transmission electron microscope (Hillsboro, OR) with an accelerating voltage of 200 kV. The TEM specimens were prepared by dispersing the samples in ethanol and placing a drop of the dispersed sample on a copper grid. The morphology of synthesized samples was also studied by scanning electron microscopy (SEM) recorded on a Zeiss EVO MA-10 scanning electron microscope (Bikerod, Denmark). Room temperature optical properties were measured on a UV-Visible spectrophotometer (ocean optics lambda-25 UV-Visible spectrophotometer) in reflection mode. For reflectance spectra pellets were prepared. BaSO4 was used as a reference sample. The energy band gap of these nanoparticles can be further calculated by the reflection spectra using the Kubelka-Munk function F(R) Reference Kortum32:
 $$F(R)\,{\rm{ = }}\,{\rm{(1}} - R{\rm{)}}^{\rm{2}} {\rm{/2}}R\quad,$$
where, F(R) is the Kubelka-Munk function, R = R sample/R standard.
Specific surface area of the powder samples were determined by the Brunauer-Emmett-Teller (BET) method and the pore parameters of the samples were determined by the Barrett-Joyner-Halenda (BJH) method at 20 points with the help of a surface area and pore size analyzer (Make: Quantachrome instruments, Boynton Beach, FL; Model: NOVA 2000e). Samples were degassed at 250 °C for 3 h in vacuum for the removal of adsorbed gases. After degassing, specific surface areas were obtained from the nitrogen adsorption experiments measured at 77.35 K. Magnetic properties were measured using a quantum design physical properties measurement system in the temperature range of 5–300 K at an applied magnetic field of 1 kOe. Magnetization versus magnetic field curves were measured at 5 K.
IV. RESULTS AND DISCUSSION
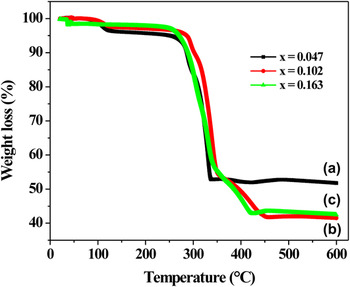
The thermal decomposition of the Ni-doped cadmium oxalate precursor was recorded in the temperature range of 20–600 °C as shown in Fig. 1. The decomposition of Cd1−xNixC2O4 (x = 0.047 and 0.102) occurs in three steps [Figs. 1(a) and 1(b), respectively]. The first step is the dehydration process, which takes place in two sub-stages. The first sub-stage occurred in the temperature range of 90–135 °C [Eq. (1)] and the second sub-stage in the range of 135–300 °C [Eq. (2)]. The dehydration step occurred at high temperature than the dehydration of pure CdC2O4.3H2O, which reveals the stability of the doped crystals.Reference Kotru, Razdan and Wanklyn33, Reference Prakash and Rao34 The measured weight loss for first sub-stage is about 3.3% and 2.1% of the total weight resulting in the elimination of 1/4 and 1/5 water molecules for x = 0.047 and 0.102, respectively. The measured weight loss for second sub-stage is about 13% and 7.4%, which results in the elimination of 1 and 1/2 molecules of water, respectively. This shows that on increasing the nickel content, water of crystallization decreases. The reduction of water of crystallization depends on the hydrogen bonding between the particles. On increasing the Ni-concentration, lattice contracts result in the decrease of particle size and reduces the hydrogen bonding between the particles considerably.Reference Kamruddin, Ajikumar, Nithya, Mangamma, Tyagi and Raj35
 $${\rm{Cd}}_{{\rm{1}} - x} {\rm{Ni}}_x {\rm{C}}_{\rm{2}} {\rm{O}}_{\rm{4}} \cdot y{\rm{H}}_{\rm{2}} {\rm{O}}\buildrel {{\rm{90}} - {\rm{135}}\,{\rm{\circ C}}} \over {\hscale380%\longrightarrow} \,\,{\rm{Cd}}_{{\rm{1}} - x} {\rm{Ni}}_x {\rm{C}}_{\rm{2}} {\rm{O}}_{\rm{4}} \cdot {\rm{(}}y - z{\rm{)}}\,{\rm{H}}_{\rm{2}} {\rm{O}}\,{\rm{ + }}\,z\,{\rm{H}}_{\rm{2}} {\rm{O\quad,}}$$
 $${\rm{Cd}}_{{\rm{1}} - x} {\rm{Ni}}_x {\rm{C}}_{\rm{2}} {\rm{O}}_{\rm{4}} \, \cdot {\rm{(}}y - z{\rm{)}}\,{\rm{H}}_{\rm{2}} {\rm{O}}\buildrel {{\rm{135}} - {\rm{300}}\,{\rm{^\circ C}}} \over{\hscale380%\longrightarrow}{\rm{Cd}}_{{\rm{1}} - x} {\rm{Ni}}_x {\rm{C}}_{\rm{2}} {\rm{O}}_{\rm{4}} {\rm{ + (}}y - z{\rm{)}}\,{\rm{H}}_{\rm{2}} {\rm{O}}{\rm{\quad.}}$$
TGA curves of Cd1−xNixC2O4 nanoparticles for x = (a) 0.047, (b) 0.102 and (c) 0.163.

In the second step, the weight loss occurred in the temperature range of 300–360 °C, which corresponds to the decomposition of anhydrous Cd1−xNixC2O4 to Cd1−xNixCO3 with the elimination of CO [Eq. (3)]. The final step is the decarboxylation process, which occurred in the temperature range of 360–445 °C. In this step, carbonates decomposed to give their corresponding oxides by the release of CO2 [Eq. (4)]. On the basis of TG results, the precursors were calcined at 450 °C for 6 h.
 $${\rm{Cd}}_{{\rm{1}} - x} {\rm{Ni}}_x {\rm{C}}_{\rm{2}} {\rm{O}}_{\rm{4}} \buildrel {{\rm{300}} - {\rm{360}}\,{\rm{^\circ C}}} \over {\hscale380%\longrightarrow} {\rm{Cd}}_{{\rm{1}} - x} {\rm{Ni}}_x {\rm{CO}}_{\rm{3}} {\rm{ + CO}} \uparrow \quad,$$
 $${\rm{Cd}}_{{\rm{1}} - x} {\rm{Ni}}_x {\rm{CO}}_{\rm{3}} \buildrel {{\rm{360}} - {\rm{445}}\,{\rm{^\circ C}}} \over {\hscale380%\longrightarrow} {\rm{Cd}}_{{\rm{1}} - x} {\rm{Ni}}_x {\rm{O + CO}}_{\rm{2}} \uparrow \,\,\,.$$
On further increasing the nickel concentration, i.e., at x = 0.163, the TGA curve shows that the compound is stable up to 230 °C, which suggests the formation of anhydrous oxalate [Fig. 1(c)]. It has been observed that the water content reduces on increasing the Ni-concentration.Reference Kamruddin, Ajikumar, Nithya, Mangamma, Tyagi and Raj35 The first weight loss started at around 230 °C, which may be due to the decomposition of oxalate into carbonate as described by Eq. (5) (decarbonylation) followed by the removal of CO2 in the temperature range of 350–430 °C [Eq. (6)].
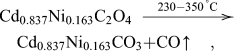 $${\rm{Cd}}_{{\rm{0}}{\rm{.837}}} {\rm{Ni}}_{{\rm{0}}{\rm{.163}}} {\rm{C}}_{\rm{2}} {\rm{O}}_{\rm{4}} \buildrel {{\rm{230}} - {\rm{350}}\,{\rm{^\circ C}}} \over {\hscale380%\longrightarrow} {\rm{Cd}}_{{\rm{0}}{\rm{.837}}} {\rm{Ni}}_{{\rm{0}}{\rm{.163}}} {\rm{CO}}_{\rm{3}} {\rm{ + CO}} \uparrow \quad,$$
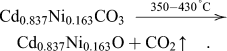 $${\rm{Cd}}_{{\rm{0}}{\rm{.837}}} {\rm{Ni}}_{{\rm{0}}{\rm{.163}}} {\rm{CO}}_{\rm{3}} \buildrel {{\rm{350}} - {\rm{430}}\,{\rm{^\circ C}}} \over{\hscale380%\longrightarrow}{\rm{Cd}}_{{\rm{0}}{\rm{.837}}} {\rm{Ni}}_{{\rm{0}}{\rm{.163}}} {\rm{O + CO}}_{\rm{2}} \uparrow \quad.$$
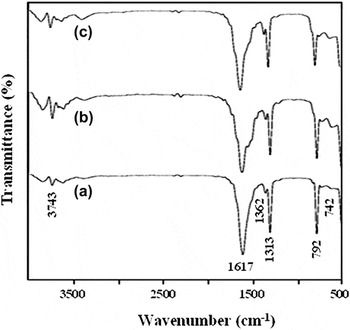
Figure 2 shows the FTIR spectra of oxalate precursors synthesized by the solvothermal method. Weak IR bands appeared at around 3700 cm−1 correspond to the stretching vibration of the –OH group, which arises due to the presence of water of crystallization. The infrared bands observed below 1700 cm−1 are assigned to the oxalate vibrational modes.Reference Jones and Jackson36 The band at ∼1362 cm−1 is assigned to symmetric stretching mode of C–O and the one at ∼1313 cm−1 corresponds to the symmetric stretching mode of C=O and O–C=O modes.Reference Jones and Jackson36–Reference Bacce, Pires, Davalos and Jafelicci39 The sharp peak at about 792 cm−1 and below confirmed the bonding of metal-oxygen (Cd-O). On incorporating Ni2+ in CdO lattice site, shifting of the band to the lower wave number is observed. This may be due to the bond weakening that arises because of the interaction of the additionally added Ni2+ in the CdO lattice site.Reference Raj, Jayanthi, Jothy, Jayachandran and Sanjeeviraja40
FTIR spectra of Cd1−xNixC2O4 nanoparticles for x = (a) 0.047, (b) 0.102 and (c) 0.163.

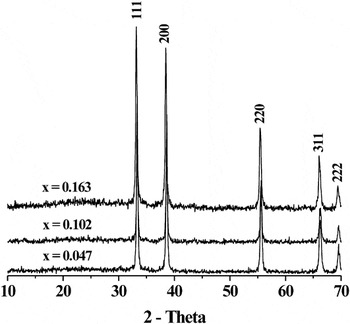
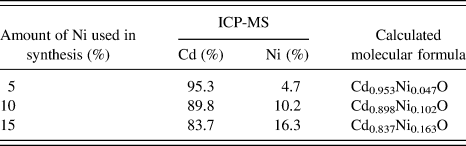
Figure 3 shows the room temperature powder x-ray diffraction spectra of Cd1−xNixO (x = 0.047, 0.102, and 0.163) nanoparticles. All the reflections in the pattern could be indexed to the monophasic CdO cubic structure (JCPDS No. 75–0594). However, the diffraction peaks are slightly shifted to higher angles. The lattice parameter of Ni-doped CdO was refined and found to be 4.677(2), 4.678(2), and 4.6868(5) Å, respectively, which is lower than bulk CdO (4.695 Å). This presumably results from the substitution of Ni2+ with a smaller ionic radius of 0.69 Å to Cd2+ (0.95 Å) lattice sites.Reference Shannon41 The crystallite size was estimated from x-ray line broadening studies using (111) reflection with the help of the Scherrer’s formula and found to be 60, 48, and 39 nm, respectively. The composition of nickel doped CdO has been determined by ICP-MS analysis, which shows that the percentage of nickel in the solid solution is nearly close to the loaded concentration of nickel during the synthesis (Table I). Our studies laid down that the solubility of Ni2+ in CdO is maximum (∼15%) than other transition metal ions.Reference De Baisi and Grillo42, Reference Rajkumar, Susila and Ramachandran43
Powder x-ray diffraction patterns of Cd1−xNixO nanoparticles for x = 0.047, 0.102 and 0.163.

ICP analysis for the estimation of expected molecular formula of nickel doped CdO nanoparticles.
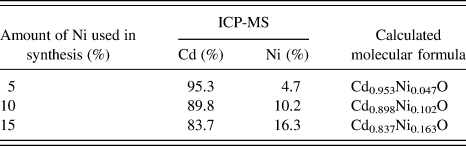
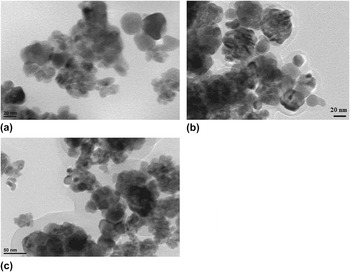
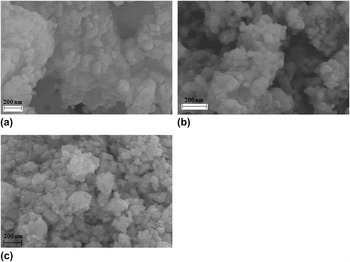
Figure 4 shows the TEM micrographs of Cd1−xNixO (x = 0.047, 0.102, and 0.163) nanoparticles. The particles are nearly hexagonal in shape with an average grain size of 30, 15, and 11 nm, respectively, which decreases on increasing the Ni concentration. The decrease in grain size may be associated with the lattice distortion and the internal stress, which arises from the radius difference between Ni2+ and Cd2+.Reference Wei, Xu, Ren, Wang, Shen and Han44, Reference Lee, Kang, Han, Jang, Chae, Yang and Kim45 The expected agglomeration could be seen in TEM micrographs due to the presence of magnetism in the solid solution. Figure 5 shows the SEM images of Cd1−xNixO (x = 0.047, 0.102, and 0.163) nanoparticles. The SEM micrographs show nearly hexagonal nanoparticles with an average size of 60, 45, and 30 nm, respectively. These trends are in accord with XRD line broadening and TEM studies.
TEM micrographs of Cd1−xNixO nanoparticles for x = (a) 0.047, (b) 0.102 and (c) 0.163.

SEM micrographs of Cd1−xNixO nanoparticles for x = (a) 0.047, (b) 0.102 and (c) 0.163.

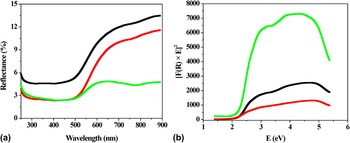
Room temperature optical characterization of Ni-doped CdO nanoparticles in the UV-Visible range were carried out by measuring the diffuse reflectance. Figure 6(a) shows reflectance spectra, which indicate a broad absorption band in the range of 550–700 nm. The fundamental absorption that corresponds to the excitation of electrons from the valence band to conduction band can be used to determine the energy band gap. The energy band gap of these nanoparticles can be calculated by the reflection spectra using the Kubelka-Munk relation. Figure 6(b) shows the [F(R) × E]2 versus E plot. The direct band gap of these samples is determined from intercept of the linear fit of the absorption edge at [F(R) × E]2 = 0, which comes out to be 2.25, 2.26, and 2.24 eV, respectively, which is slightly red shifted to undoped CdO (2.28 eV).Reference Jefferson, Hatfield, Veal, King, Mc Connville, Perez and Sanjose46 The observed red shift in the optical band gap may be associated with the sp-d exchange interactions between the band electrons and the localized d electrons of the substituted Ni2+ ions.Reference Ogale, Choudhary, Buban, Lofland, Shinde, Kale, Kulkarni, Higgins, Lanci, Simpson, Browning, Sarma, Drew, Greene and Venkatesan47–Reference Bouaine, Brihi, Schmerber, Bouillet, Colis and Dinia50
(a) UV-visible reflectance spectra and (b) [F(R) × E]2 versus energy plot for direct band gap determination of Cd1−xNixO nanoparticles for x = 0.047, 0.102, and 0.163.

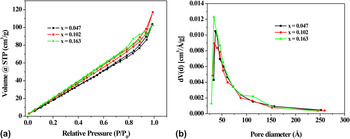
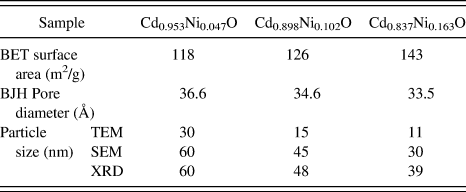
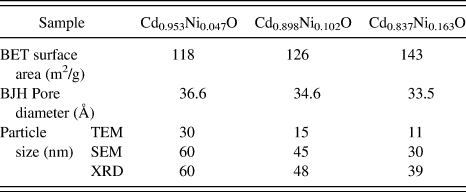
Specific surface area of Cd1−xNixO (x = 0.047, 0.102, and 0.163) nanoparticles was determined using a multipoint BET equation and found to be 118, 126, and 143 m2/g, respectively. These nanoparticles have high specific surface area, which increases on increasing the Ni concentration from x = 0.047 to 0.163. The surface area measurements could be correlated with the size of the nanoparticles. The nanoparticles of size 11 nm show a maximum surface area of 143 m2/g. However, the surface area decreases to 118 m2/g on increasing the particle size to 30 nm. N2 adsorption—desorption plots exhibit type IV isotherms followed by a H3 hysteresis loop [Fig. 7(a)], indicating the predominance of mesopores.Reference Sing, Everett, Haul, Moscou, Pierotti, Rouquerol and Siemieniewska51 However, the hysteresis area is narrow, which suggests that the mesopores are of smaller size. A similar hysteresis loop also appears for Zn1−xNixOReference Khatoon and Ahmad21 and In2−xMnxOReference Khatoon, Coolahan, Lofland and Ahmad27 nanoparticles. The average pore diameter was found to be 36.6, 34.6, and 33.5 Å, respectively, from the adsorption isotherm using the Barrett-Joyner-Halenda (BJH) method. These results also confirmed the predominance of mesopores. The BJH pore size distribution plot of these samples is shown in Fig. 7(b). The summary of the BET surface area, BJH pore diameter and particles sizes using TEM, SEM and XRD have been shown in Table II. The observed increase in surface area and decrease in pore diameter may be correlated to the formation of smaller grain size, which causes the maximum disorderness due to the increase of nickel content in the CdO host lattice.Reference Khatoon, Coolahan, Lofland and Ahmad27, Reference Ahmad, Khatoon, Coolahan and Lofland28, Reference Barick, Aslam, Dravid and Bahadur52
(a) N2 adsorption-desorption isotherms and (b) BJH plots of Cd1−xNixO nanoparticles for x = 0.047, 0.102 and 0.163.

BET surface area, BJH pore diameter and particle size of Cd1−xNixO nanoparticles for x = 0.047, 0.102 and 0.163.
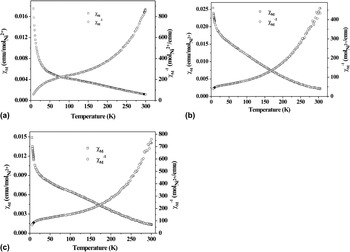
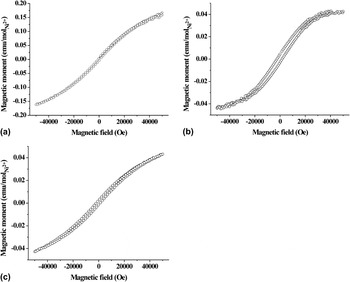
The temperature dependence of molar susceptibility and inverse susceptibility of the prepared solid solutions were determined under an applied magnetic field of 1 kOe in the temperature range of 5–300 K as shown in Fig. 8. The decrease in χM with increasing temperature indicates the paramagnetic behavior of the samples. The effective magnetic moment calculated from the inverse susceptibility plot was found to be 2.86, 3.92, and 3.74 µB/Ni2+, respectively. The experimentally obtained µeff for Cd0.953Ni0.047O is consistent with the theoretical value (2.83 µB/Ni2+), indicating the presence of Ni2+. Magnetic behavior of these nanoparticles was further investigated by plotting magnetic moment as a function of the applied magnetic field measured at a temperature of 5 K. The observed curves show hysteresis (Fig. 9), which indicate the existence of ferromagnetic ordering in the samples. The solid solutions show a coercivity Hc of ∼0.732, 2.2, and 1.5 kOe, respectively and remanence Mr of ∼0.0045, 0.0032, and 0.0021 emu/mol. Similar coexistence of ferromagnetism and paramagnetism has also been observed earlier in (In, Mn) AsReference Ohno, Munekata, Penney, Von Molnar and Chang53 and Fe-doped ZnOReference Ahn, Park, Shim and Cim54 systems and recently in Mn-doped ZnO.Reference Jayakumar, Gopalakrishnan, Kadam, Vinu, Asthana and Tyagi55
Temperature dependence of molar magnetic susceptibility and inverse susceptibility plots of Cd1−xNixO nanoparticles for x = (a) 0.047, (b) 0.102 and (c) 0.163 measured at a magnetic field of 1 kOe.

Magnetic field versus magnetic moment plots of Cd1−xNixO nanoparticles for x = (a) 0.047, (b) 0.102 and (c) 0.163 measured at a temperature of 5 K.

V. CONCLUSIONS
Nanocrystalline Cd1−xNixO (x = 0.047, 0.102, and 0.163) dilute magnetic semiconductors have been successfully synthesized by a solvothermal method through an oxalate precursor route for the first time. The mechanism for the synthesis and kinetics of the reaction has been studied by thermogravimetric studies. XRD studies clearly showed the formation of monophasic and highly crystalline Cd1−xNixO solid solution. Contraction of lattice parameter and ICP studies confirmed the incorporation of Ni2+ ions into the CdO host matrix. Hexagonal nanoparticles of average grain sizes of 30, 15 and 11 nm for x = 0.047, 0.102, and 0.163, respectively have been prepared, which were found to decrease with increasing Ni2+ concentration. The surface area of these nanoparticles was very high and found to be 118, 126, and 143 m2/g, respectively, which increases on increasing the Ni concentration in CdO host lattice. Magnetic measurements show that the Ni doped CdO solid solutions exhibit ferromagnetic ordering.
ACKNOWLEDGMENTS
TA thanks CSIR, Govt. of India for financial support of the research project [Grant No. 01(2448)/10EMR-II]. SK thanks UGC and CSIR for research fellowships. The authors also thank Prof. K. V. Ramanujachary, Rowan University, USA for ICP and magnetic measurements as well as for valuable discussions.