I. INTRODUCTION
Magnesium alloys have a high potential for improving the fuel efficiency of vehicles because of their high specific strength and stiffness.Reference Hakamada, Furuta, Chino, Chen, Kusuda and Mabuchi1 In Mg, a basal slip preferentially takes place because the critical resolved shear stress for the basal slip is lower than that for prismatic and pyramidal slips.Reference Yoshinaga and Horiuchi2 The anisotropy in slip systems gives rise to a relatively low ductility and poor formability at room temperature in Mg and its alloys. To improve their formability, various techniques have been developed, for example, shear rolling,Reference Chino, Mabuchi, Kishihara, Hosokawa, Yamada, Wen, Shimojima and Iwasaki3,Reference Huang, Suzuki and Saito4 high-temperature rolling,Reference Huang, Suzuki, Chino and Mabuchi5 cross rolling,Reference Kim, You, Yim and Seo6–Reference Huang, Suzuki, Watazu, Shigematsu and Saito9 and high speed rolling.Reference Li, Hsu, Szpunar, Utsunomiya and Sakai10
Recently, it was reported that formability at room temperature was significantly improved by the addition of a small amount of rare elements such as Ce, Y, and Gd.Reference Chino, Sassa and Mabuchi11–Reference Yan, Chen and Han15 For example, a rolled Mg–1.5 wt%Zn–0.2 wt%Y alloy showed a large Erichsen value of 9.2 at room temperature.Reference Chino, Sassa and Mabuchi13 However, the addition of rare elements leads to high cost. More recently, it was found that the formability of the Mg–Zn alloy was significantly enhanced by the addition of a small amount of Ca.Reference Chino, Huang, Suzuki and Mabuchi16–Reference Kim, Suh, Shim, Bae, Kim and Kim19 In particular, a rolled Mg–1.5 wt%Zn–0.1 wt%Ca alloy exhibited a large Erichsen value of 8.2 at room temperature. This highly formable Mg–Zn–Ca alloy is attractive for commercial applications because no addition of rare elements is required. On the other hand, a rolled Mg–1.5 wt%Zn alloy did not show high stretch formability.Reference Chino, Huang, Suzuki and Mabuchi16,Reference Chino, Ueda, Otomatsu, Sassa, Huang, Suzuki and Mabuchi18 This fact indicates that the addition of Ca is critical for the improved formability of Mg. The high stretch formability of a rolled Mg–Zn–Ca alloy was related to the reduced intensity of the (0002) basal plane texture.Reference Chino, Huang, Suzuki and Mabuchi16 It is of interest to note that a weakened basal texture was not observed in the as-rolled Mg–Zn–Ca alloy, but that the texture was drastically changed by annealing after rolling, resulting in the weakened basal plane texture.Reference Chino, Huang, Suzuki and Mabuchi16,Reference Chino, Ueda, Otomatsu, Sassa, Huang, Suzuki and Mabuchi18,Reference Kim, Suh, Shim, Bae, Kim and Kim19 Therefore, it is worthwhile to investigate the as-rolled Mg–Zn–Ca alloy to better understand the origin of this weakened texture.
In the present work, microstructures of the as-rolled Mg–Zn–Ca alloy are investigated using electron backscattered secondary diffraction (EBSD) and transmission electron microscopy (TEM). The investigations reveal that fine  $\left\{ {10\bar 12} \right\}$ twins are formed in the as-rolled Mg–Zn–Ca alloy. In addition, first-principles calculations are performed to investigate the
 $\left\{ {10\bar 12} \right\}$ twinnability.
II. EXPERIMENTAL AND CALCULATION DETAILS
A. Experimental
An extruded Mg–3.0 wt%Zn–0.1 wt%Ca (Mg–1.1 at.%Zn–0.06 at.%Ca) alloy of 50 mm in length, 60 mm in width, and 5 mm in thickness was prepared. After the specimen was annealed at 623 K for 5 min in furnace, unidirectional rolling was conducted at a rolling reduction per pass of about 20%. The annealing and rolling treatments were repeated 7 times, and finally the sheet specimen was rolled to a thickness of 1 mm. After final rolling, annealing at 623 K was not carried out. For comparison, an as-rolled Mg–3.0 mass%Zn sheet specimen was produced under the same processing conditions.
EBSD measurements were carried out to study the texture using scanning electron microscopy on a JSM-5910 (JEOL, Japan) machine operating at 20 kV. The working distance of 20 mm, specimen tilt angle of 60°, and step size of 1 μm were used for the EBSD measurements. The specimens were prepared from the RD–ND plane of the specimens at the center through the thickness, where RD is the rolling direction and ND is the normal direction. The specimens were ground with 2000 grit SiC papers, polished with 3 and 1 μm diamond suspensions, polished with alumina suspensions, and finally etched with an ECR plasma ion shower equipment (Elionix Inc., EIS-200ER, Japan). In addition, TEM (JEM-2100F, JEOL, Japan) observation was performed at an operating voltage of 200 kV. TEM foils were prepared from the RD–TD plane of the specimen at the center through the thickness, where TD is the transverse direction. The foils were mechanically ground to a thickness of 60–70 μm, and thinned to about 20 μm by dimpling, finally perforated by Ar-ion thinning.
B. Calculation details
First-principles calculations of the generalized stacking fault energy (GSFE) for the  $\left( {10\bar 12} \right)\left[ {\bar 1011} \right]$ slip were carried out to investigate the twinnability of the
 $\left\{ {10\bar 12} \right\}$ plane in the Mg–Zn–Ca and Mg–Zn alloys. The calculations were performed using the CASTEP code,Reference Clark, Segall, Pickard, Hasnip, Probert, Refson and Payne20 in which density functional theoryReference Hohenberg and Kohn21,Reference Kohn and Sham22 was used with a plane-wave basis set. The exchange–correlation interactions were treated using the generalized gradient approximation within the Perdew–Wang scheme (PW91).Reference Perdew, Chevary, Vosko, Jackson, Pederson, Singh and Fiolhais23 The plane-wave cutoff energy of 350 eV and Gaussian smearing with a width of 0.1 eV were used. The ultrasoft pseudopotentialsReference Vanderbilt24 represented in reciprocal space were used for all elements in the calculations. The Brillouin zone was sampled using a Monkhorst–Pack 4 × 4 × 1 k-point mesh. All atomic positions were relaxed based on Hellmann–Feynman forces until all the forces were less than 0.01 eV/Å.
The Mg–Zn–Ca and Mg–Zn cell models used for the GSFE calculations are shown in Fig. 1, where the x-axis is  $\left[ {1\bar 210} \right]$, the y-axis is
 $\left[ {\bar 1011} \right]$, and the z-axis is normal to
 $\left( {10\bar 12} \right)$. The Mg1 and Mg2 atoms are Mg atoms nearest to slip planes, which are shown later. The unit cell had periodic lengths of 0.762 nm along the x-axis, 0.642 nm along the y-axis, and 4.60 nm along the z-axis. The number of atoms in the cell was 64. A vacuum spacing of 1.5 nm was made along the z-axis. In the Mg–Zn–Ca model, the locations of the Zn and Ca atoms were determined to be in the most stable state. Further details on the locations of the Zn and Ca atoms are discussed in another study.Reference Yuasa, Hayashi, Mabuchi and Chino25
Cell models used for the calculation of GSFE: (a) Mg–Zn–Ca model; (b) Mg–Zn model. The orange-colored atom is a Ca atom and the gray-colored atom is a Zn atom. In the Mg–Zn–Ca model, the locations of the Zn and Ca atoms are determined to be in the most stable state. The GSFE is calculated by displacing layers 1–9 (blue and red circles) along  $\left[ {\bar 1011} \right]$ on the
 $\left( {10\bar 12} \right)$ plane over a distance of 0.404 nm, and then similarly by displacing layers 3–9 (red circles) along
 $\left[ {\bar 1011} \right]$ over a distance of 0.049 nm.

The GSFE can be obtained by cutting a perfect crystal with two free surfaces and displacing the two parts relative to each other along the fault vector within the slip plane.Reference Vitek26 In the present work, the  $\left( {10\bar 12} \right)$ twinning was simulated based on the zonal twinning mechanism,Reference Wang, Hoagland, Hirth, Capolungo, Beyerlein and Tome27,Reference Wang, Hirth and Tome28 where the twin nucleus consisted of one
 ${{57} \over {107}}\left[ {\bar 1011} \right]$ partial dislocation and one
 ${1 \over {15}}\left[ {\bar 1011} \right]$ twinning dislocation. Hence, the GSFE was calculated by displacing layers 1–9 (blue and red circles in Fig. 1) along
 $\left[ {\bar 1011} \right]$ on the
 $\left( {10\bar 12} \right)$ plane over a distance of 0.404 nm, and then similarly by displacing layers 3–9 (red circles in Fig. 1) along
 $\left[ {\bar 1011} \right]$ over a distance of 0.049 nm. It was reported in a previous studyReference Yuasa, Hayashi, Mabuchi and Chino29 that the Burgers vector of the partial dislocation was shorter than
 ${{57} \over {107}}\left[ {\bar 1011} \right]$. However, the
 $\left( {10\bar 12} \right)$ twin was completely formed based on the zonal twinning mechanism with a
 ${{57} \over {107}}\left[ {\bar 1011} \right]$ partial dislocation.Reference Yuasa, Hayashi, Mabuchi and Chino29 Hence, in the present work, the
 $\left\{ {10\bar 12} \right\}$ twinnability was investigated based on the zonal twinning mechanism. In the calculations, the atomic positions were relaxed only along the direction perpendicular to the slip plane. There are some potential slip planes around the Ca or Zn atoms. In the present work, the slip plane was determined from the lowest unstable stacking fault energy. As a result, the slip plane was situated between the Ca-containing layer and the first layer above it in displacing layers 1–9 and between the second and third layers above the Ca-containing layer in displacing layers 3–9 for the Mg–Zn–Ca model. For the Mg–Zn model, the slip plane was situated between the Zn-containing layer and the first layer above it in displacing layers 1–9 and between the second and third layers above the Zn-containing layer in displacing layers 3–9, as shown in Fig. 1.
III. RESULTS AND DISCUSSION
A. EBSD analysis
Figures 2(a) and 2(b) show the image-quality map and the inverse pole figure map, respectively, for the Mg–Zn–Ca alloy after final rolling. It can be seen from Fig. 2(b) that the intense basal texture is formed. Figure 2(c) shows the basal texture that is calculated based on the inverse pole figure map of Fig. 2(b). Usually, the basal planes are distributed to be parallel to the RD–TD plane and the intense basal texture is formed for rolled Mg,Reference Hantzsche, Wendt, Kainer, Bohlen and Letzig30 where TD is the transverse direction. An inspection of Fig. 2(c) reveals that although the basal texture is indeed formed, its peaks are tilted slightly toward the RD and the TD.
Results of electron backscattered secondary diffraction analysis for Mg–Zn–Ca alloy after final rolling: (a) image-quality map; (b) inverse pole figure map; and (c) basal texture. RD is the rolling direction and TD is the transverse direction.
Figure 3 shows the twin boundary map for the Mg–Zn–Ca alloy after final rolling. The  $\left\{ {10\bar 12} \right\}\left\langle {10\bar 11} \right\rangle$ twin is one of the main twins for Mg.Reference Barnett31 Dislocations have a repulsive interaction with the
 $\left\{ {10\bar 12} \right\}$ twin boundary,Reference Yuasa, Masunaga, Mabuchi and Chino32 and they pile up at the twin boundary.Reference Braszczynska-Malik, Litynska and Baliga33 Another main twin in Mg is the
 $\left\{ {10\bar 11} \right\}\left\langle {10\bar 12} \right\rangle$ twin,Reference Barnett34 which tends to absorb dislocations. An important twin, related to the
 $\left\{ {10\bar 11} \right\}$ twin, is the
 $\left\{ {10\bar 11} \right\}$–
 $\left\{ {10\bar 12} \right\}$ double twin because the double twin becomes the site of a fracture.Reference Ando, Koike and Sutou35,Reference Cizek and Barnett36 Twins rotate the lattice, namely,
 $\left\{ {10\bar 12} \right\}$ twin reorients the basal plane by 86°,
 $\left\{ {10\bar 11} \right\}$ twin reorients the basal plane by 56°, and
 $\left\{ {10\bar 11} \right\}$–
 $\left\{ {10\bar 12} \right\}$ double twin reorients the basal plane by 38°. The number fractions of 86°
 $\left\{ {10\bar 12} \right\}$ twins, 56°
 $\left\{ {10\bar 11} \right\}$ twins, and 38°
 $\left\{ {10\bar 11} \right\}$–
 $\left\{ {10\bar 12} \right\}$ double twins were 5.8, 0.6, and 1.4%, respectively, where the number fraction of twins was defined as the ratio of the number of boundaries with the misorientation of 86°, 56°, or 38° to the total number of boundaries in the twin boundary map. In the analyses, a measured point pair with misorientation exceeding 2° was considered as a boundary. Thus, most of the twins generated in the Mg–Zn–Ca alloy were the
 $\left\{ {10\bar 12} \right\}$ twins. As shown below, not only were the
 $\left\{ {10\bar 12} \right\}$ twins shown in Fig. 3 formed in the Mg–Zn–Ca alloy, but also fine
 $\left\{ {10\bar 12} \right\}$ twins which could not be detected by EBSD were formed. The tilt in the peaks of the basal texture toward the RD and the TD is probably related to the
 $\left\{ {10\bar 12} \right\}$ twins.Reference Kim, Suh, Bae, Shim, Kimb and Kima37
Twin boundary map for Mg–Zn–Ca alloy after final rolling, where boundaries of  $\left\{ {10\bar 12} \right\}$ twins,
 $\left\{ {10\bar 11} \right\}$ twins, and
 $\left\{ {10\bar 11} \right\}$–
 $\left\{ {10\bar 12} \right\}$ double twins are characterized by red, green, and blue lines, respectively. Most of the twins are
 $\left\{ {10\bar 12} \right\}$ twins.
B. TEM observation
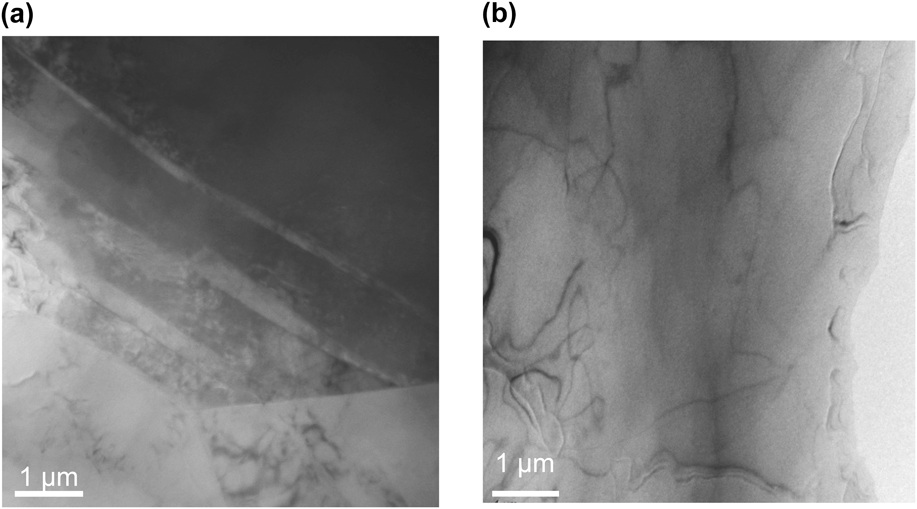
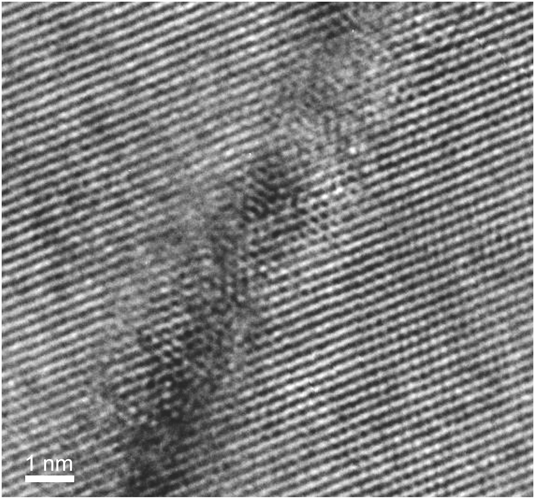
Figure 4 shows the transmission electron micrographs of the Mg–Zn–Ca and Mg–Zn alloys after final rolling. Fine lines, which distributed along the same direction, were observed in the Mg–Zn–Ca alloy. However, such fine lines were not found in the Mg–Zn alloy. A high-resolution TEM of the fine line in the Mg–Zn–Ca alloy after final rolling is shown in Fig. 5. Clearly, the fine line was a twin boundary. From select-area electron diffraction (SAED) patterns, the boundary plane of the fine line was found to be  $\left( {01\bar 1\bar 2} \right)$. Similarly, the boundary planes of all the fine lines investigated were found to be
 $\left\{ {10\bar 12} \right\}$. Hence, the fine twins observed in the Mg–Zn–Ca alloy are determined to be
 $\left\{ {10\bar 12} \right\}$ twins.
Transmission electron micrographs of (a) Mg–Zn–Ca alloy and (b) Mg–Zn alloy after final rolling. Fine lines are observed in the Mg–Zn–Ca alloy; however, fine lines are not found in the Mg–Zn alloy.
High-resolution transmission electron micrograph of a fine line in the Mg–Zn–Ca alloy after final rolling. The fine line is a  $\left( {01\bar 1\bar 2} \right)$ twin.
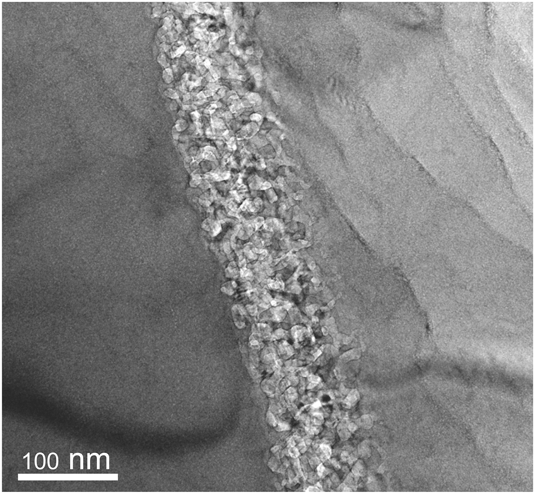
In addition to fine lines, thick lines were occasionally observed in the Mg–Zn–Ca alloy. Figure 6 shows a high-resolution TEM of a thick line in the Mg–Zn–Ca alloy after final rolling. It is noted that the thick line consists of fine grains, whose size is about 10–30 nm. As shown before, many fine  $\left\{ {10\bar 12} \right\}$ twins were formed in the Mg–Zn–Ca alloy.
 $\left\{ {10\bar 12} \right\}$ twin boundaries have a repulsive interaction with dislocations,Reference Yuasa, Masunaga, Mabuchi and Chino32 and dislocations pile up at
 $\left\{ {10\bar 12} \right\}$ twin boundaries.Reference Braszczynska-Malik, Litynska and Baliga33 It is therefore likely that the fine-grained microstructure is a result of recrystallization induced by a high dislocation density around the
 $\left\{ {10\bar 12} \right\}$ twin boundaries. Jin et al.Reference Jin, Shim and Lim38 showed that
 $\left\{ {10\bar 12} \right\}$ twins stimulated grain refinement, resulting in strong basal texture in Mg alloys. The formation of strong basal texture is related to continuous recrystallizationReference Tan and Tan39 because no long range motion of recrystallization front occurs in continuous recrystallization.Reference Doherty, Hughes, Humphreys, Jonas, Jensen, Kassner, King, McNelley, McQueen and Rollett40 However, the present work indicated that fine
 $\left\{ {10\bar 12} \right\}$ twins stimulated grain refinement, but led to the reduced basal texture. It is accepted that discontinuous recrystallization leads to the reduced texture because of long range motion of boundaries.Reference Doherty, Hughes, Humphreys, Jonas, Jensen, Kassner, King, McNelley, McQueen and Rollett40 The previous worksReference Liu, Liu, Yuan, Shi and Wang41,Reference Huang, Suzuki, Chino and Mabuchi42 showed that discontinuous recrystallization occurred during annealing in Mg alloys. Therefore, discontinuous recrystallization may be induced by fine
 $\left\{ {10\bar 12} \right\}$ twins in the case of the present work.
High-resolution transmission electron micrograph of a thick line in the Mg–Zn–Ca alloy after final rolling. The thick line consists of fine grains, whose size is about 10–30 nm.
In the Mg–Zn–Ca alloy, coherent boundaries with defects were occasionally found. In Fig. 7, the crystalline orientation of a given twin was found to be slightly different from that of another twin. Figure 8 shows an edge-on condition photograph of the twin boundary. It can be seen that defect structures were formed at the boundary. This suggests that the defects accommodated the strain generated by the difference in crystalline orientation.Reference Hirth, Pond, Hoagland, Liu and Wang43,Reference Wang and Beyerlein44 The defects may enhance the recrystallization around the twin boundary.
Fine  $\left\{ {10\bar 12} \right\}$ twins and select area electron diffraction patterns in the Mg–Zn–Ca alloy after final rolling. The crystalline orientation of a twin is slightly different from that of another twin.
Edge-on condition photograph of the boundary of a twin in Fig. 7. Defect structures are observed at the boundary.
C. First-principles calculation
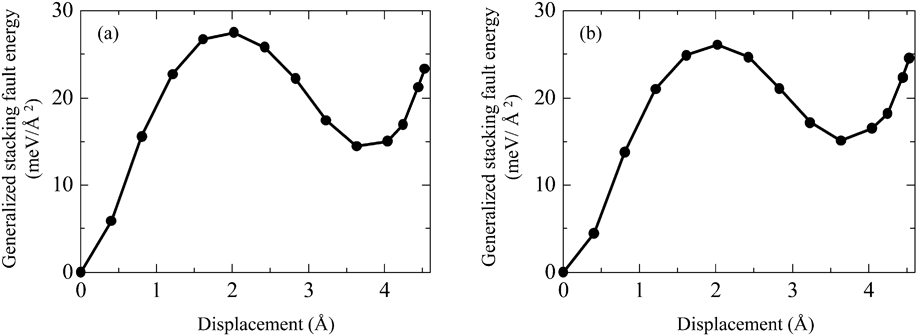
Figure 9 shows the variation in GSFE for the  $\left( {10\bar 12} \right)\left[ {\bar 1011} \right]$ slip as a function of the displacement for both the Mg–Zn–Ca and Mg–Zn models. The unstable stacking fault energy, γus, the stacking fault energy, γsf, and the unstable twinning energy, γut, were 27.5, 14.5, and 23.3 meV/Å2, respectively, for the Mg–Zn–Ca model and 26.1, 15.0, and 24.6 meV/Å2, respectively, for the Mg–Zn model. Thus, γus was increased, while γut was decreased by the addition of Ca. The stacking fault energy calculated by simulations often has a deviation. For example, the stacking fault energies for the basal slip in Mg are in the range of 33–36 mJ/m2,Reference Yasi, Nogaret, Trinkle, Qi, Hector and Curtin45–Reference Muzyk, Pakiela and Kurzydlowski47 and the deviation is 3 mJ/m2 at a maximum in estimating the stacking fault energy by the first-principles calculation. Recently, Sandlobes et al.Reference Sandlobes, Friak, Zaefferer, Dick, Yi, Letzig, Pei, Zhu, Neugebauer and Raabe48 showed that the addition of Y reduces the stacking fault energy by 0.6 meV/Å2 (10 mJ/m2), resulting in the formation of stable stacking fault in Mg–Y alloys. In the present work, the differences of γsf and γut between the Mg–Zn–Ca and Mg–Zn models are 0.5 meV/Å2 (8.1 mJ/m2) and 1.3 meV/Å2 (20.8 mJ/m2), respectively, and they are significant. Hence, the differences of γsf and γut affect the twinnability.
Variation in GSFE as a function of the displacement for (a) the Mg–Zn–Ca model and (b) the Mg–Zn model.
Tadmor and HaiReference Tadmor and Hai49,Reference Tadmor and Bernstein50 showed that the twinnability, T, can be estimated by
 $$T = \left( {A - B{{{\gamma _{{\rm{sf}}}}} \over {{\gamma _{{\rm{us}}}}}}} \right)\sqrt {{{{\gamma _{{\rm{us}}}}} \over {{\gamma _{{\rm{ut}}}}}}} \quad {\rm{,}}$$
where A and B are constants (>0). According to Eq. (1), an increased γus or a decreased γsf or γut lead to an enhanced twinnability. Therefore, it is suggested that twinning occurs more readily in the Mg–Zn–Ca alloy than in the Mg–Zn alloy because of the larger γus and the lower γut for the Mg–Zn–Ca model. This corresponds to the experimental fact that many  $\left\{ {10\bar 12} \right\}$ twins were formed in the rolled Mg–Zn–Ca alloy.
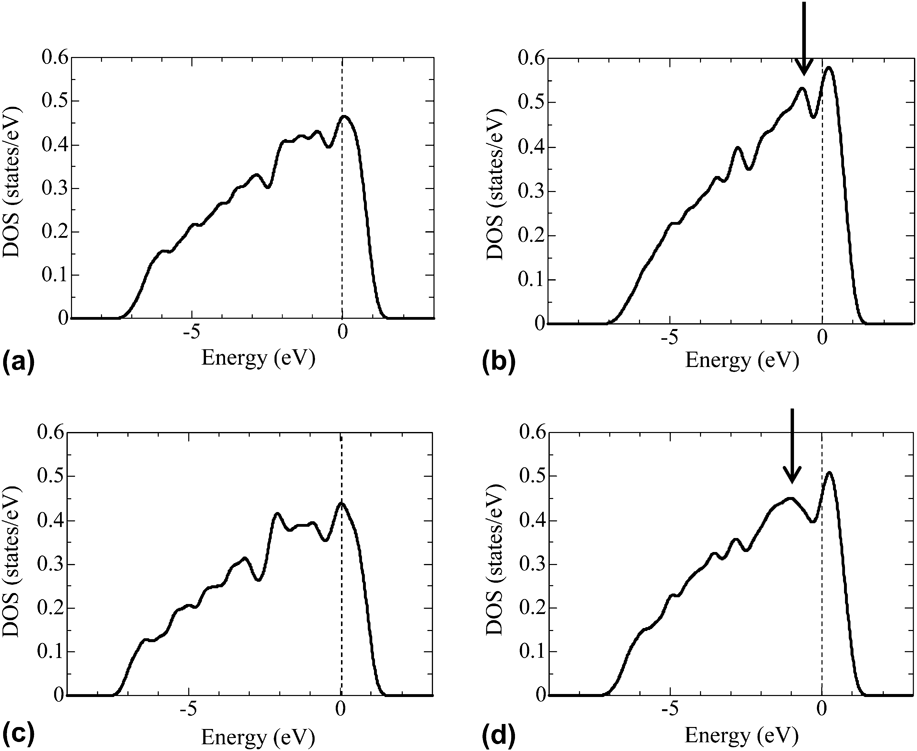
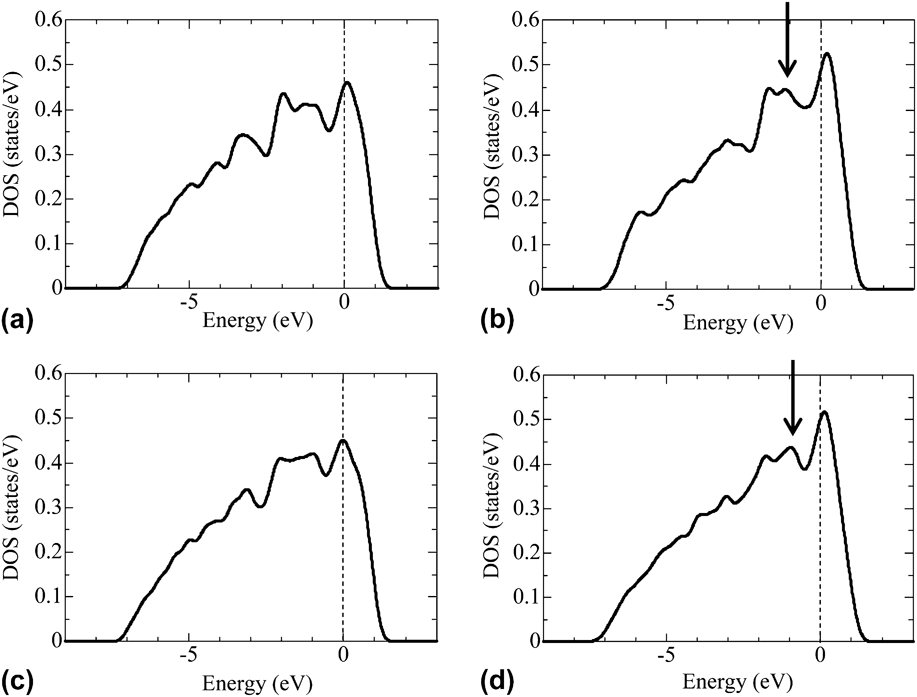
Local density of states (LDOS) of the Mg1 and Mg2 atoms at the nondeformation state and at the γus state in the Mg–Zn–Ca model and the Mg–Zn model are shown in Figs. 10 and 11, where the Mg1 and Mg2 atoms are the Mg atoms nearest to the slip planes. In both the Mg–Zn–Ca and Mg–Zn models, a peak was found near the Fermi level at the γus state. An inspection of Fig. 10 reveals that the peak was sharper in the Mg–Zn–Ca model than in the Mg–Zn model. Similarly, a peak was found near the Fermi level at the γut state in both the Mg–Zn–Ca and Mg–Zn models. However, it is of interest to note that the peak at the γut state was smoother in the Mg–Zn–Ca model than in the Mg–Zn model, in the contrary to those at the γus state, as shown by arrows. It is known that electrons at the surface of a solid are more localized than those at the inside of a solid and a peak near the Fermi level is sharper in LDOS of an atom located at the surface.Reference Shang and Wang51,Reference Zhang, Kontsevoi, Freeman and Olson52 The results in Figs. 10 and 11 indicate that the electrons at the γus state is more localized in the Mg–Zn–Ca model than in the Mg–Zn model, while the electrons at the γut state is less localized in the Mg–Zn–Ca model than in the Mg–Zn model. These behaviors are suggested to lead to the larger γus and the lower γut for the Mg–Zn–Ca model.
LDOS of the Mg1 atom: (a) LDOS at the nondeformation state in the Mg–Zn–Ca model; (b) LDOS at the γus state in the Mg–Zn–Ca model; (c) LDOS at the nondeformation state in the Mg–Zn model; and (d) LDOS at the γus state in the Mg–Zn model. The Mg1 atom is a Mg atom nearest to the slip plane. The Fermi level defines the zero of energy. The arrow indicates the peak near the Fermi level.
LDOS of the Mg2 atom: (a) LDOS at the nondeformation state in the Mg–Zn–Ca model; (b) LDOS at the γut state in the Mg–Zn–Ca model; (c) LDOS at the nondeformation state in the Mg–Zn model; and (d) LDOS at the γut state in the Mg–Zn model. The Mg2 atom is a Mg atom nearest to the slip plane. The Fermi level defines the zero of energy. The arrow indicates the peak near the Fermi level.
IV. CONCLUSIONS AND REMARKS
The poor ductility of Mg is due to anisotropy in slip systems. The mobility of a prismatic dislocation in comparison to a basal dislocation can be enhanced by the addition of Zn and Ca.Reference Yuasa, Hayashi, Mabuchi and Chino25 Enhanced prismatic slip gives rise to improved formability in Mg. However, the high formability of the Mg–Zn–Ca alloy cannot be explained solely by the enhanced prismatic slip but rather is also related to the reduced intensity of the basal texture.Reference Chino, Huang, Suzuki and Mabuchi16 Previous studiesReference Chino, Huang, Suzuki and Mabuchi16,Reference Chino, Ueda, Otomatsu, Sassa, Huang, Suzuki and Mabuchi18,Reference Kim, Suh, Shim, Bae, Kim and Kim19 have pointed out the importance of annealing after hot rolling for reducing the intensity of the basal texture in the Mg–Zn–Ca alloy. This indicates that grains whose basal planes are oriented to various directions grow during annealing. The present work revealed that fine-grained microstructures were locally formed in the as-rolled Mg–Zn–Ca alloy. Therefore, it is suggested that the local fine-grained microstructures become nuclei for recrystallization during annealing, resulting in a reduced intensity of the basal texture after annealing.
In the present work, it was found that  $\left\{ {10\bar 12} \right\}$ fine twins were formed in the rolled Mg–Zn–Ca alloy. Recrystallization in Mg is closely related to twins.Reference Kaibyshev and Sitdikov53,Reference Sitdikov and Kaibyshev54 Therefore, the local fine-grained microstructure is suggested to be a result of recrystallization in limited areas around the fine twins.