Introduction
Not all in vitro produced bovine embryos are created equally. Subtle underlying genetic/epigenetic differences may translate to differences in developmental rate (Bermejo-Alvarez et al., Reference Bermejo-Alvarez, Rizos, Rath, Lonergan and Gutierrez-Adan2008; Cordova et al., Reference Cordova, Perreau, Uzbekova, Ponsart, Locatelli and Mermillod2014; Fernandes Bressan et al., Reference Fernandes Bressan, Fantinato-eto, Mamede Andrade, Rodrigues Sangalli, Vilar Sampaio, Perecin and Vieira Meirelles2015). Given that developmental differences have been strongly correlated with outcomes, understanding the underlying metabolic physiology of the developing embryo is one of the most important and challenging tasks in reproductive biotechnology (Nel-Themaat & Nagy, Reference Nel-Themaat and Nagy2011). For all mammalian species, it is critical that a precise mechanism of assessing embryo quality be applied prior to embryo transfer, manipulation, or cryopreservation to ensure the highest success rate post-transfer and to understand embryo developmental dynamics. While morphological grading and morphokinetics provide a simple assessment of embryo developmental dynamics as it correlates to predictive potential, a more in-depth understanding of the intrinsic differences remains elusive (Desai et al., Reference Desai, Goldstein, Rowland and Goldfarb2000; Mori et al., Reference Mori, Otoi and Suzuki2002). Embryo-grading schemes offer a quick, convenient, and inexpensive means for determining which embryo(s) in a cohort have the highest developmental potential (Hoover et al., Reference Hoover, Baker, Check, Lurie and O'Shaughnessy1995; Bajaj & Sharma, Reference Bajaj and Sharma2011). The fundamental parameters for assessing an embryo are largely based on degree of fragmentation, size and shape of blastomeres, coalescence of morula and inner cellular mass (Lechniak et al., Reference Lechniak, Pers-Kamczyc and Pawlak2008; Herrero & Meseguer, Reference Herrero and Meseguer2013). Cleavage rate has also been strongly correlated with viability, as numerous studies have demonstrated an association between fast growing (FG) embryos and blastocyst and or/pregnancy rate (Yadav et al., Reference Yadav, King and Betteridge1993; Sakkas et al., Reference Sakkas, Percival, D'Arcy, Sharif and Afnan2001; Salumets et al., Reference Salumets, Hyden-Granskog, Makinen, Suikkari, Tiitinen and Tuuri2003; Lechniak et al., Reference Lechniak, Pers-Kamczyc and Pawlak2008; Luna et al., Reference Luna, Copperman, Duke, Ezcurra, Sandler and Barritt2008; Lee et al., Reference Lee, Thouas and Gardner2015). However, morphological assessments, in spite of their importance, do not consistently and accurately predict an embryo's developmental potential (Khatib et al., Reference Khatib, Huang, Wang, Tran, Bindrim, Schutzkus, Monson and Yandell2009; Nel-Themaat & Nagy, Reference Nel-Themaat and Nagy2011), nor do they provide an understanding of the embryo's physiology.
The advent of metabolomics has provided alternative, adjunctive technologies for understanding an embryos developmental patterns and metabolic physiology. As the final downstream product of the genome, the metabolome is the total inventory of small molecular weight compounds (metabolites; < 1 kDa) present within a biological system. These compounds include amino acids, carbohydrates, organic acids, amino acids, nucleic acids, and vitamins (Zhang et al., Reference Zhang, Sun, Wang, Han and Wang2012) and are involved in normal function, growth and maintenance of a cell or organism; metabolites are thought to more closely reflect the response of a cell to a variety of genetic and environmental influences (Dunn et al., Reference Dunn, Bailey and Johnson2005; Ellis et al., Reference Ellis, Dunn, Griffin, Allwood and Goodacre2007; Pudakalakatti et al., Reference Pudakalakatti, Uppangala, D'Souza, Kalthur, Kumar, Adiga and Atreya2013). As a high-throughput and robust tool, metabolomics can identify alterations in the steady state and transient intracellular metabolite concentrations at a given time (Goodacre et al., Reference Goodacre, Vaidyanathan, Dunn, Harrigan and Kell2004; Dunn et al., Reference Dunn, Bailey and Johnson2005; Seli et al., Reference Seli, Robert and Sirard2010). Several studies conducted in humans (Brison et al., Reference Brison, Houghton, Falconer, Roberts, Hawkhead, Humpherson, Lieberman and Leese2004; Seli et al., Reference Seli, Botros, Sakkas and Burns2008, Reference Seli, Bruce, Botros, Henson, Roos, Judge, Hardarson, Ahlström, Harrison, Henman, Go, Acevedo, Siques, Tucker and Sakkas2011; Marhuenda-Egea et al., Reference Marhuenda-Egea, Gonsalvez-Alvarez, Martinez-Sabater, Lledo, Ten and Bernabeu2010; Zhao et al., Reference Zhao, Yin, Peng, Zou, Yang, Shen and Hu2013) and mice (Gardner & Leese, Reference Gardner and Leese1987) have provided insights into the metabolic differences between successful and non-successful outcomes. However, can an NMR metabolomics approach be sensitive enough to differentiate embryos developing at different rates? How are slow developing embryos different from the ones developing at a faster rate and can metabolomics approach be used to ascertain and delineate the developmental differences? Most of the studies conducted to understand metabolic differences in bovine have been done on pooled embryos (Rosenkrans et al., Reference Rosenkrans, Zeng, MCNamara, Schoff and First1993; Wrenzycki et al., Reference Wrenzycki, Herrmann, Carnwath and Niemann1996; Krisher et al., Reference Krisher, Lane and Bavister1999; Khurana & Niemann, Reference Khurana and Niemann2000), which provides mean values of embryo at the extremes of metabolic scale.
Therefore for this study conducted on embryos cultured individually, we hypothesize that slow growing (SG) embryos will differ in their metabolic rates and will consume or secrete metabolites differently than the FG embryos. The specific aim of this study therefore was to elucidate metabolomic differences between fast (FG) and slow (SG) growing bovine preimplantation embryos. To the best of our knowledge, this is the first study to metabolomically elucidate the differences in the spent medium of differentially growing bovine embryos being cultured in vitro using a proton nuclear magnetic resonance analysis from individually cultured embryos.
Materials and Methods
In vitro production of bovine embryos
In vitro embryo production was adapted from work previously done by Favetta et al. (Reference Favetta, Robert, St John, Betts and King2004, Reference Favetta, Madan, Mastromonaco, St, King and Betts2007). Bovine ovaries were collected from a local slaughterhouse (Guelph, ON, Canada) and transported to the laboratory in Thermo-Flasks containing phosphate-buffered saline (NaCl, 136.9 mM; Na2HPO4, 8.1 mM; KCL, 1.47 mM; KH2PO4, 1.19 mM; MgCl2.6H2O, 0.49 mM) that was maintained at a temperature of approximately 35–36°C. Follicular aspiration from follicles ranging between 4 and 8 mm using an 18G Vacutainer needle was collected into HEPES-buffered Hams F-10 (Sigma-Aldrich, Oakville, ON, Canada), supplemented with 2% donor calf serum (PAA Laboratories Inc., ON, Canada). Cumulus–oocyte complexes (COC) were washed twice in maturation medium consisting of TCM-199 plus 2% donor calf serum and twice in maturation medium with the addition of 0.5 μg/ml of FSH, 1 μg/ml of LH and 1 μg/ml of estradiol (Sigma-Aldrich). Groups of approximately 15–20 COCs with homogenous cytoplasms and at least 4–5 layers of compact cumulus were matured in 80 μl maturation medium drops under silicone oil (Sigma-Aldrich) for 22 to 24 h at 38.5°C under an atmosphere of 5% CO2 in air with maximum humidity. Following maturation, oocytes were washed two times in 1 ml of HEPES-buffered Tyrode's albumin-lactate-pyruvate medium (HEPES/Sperm TALP) supplemented with 15% BSA (0.0084 mg/ml final; fatty acid free, Sigma-Aldrich) and two times in fertilization medium consisting of IVF-TALP (IVF-TALP consisting of Tyrode's solution, supplemented with 15% BSA and 2 mg/ml heparin (Sigma-Aldrich)). Approximately 25–30 COCs were placed in 80 μl fertilization drops under silicone oil (Sigma-Aldrich). Frozen–thawed bovine semen (Gencor, Guelph, ON, Canada) was prepared by swim-up technique. Thawed semen was added to HEPES/Sperm TALP medium supplemented with 15% BSA (0.0084 mg/ml final) for 1 h at 38.5°C under an atmosphere of 5% CO2 in air with maximum humidity before centrifugation at 200 g for 10 min. COCs and sperm were co-incubated at a final concentration of ~1 × 10⁶ motile sperm/ml at 38.5°C under an atmosphere of 5% CO2 in air with maximum humidity. At approximately 18 h after insemination, presumptive zygotes were denuded by gentle vortexing for 90 s, washed twice in HEPES/Sperm TALP and twice in in vitro culture (IVC) medium, consisting of 10 ml synthetic oviductal fluid (SOF; CaCl2.2H2O, 1.17 mM; KCL, 7.16 mM; KH2PO4, 1.19 mM; MgCl2.6H2O, 0.49 mM; NaCl, 107.7 mM; NaHCO3, 25.07 mM, Na lactate (60% syrup), 3.3 mM; Chemicon-Millipore, Billerica, MA, USA) supplemented with 200 μl of non-essential amino acids (glycine, l-alanine, l-asparagine, l-aspartic acid, l-glutamic acid, l-proline, l-serine; all 0.2 mM final), 100 μl of essential amino acids (l-arginine hydrochloride, 0.6 mM final; l-cysteine, 0.1 mM final; l-histidine hydrochloride-H2O, 0.2 mM final; l-isoleucine, 0.4 mM final; l-leucine, 0.4 mM final; l-lysine hydrochloride, 0.4 mM final; l-methionine, 0.1 mM final; l-phenylalanine, 0.2 mM final; l-threonine, 0.4 mM final; l-tyrosine, 0.2 mM final; l-tryptophan, 0.05 mM final; l-valine, 0.4 mM final), 50 μl of sodium pyruvate (0.00886 mg/ml final), 5 μl of gentamicin (25 mg/ml final; all from Invitrogen, Burlington, ON, Canada), 560 μl of 15% BSA (0.0084 mg/ml final) in SOF and 200 μl of 2% donor calf serum (PAA Laboratories, Etobicoke, Ontario, Canada). Presumptive zygotes with homogenous cytoplasms were individually cultured in 40 μl culture drops under silicone oil (Sigma-Aldrich) at 38.5°C under an atmosphere of 5% CO2, 5% O2, 90% N2 for up to 8 days. Embryos remained within the same culture medium for the entire length of culture; no change or addition of medium took place during this time. Additionally, 40 μl plain medium control SOF drops (i.e. medium without embryos) were also placed under silicone oil (Sigma-Aldrich) at 38.5°C under an atmosphere of 5% CO2, 5% O2, 90% N2 for 192 hpf.
Optimization of single embryo culture
Establishment and validation of individually cultured embryos was necessary prior to the metabolomic analysis of individually cultured embryos. To test this, presumptive zygotes (matured and fertilized as described above) were cultured in 40 μl drops under silicone oil either individually (n = 545) or with 1 to 2 μl/embryo, 30 embryos/drop (n = 558) at 38.5°C under an atmosphere of 5% CO2, 5% O2, 90% N2 for up to 192 hpf and blastocyst rates were recorded. Analysis of blast rates in group versus single embryo culture was analyzed by Student's t-Test (GraphPad Prism 4.0b,La Jolla, CA, USA).
Collection of medium
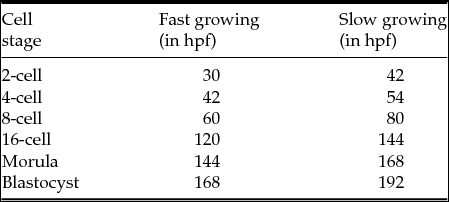
Embryos were classified as fast growing (FG) or slow growing (SG) based on their cleavage times in hours post fertilization (hpf; Table 1) as previously described by Van Soom et al. (Reference Van Soom, Ysebaert and de Kruif1997). In brief, spent medium from individually cultured developmentally delayed embryos (SG) were collected at the 2-cell, 4-cell, 8-cell, 16-cell, morula, and blastocyst stages approximately 12–24 h after collection of their FG counterpart. It was ensured that while the spent medium samples were collected for each embryonic stage, the embryo stages were matched between the SG and FG groups. For example, a spent medium sample from SG blastocyst was collected with similar morphology to its FG counterpart. Morphology scores were given to each embryo at the time of medium collection as adapted from previous published work (Puissant et al., Reference Puissant, Van Rysselberge, Barlow, Deweze and Leroy1987; Steer et al., Reference Steer, Mills, Tan, Campbell and Edwards1992; Farin et al., Reference Farin, Britt, Shaw and Slenning1995; Gardner et al., Reference Gardner, Lane, Stevens, Schlenker and Schoolcraft2000). See Table S1 for a description of morphological scores given to the embryo. In total, 113 spent medium samples were analyzed using 1H NMR. Of these, nine medium samples from nine different embryos growing in culture (i.e. nine replicates) were collected for FG and SG embryos at each developmental stage (2-cell, 4-cell, 8-cell, 16-cell, morula and blastocyst stages). Due to sample loss during 1H NMR preparations only eight total spent medium samples from FG 16-cell and FG morula embryos, as well as seven total spent medium samples from embryos for SG morula were analyzed. In addition to these groups, plain medium (PM) control samples were collected at the time of SG blastocyst collection and processed as controls (nine plain medium controls (i.e. nine replicates)). Unspent PM samples were subject to the same conditions as embryos growing in culture and were collected at the blastocyst stage (192 hpf). At the time of medium collection, the embryos were also removed and flash frozen in liquid nitrogen for follow-up transcriptomic studies.
Classification of FG and SG bovine embryos produced in vitro and their respective times for collection of spent culture medium. Medium from SG embryos were collected 12–24 h after collection of their FG counterpart. Time is expressed in hpf or hours post fertilization. Plain medium samples were collected at the time of SG blastocyst collection

At the appropriate embryonic developmental stage and time post fertilization, 18 μl of spent medium (mixed by gentle pipetting) was diluted in 612 μl of 100% deuterium oxide (D2O; Sigma-Aldrich) prepared with 25 mmol/l sodium phosphate buffer (Na2HPO4; Sigma-Aldrich) and with 0.1 mmol/l TSP (sodium 3-(trimethyl-2,2,3,3)-1-propionic acid d4; Sigma-Aldrich) final concentration. The TSP also served as a chemical shift reference molecule for the 1H NMR analysis (Dunn et al., Reference Dunn, Bailey and Johnson2005), whereas the sodium phosphate buffer maintained the pH. All samples were filtered in a pre-washed filter to remove cellular debris and mineral oil using 13mm syringe filters (0.22 μm pore size; Fisher Scientific, Ottawa, Canada). Filters were pre-washed to remove any residual compounds present on the membrane by rinsing three times with 5 ml of MilliQ H2O, followed by a final rinse of 1 ml of deuterium oxide. Once samples were filtered, they were vortexed briefly, spun for 30 s at 300 g and frozen at −80°C until analysis.
1H NMR spectroscopy
Samples were thawed at room temperature for 30–40 min and analyzed on a Bruker AVIII spectrometer (Bruker BioSpin, Germany) equipped with a 5 mm CPTCI probe (Bruker BioSpin) and operated at 600.13 MHz for proton. 1D spectra were acquired at 298 K using a composite pulse pre-saturation sequence as described by Bax (Reference Bax1985). For each sample, 256 scans of 64 k data points were acquired with a 90° pulse angle of 8.50 μs, a spectral width of 6009 Hz, acquisition time of 5.45 s and relaxation delay (d1) of 10 s. An exponential line broadening of 0.30 Hz was employed and spectra were zero-filled to 128 K data points. Spectra's were processed by TOPSPIN 2.1 software (Bruker BioSpin) and processed for phase and baseline correction. Metabolites were identified by running spiked standards, through other published work (Botros et al., Reference Botros, Sakkas and Seli2008; Piñero-Sagredo et al., Reference Piñero-Sagredo, Nunes, de los Santos, Celda and Esteve2010; Seli et al., Reference Seli, Botros, Sakkas and Burns2008; Tiziani et al., Reference Tiziani, Emwas, Lodi, Ludwig, Bunce, Viant and Günther2008). Integral regions were manually defined in TOPSPIN 2.1 for the first PM spectrum, and those defined integral regions were applied to each spectrum to ensure no variation in the integral. The integral, or area under the metabolite peak, was defined by Integration areas of 1H chemical shifts were ratioed directly to TSP (δ = 0.000) to obtain the metabolites relative quantity.
Data analysis and statistics
An analysis of variance (ANOVA) with factorial treatment design was introduced to detect difference between embryo stages among metabolites. Univariate analyzes were carried out on each individual metabolite identified using the Statistical Analysis System (SAS; Cary, NC, USA). The Proc Mixed procedure in SAS was employed for this dataset using a least-squares-means to take into account other factors in the model above those of stage (2-cell, 4-cell, etc.) and cell (fast or slow), followed by a Tukey's adjustment corrected for multiple comparisons.
The mixed effects model is as follows:
 $$\begin{equation*}
{Y_{ijk}} = \mu + {\rm{Stag}}{{\rm{e}}_i} + {\rm{Cel}}{{\rm{l}}_j} + {\rm{Stag}}{{\rm{e}}_i}_{\rm{X}}{\rm{Cel}}{{\rm{l}}_j} + {\rm{Erro}}{{\rm{r}}_{ijk}}
\end{equation*}$$
where: Stage i = 2-cell, 4-cell, 8-cell, 16-cell, morula, blastocyst; cell j = fast growing, slow growing.
All values were expressed as the mean ± standard error of the mean (SEM). All differences were considered significantly different when the P-value was < 0.05 using the least-squares-means test. Individual metabolites analyzed were log-transformed if assumptions of normality were not met.
Principal component analysis (PCA) was subsequently performed as a multivariate, unsupervised method, was used to reduce the dimensionality of the dataset. The Proc Princomp procedure in SAS was used for the PCA. In brief, all raw integrated data points that were ratioed to TSP from the spectral outputs for each individual metabolite and were amalgamated together depending on their respective group (i.e. FG, SG, PM), but not separated based on their cell stage (2-cell to 16-cell, morula and blastocyst). The first three eigenvectors, accounting for 80% of the variation were selected for the 3D-scatterplot.
All graphs and plots were produced using SigmaPlot 10.0 (San Jose, CA, USA).
Results
Group versus single embryo culture
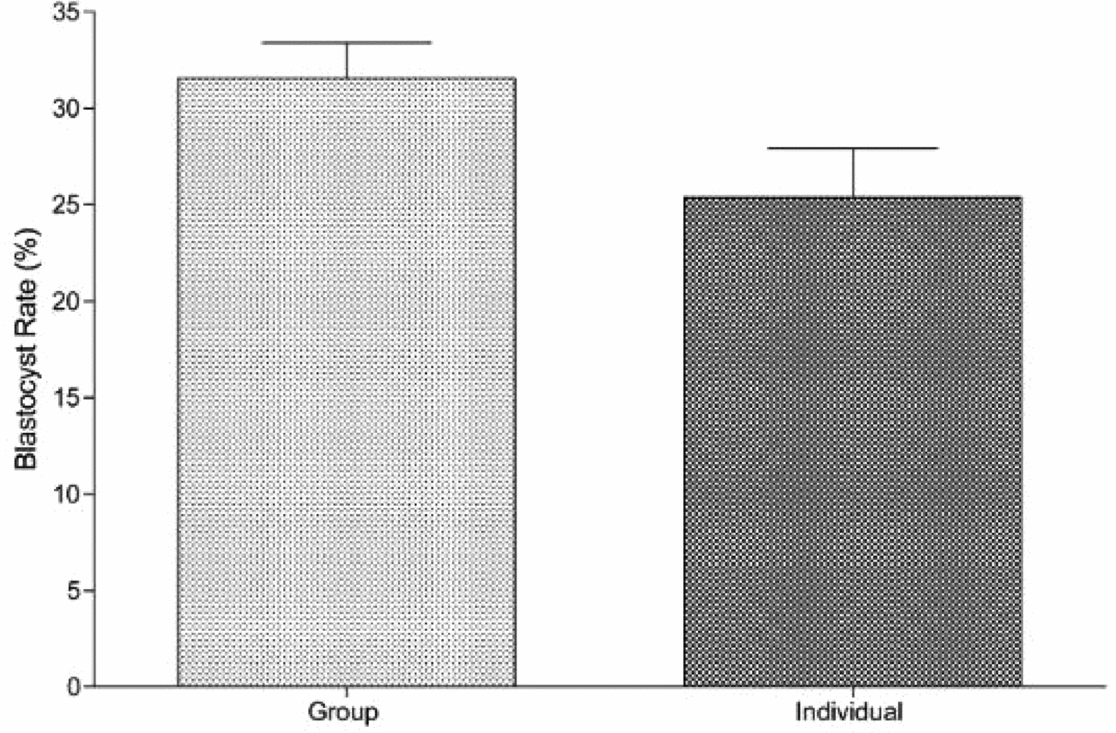
Preliminary experiments on the blastocyst development rates on day 8 did not differ between group and single cultures (Fig. 1). Student's t-Test revealed no statistical difference in the blastocyst rates between group (n = 558) versus single (n = 545) embryo culture (Fig. 1).
Blastocyst rates of group versus individual culture of bovine preimplantation embryos in vitro. In total, 558 presumptive zygotes were cultured in groups of approximately 30 embryos/40 μl drop). For single embryo culture, in total, 545 presumptive zygotes were cultured in 40 μl culture drops. The proportion of embryos that achieved the blastocyst rate on day 8 was calculated as the blastocyst rate. Values are expressed in mean ± standard error of the mean (SEM) as analyzed by Student's t-Test. Statistical significance was reached if the P-value was < 0.05).

Identification of several metabolites in spent medium from single embryos
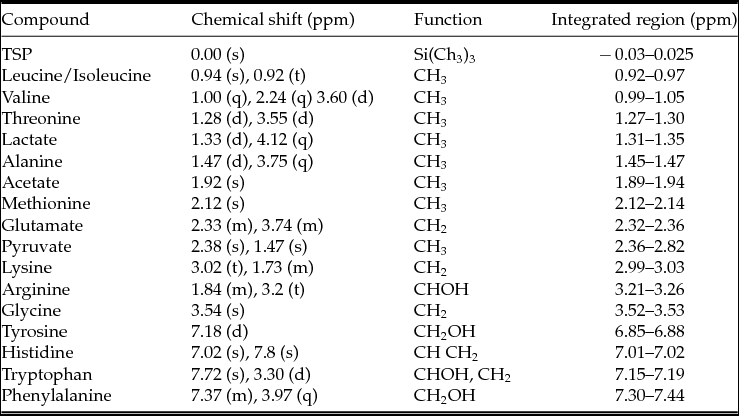
In total, 113 spent medium samples from six developmental stages (as well as controls), in contact with single embryos during the duration of in vitro culture were analyzed using proton NMR spectroscopy. There were 16 major compounds present in the NMR spectra of spent embryo culture medium that included pyruvate, lactate, and acetate, in addition to the amino acids detected such as isoleucine, leucine, valine, threonine, alanine, methionine, glutamate, lysine, glycine, arginine, phenylalanine, histidine tryptophan, tyrosine (Table 2). For a representative NMR spectrum of plain SOF medium and a representative NMR spectrum of spent SOF medium culturing a SG blastocyst (192 hpf), see Figs S1 and S2, respectively.
Select metabolites found in the spent culture medium with their chemical shifts from the 1H NMR spectrum, their signal multiplicity, functional group, and integrated regions. The multiplicities are: singlet (s), doublet (d), triplet (t), quartet (q), multiplet (m)

Relative metabolite changes between slow and fast groups
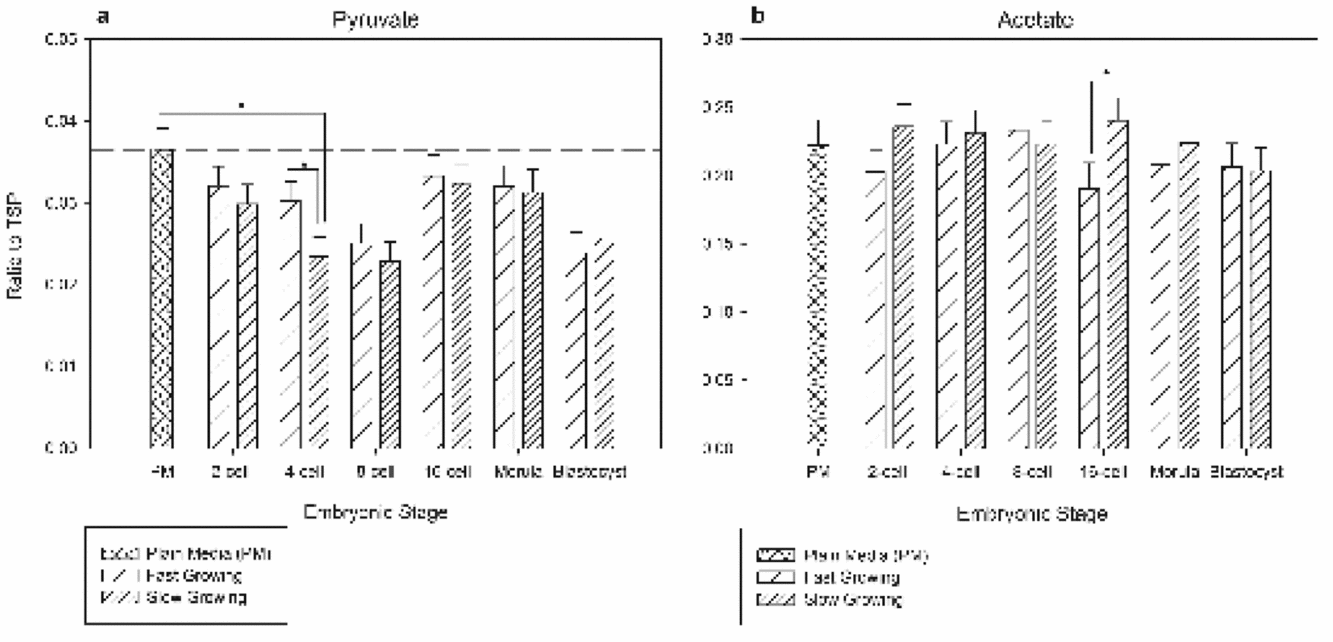
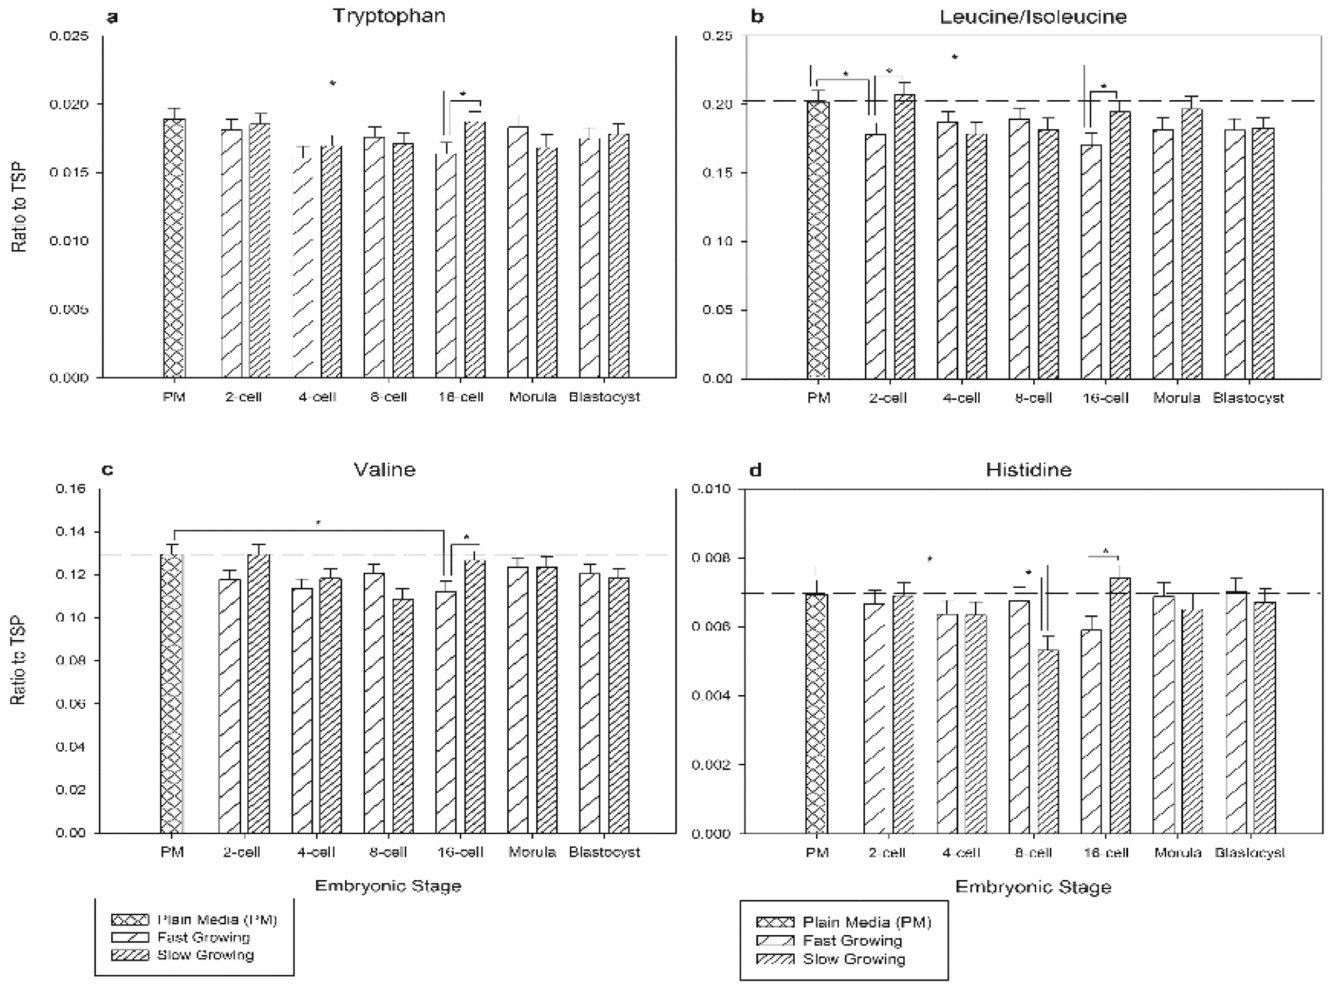
Of the 16 metabolites identified, this paper focuses on six metabolites that differed significantly between FG and SG embryos of the same developmental stage using a one-way ANOVA tests with factorial treatment design with a Tukey's adjustment for multiple comparisons (Figs 2 and 3). At the 4-cell stage, changes were observed in the metabolite pyruvate with a significant (P < 0.05) depletion by SG embryos compared with their FG counterpart (Fig. 2 A). Acetate differed in usage between SG and FG groups demonstrated by a production at the 16-cell stage for SG embryos (Fig. 2 B). Slow growing 16-cell stage embryos had a significantly higher level of tryptophan in the medium compared with their FG counterpart, which was also demonstrated in the levels of valine (Fig. 3 A, C). Isoleucine/leucine had significantly higher usage by 2-cell and 16-cell FG groups (Fig. 3 B). Eight-cell SG embryos consumed significantly more histidine, followed by a higher level of production at the 16-cell stage by SG groups (Fig. 3 D).
A one-way analysis of variance (ANOVA) tests with factorial treatment design was used to study the differences of the average sum/depleted metabolites of SG and FG metabolites within plain culture medium and spent culture medium of slow and fast growing bovine embryos. A Tukey's adjustment corrected for multiple comparisons. Parts (A) and (B) represent pyruvate, and acetate, respectively. Crisscross stripes represent plain medium, light stripped bars are fast growing groups, and heavily striped bars are slow growing groups. Values are expressed in mean ± standard error of the mean (SEM). For each mean n = 9. Bars marked with an asterisk are significantly different from each other (P-value is < 0.05).

A one-way analysis of variance (ANOVA) tests with factorial treatment design was used to study the differences of the average sum/depleted metabolites of SG and FG metabolites within plain culture medium and spent culture medium of slow and fast growing bovine embryos. A Tukey's adjustment corrected for multiple comparisons. Parts (A, B, C, D) are tryptophan, leucine/isoleucine, valine, and histidine, respectively. Crisscross stripes represent plain medium, light stripped bars are fast growing groups, and heavily striped bars are slow growing groups. Values are expressed in mean ± standard error of the mean (SEM). For each mean n = 9. Bars marked with an asterisk are significantly different from each other (P-value is < 0.05).

Principal component analysis
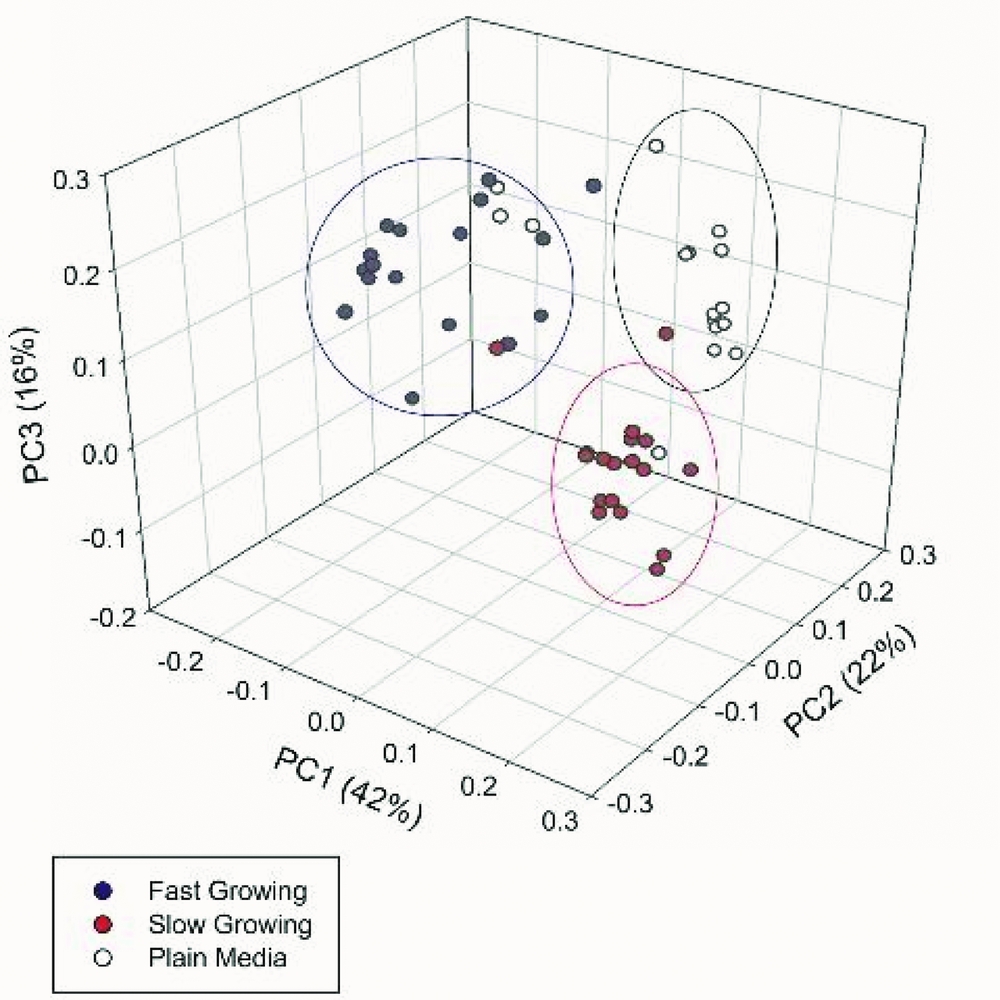
A PCA was conducted on the total data set by combining the data for all of the metabolites measured in order to amalgamate the large number of highly correlated metabolites into a few principal components (PC) that explained the majority of variability in the data. Consequently, scores for the first three PCs explained 80% of the variation in metabolite concentration (Fig. 4). The PCA revealed three clusters, separated along the axes of PC1, PC2, and PC3. PC1 corresponded to the variation observed between PM and slow/fast growing embryos, whereas PC2 explains the variation between SG and FG groups (Fig. 4).
A principal component analysis (PCA) performed on the combined data for the plain medium, slow growing and fast growing embryos. The three principal components (PC) that accounted for 80% of the variation were plotted. Blue circles represent fast growing embryos, red circles represent slow growing embryos and white circles represent plain medium.

Discussion
We have demonstrated that the spent culture medium from individually cultured embryos growing at different developmental rates displays unique metabolomic signatures. To the best of our knowledge, this is the first study to demonstrate the use of a 1H NMR metabolomics approach for understanding metabolomic differences in bovine embryos cultured and analyzed individually. In recent years, the field of metabolomics and embryo metabolism has become an active area of research in human IVF and now in bovine IVP to aid in embryo selection through biomarker discovery (Somfai et al., Reference Somfai, Inaba, Aikawa, Ohtake, Kobayashi, Konishi and Imai2010; Madan, Reference Madan and Moo-Young2011; Muñoz et al., Reference Muñoz, Uyar, Correia, Díez, Fernandez-Gonzalez, Caamaño, Martínez-Bello, Trigal, Humblot, Ponsart, Guyader-Joly, Carrocera, Martin, Marquant Le Guienne, Seli and Gomez2014; Perkel et al., Reference Perkel, Tscherner, Merrill, LaMarre and Madan2015) Previous studies have elucidated that FG embryos generally result in higher implantation and pregnancy rates in both human (Shoukir et al., Reference Shoukir, Campana, Farley and Sakkas1997; Sakkas et al., Reference Sakkas, Percival, D'Arcy, Sharif and Afnan2001; Salumets et al., Reference Salumets, Hyden-Granskog, Makinen, Suikkari, Tiitinen and Tuuri2003; Meseguer et al., Reference Meseguer, Herrero, Tejera, Hilligsøe, Ramsing and Remohí2011) and bovine (Van Soom et al., Reference Van Soom, Ysebaert and de Kruif1997; Lonergan et al., Reference Lonergan, Khatir, Piumi, Rieger, Humblot and Boland1999; Sugimura et al., Reference Sugimura, Akai, Hashiyada, Somfai, Inaba, Hirayama, Yamanouchi, Matsuda, Kobayashi, Aikawa, Ohtake, Kobayashi, Konishi and Imai2012). However, the metabolomic profiles of embryos, on single embryo basis and developing at different rates have not been characterized for the bovine preimplantation embryo until now. In fact, previous work done on analysis of metabolite content in culture medium in humans (Gott et al., Reference Gott, Hardy, Winston and Leese1990), rat (Gardner & Leese, Reference Gardner and Leese1987; Brison & Leese, Reference Brison and Leese1991), and bovine (Gardner et al., Reference Gardner, Pawelczynski and Trounson1996) preimplantation embryos have focused on few metabolites using microfluorometric enzymatic assays to primarily measure metabolites such as pyruvate, lactate and glucose in culture medium. While this technique is fairly sensitive for measuring changes in metabolite levels, microfluorometric enzymatic assays are not favourable for a more complex and comprehensive global metabolite analysis (Urbanski et al., Reference Urbanski, Johnson, Craig, Potter, Gardner and Thorsen2008; Nel-Themaat & Nagy, Reference Nel-Themaat and Nagy2011).
To date, proton nuclear magnetic resonance remains one of the best technical approaches for the generation of metabolomic data from complex biofluids (Alonso et al., Reference Alonso, Marsal and Julià2015). Proton NMR offers a relatively rapid, simultaneous identification of compounds that is highly reproducible and reliable (Tiziani et al., Reference Tiziani, Emwas, Lodi, Ludwig, Bunce, Viant and Günther2008; Pudakalakatti et al., Reference Pudakalakatti, Uppangala, D'Souza, Kalthur, Kumar, Adiga and Atreya2013; Fuhrer & Zamboni, Reference Fuhrer and Zamboni2015). The complex and abundant information that can be obtained from an 1H NMR spectra has been successfully applied to a multitude of biological samples such as urine (Shaykhutdinov et al., Reference Shaykhutdinov, MacInnis, Dowlatabadi, Weljie and Vogel2009; Bouatra et al., Reference Bouatra, Aziat, Mandal, Guo, Wilson, Knox, Bjorndahl, Krishnamurthy, Saleem, Liu, Dame, Poelzer, Huynh, Yallou, Psychogios, Dong, Bogumil, Roehring and Wishart2013), plasma (Kriat et al., Reference Kriat, Confort-Gouny, Vion-Dury, Sciaky, Viout and Cozzone1992) and seminal fluid (Kumar et al., Reference Kumar, Kroetsch, Blondin and Anzar2015), cancer diagnostics (Tiziani et al., Reference Tiziani, Lopes and Günther2009), cerebral spinal fluid (Mandal et al., Reference Mandal, Guo, Chaudhary, Liu, Yallou, Dong, Aziat and Wishart2012), as well as spent culture medium form embryos (Seli et al., Reference Seli, Botros, Sakkas and Burns2008; Marhuenda-Egea et al., Reference Marhuenda-Egea, Gonsalvez-Alvarez, Martinez-Sabater, Lledo, Ten and Bernabeu2010; Sánchez-Ribas et al., Reference Sánchez-Ribas, Riqueros, Vime, Puchades-Carrasco, Jönsson, Pineda-Lucena, Ballesteros, Domínguez and Simón2012; Pudakalakatti et al., Reference Pudakalakatti, Uppangala, D'Souza, Kalthur, Kumar, Adiga and Atreya2013) with many other broad-spectrum applications.
Furthermore, sample preparation is minimal, analysis is non-destructive, and unlike mass spectroscopy (MS) or high performance liquid chromatography (HPLC), chemical bias is minimal and prior knowledge of the samples chemical properties is not necessary for 1H NMR (Dunn et al., Reference Dunn, Bailey and Johnson2005; Ellis et al., Reference Ellis, Dunn, Griffin, Allwood and Goodacre2007).
From our findings we were able to observe distinct differences between slow and FG embryos, in addition to the several studies that have demonstrating the sensitivity and usefulness of 1H NMR (Seli et al., Reference Seli, Botros, Sakkas and Burns2008; Marhuenda-Egea et al., Reference Marhuenda-Egea, Gonsalvez-Alvarez, Martinez-Sabater, Lledo, Ten and Bernabeu2010; Pudakalakatti et al., Reference Pudakalakatti, Uppangala, D'Souza, Kalthur, Kumar, Adiga and Atreya2013). Therefore, it strengthens our case that by using 1H NMR, we can ascertain the end metabolite physiology of embryos growing at differential rates.
The early embryo experiences dramatic changes in metabolite utilization from fertilization to implantation, and the maternal to embryo transition (MET) reflect these highly regulated changes. During preimplantation development, the embryo prefers pyruvate as its main energy substrate via the tricarboxylic acid cycle (TCA) switching to glucose based metabolism following the MET (Khurana & Niemann, Reference Khurana and Niemann2000; Gardner et al., Reference Gardner, Phil and Wale2013; de Souza et al., Reference De Souza, Salles and Rosa e Silva2015). From our results, it was evident that this change did not take place as expected due to the absence of glucose from our culture medium; post MET, the embryos switched immediately back to pyruvate to meet energy requirements (Fig. 2 A).
Pyruvate being an essential metabolite for energy production for the bovine preimplantation embryo suggests it may be an important biomarker of viability, however, the literature has demonstrated conflicting results for pyruvate uptake and therefore its use as a biomarker remains undetermined (Hardy et al., Reference Hardy, Hooper, Handyside, Rutherford, Winston and Leese1989; Gott et al., Reference Gott, Hardy, Winston and Leese1990; Conaghan et al., Reference Conaghan, Handyside, Winston and Leese1993a, Reference Conaghan, Hardy, Handyside, Winston and Leese1993b; Turner et al., Reference Turner, Martin, Woodward, Lenton and Leese1994). High pyruvate uptake by preimplantation embryos and its correlation with either blastocyst development (Hardy et al., Reference Hardy, Hooper, Handyside, Rutherford, Winston and Leese1989; Gott et al., Reference Gott, Hardy, Winston and Leese1990) or pregnancy and delivery (Seli et al., Reference Seli, Botros, Sakkas and Burns2008) has been reported. Contrary to this, a study by Conaghan et al. (Reference Conaghan, Hardy, Handyside, Winston and Leese1993b) demonstrated significantly higher pyruvate uptake by human day 2 embryo that failed to implant (27.1 ± 0.6 pmol/embryo/h) versus day 2 embryos that successfully implanted (22.9 ± 1.0 pmol/embryo/hr). In this study, we demonstrated a significantly higher consumption of pyruvate at the 4-cell stage by SG compared with FG embryos (Fig. 2 A). Given the results, SG embryos require more energy substrate, a vital metabolite for the TCA. By consuming more pyruvate, it can be indicative of intrinsic stress, such as DNA damage or initiation of apoptosis, which are both energy demanding pathways (Liu et al., Reference Liu, Kim, Yang, Jemmerson and Wang1996; Eguchi et al., Reference Eguchi, Shimizu and Tsujimoto1997). Pyruvate as a biomarker of health for the bovine preimplantation embryo has yet to be determined, however from our results, this metabolite may provide valuable information regarding the embryos health status as early as the 4-cell stage.
Acetate is an intermediary energy metabolite that can easily cross the cellular and mitochondrial membrane and has been found to be taken up by rabbit ovum (Kane, Reference Kane1987). In the bovine preimplantation embryo, its use as an energy source is quite limited as its entry into the TCA cycle is regulated by acetyl coenzyme-A (acetyl-CoA; Knowles et al., Reference Knowles, Jarrett, Filsell and Ballard1974; Waugh & Wales, Reference Waugh and Wales1993). Acetate was significantly higher in SG 16-cell embryos compared with their developmental counterpart (Fig. 2 B), a result that may be due to higher enzymatic activity of acetyl-CoA hydrolase. It may be possible that acetyl-CoA is being shuttled to acetate, reducing the amount of acetyl-CoA entering the TCA cycle and therefore reducing net ATP production. This may account for delayed growth observed, but at this time it is just speculative and further studies are required to ascertain the mechanism. Amino acid turnover (i.e. the sum and depletion of amino acids from the culture medium) has been one approach to studying embryo viability metabolomically (Houghton et al., Reference Houghton, Hawkhead, Humpherson, Hogg, Balen, Rutherford and Leese2002; Brison et al., Reference Brison, Houghton, Falconer, Roberts, Hawkhead, Humpherson, Lieberman and Leese2004; Booth et al., Reference Booth, Humpherson, Watson and Leese2005). Amino acids serve a variety of very important functions in the early preimplantation embryo such as being involved in protein and mRNA synthesis, serving as a precursor for signaling molecules such as nitric oxide, acting as important chelators, pH and osmolarity regulators, and antioxidants, among others (Epstein & Smith, Reference Epstein and Smith1973; Van Winkle & Campione, Reference Van Winkle and Campione1996; Dumoulin et al., Reference Dumoulin, Van Wissen, Menheere, Michiels, Geraedts and Evers1997; Edwards et al., Reference Edwards, Williams and Gardner1998; Lane & Gardner, Reference Lane and Gardner1998; Houghton et al., Reference Houghton, Hawkhead, Humpherson, Hogg, Balen, Rutherford and Leese2002; Collado-Fernandez et al., Reference Collado-Fernandez, Picton and Dumollard2012). In our study, tryptophan and valine levels differed significantly between SG and FG groups at the 16-cell stage with a significant depletion of 16-cell FG compared with PM (Fig. 3 A,C). These amino acids are essential and important for embryo development, and the lack of usage by SG groups at the 16-cell stage suggests aberrant amino acid metabolism.
Leucine and Isoleucine showed interesting results by a significantly higher level of consumption by 2-cell and 16-cell FG embryos compared with their SG counterpart (Fig. 3 B). In a study by Brison et al. (Reference Brison, Houghton, Falconer, Roberts, Hawkhead, Humpherson, Lieberman and Leese2004), decreased leucine levels in the embryo culture medium correlated with pregnancy rate. Similar results were found by Houghton et al. (Reference Houghton, Hawkhead, Humpherson, Hogg, Balen, Rutherford and Leese2002), who used HPLC to determine that leucine levels were lower in the culture medium of human embryos that develop to the blastocyst stage. In contrast to these studies as well as our study, Partridge & Leese (Reference Partridge and Leese1996) observed a net increase in leucine and isoleucine by 4-cell embryos and a net increase in leucine by 16-cell embryos. The higher level of leucine/isoleucine not being utilized by the SG embryo suggests possible faulty amino acid transport system.
Similarly, histidine was another amino acid that demonstrated a significant difference at the 8-cell and 16-cell stage (Fig. 3 D). Eight-cell SG groups consumed significantly more than their FG counterpart, whereas 16-cell SG groups produced significantly more than their FG counterpart. Histidine is an important precursor for histamine through the action of histidine decarboxylase (Butler & Biggers, Reference Butler and Biggers1989). The function of histamine has been identified as being involved in embryo development (Dey & Johnson, Reference Dey and Johnson1980; Hudgins et al., Reference Hudgins, Mukerjee and Dey1982), implantation (Dey, Reference Dey1981; Zhao et al., Reference Zhao, Ma, Das, Dey and Paria2000), and decidualization (Zhao et al., Reference Zhao, Ma, Das, Dey and Paria2000). It is believed that histidine production by the developing embryo stimulates histamine formation within the uterus, and that histamine directly acts on the H2 receptor of the developing blastocyst, stimulating zona pellucida hatching and implantation (Zhao et al., Reference Zhao, Ma, Das, Dey and Paria2000). From our findings, the high consumption at the 8-cell stage, followed by the production of histidine at the 16-cell stage suggests faulty amino acid transport systems for our SG groups.
The ‘Quiet Embryo Hypothesis’ proposed by Henry Leese (Reference Leese2002) states that human and murine embryos have higher developmental potential if there is reduced amino acid turnover during development (Leese et al., Reference Leese, Sturmey, Baumann and McEvoy2007, Reference Leese, Baumann, Brison, McEvoy and Sturmey2008). Our data in contrast show that amino acid consumption was higher in the FG groups compared with the SG embryos (Fig. 3 A–D). This suggests that fast developing embryos are using more resources to grow during development. Moreover, FG embryos are depicted in the literature as being viable and/or healthy than their SG counterpart for both fresh (Yadav et al., Reference Yadav, King and Betteridge1993; Ziebe et al., Reference Ziebe, Petersen, Lindenberg, Andersen, Gabrielsen and Andersen1997; Lechniak et al., Reference Lechniak, Pers-Kamczyc and Pawlak2008; Somfai et al., Reference Somfai, Inaba, Aikawa, Ohtake, Kobayashi, Konishi and Imai2010) and frozen embryos (Edgar et al., Reference Edgar, Jericho, Bourne and McBain2001). This discrepancy could stem from the fact that human and murine studies have been conducted on a different set of culture media (Lee et al., Reference Lee, Thouas and Gardner2015) therefore making the comparison very difficult. Further studies would be required for further validation.
PCA analysis demonstrates distinct clustering between PM, SG and FG groups (Fig. 4). Principal component analyzes are robust tools for combining several variables, both explanatory and unexplanatory, into a few PCs that help to explain the variability within the experiment (Jolliffe, Reference Jolliffe1972). When all of the data was considered together, it is clear that there are differences between treatment groups. While only few differences were observed between SG and FG groups of the same developmental stage (i.e. the six metabolites previously discussed), the PCA further supports our hypothesis that SG and FG embryos do differ metabolomically.
In conclusion, this research provides evidence towards understanding the metabolic dynamics of the bovine preimplantation embryo in correlation to their developmental rates. The differences observed between SG and FG at the various developmental stages suggest that 1H NMR is a relatively sensitive method for profiling spent embryo culture medium for end metabolites. This study also demonstrates that metabolomic signatures of embryos cultured individually can be obtained which provides a fundamental platform towards the future use of metabolomics for the non-invasive assessment of embryo health and viability for mammalian embryos.
Acknowledgements
The authors gratefully acknowledge Valerie Robertson from the NMR Centre at the University of Guelph for her significant contributions to this project. We also appreciate the assistance of Liz St. John, Ed Reyes, Monica Antenos, Esther Semple, Michelle Edwards, Peter Scheffer, Jason Vieira, Sonja Swanson, and Olivier Stoffyn. A special thank you to Dr W. Allan King for his support and guidance throughout the course of this experiment.
Declaration of interest
The authors declare that there is no conflict of interest that could be perceived as prejudicing the impartiality of the research reported.
Funding
This work was supported by the Natural Sciences and Engineering Research Council of Canada [400735] and Dairy Farmers of Ontario [050607].
Supporting information
Additional supporting information is available online at the publisher's website.
Figure S1 Representative NMR spectrum of plain SOF medium.
Figure S2 Representative NMR spectrum of SOF medium culturing a slow growing blastocyst (192 hpf).
Table S1 Embryo scoring system used for embryo selection.
Supplementary material
To view supplementary material for this article, please visit https://doi.org/10.1017/S0967199417000417