Introduction
The teleost retina adds new neurons throughout life to support regular retinal growth and regeneration following injury (Otteson & Hitchcock, Reference Otteson and Hitchcock2003; Stenkamp, Reference Stenkamp2007; Lenkowski & Raymond, Reference Lenkowski and Raymond2014). Persistent neurogenesis and shifts in opsin expression also allow the functional morphology of the retina to change over the course of development, as fish mature through ecologically distinct developmental stages (Novales Flamarique, Reference Novales Flamarique2000; Taylor & Grace, Reference Taylor and Grace2005; Shand et al., Reference Shand, Davies, Thomas, Balmer, Cowing, Pointer, Carvalho, Trezise, Collin, Beazley and Hunt2008; Temple et al., Reference Temple, Veldhoen, Phelan, Veldhoen and Hawryshyn2008; Fuller & Claricoates, Reference Fuller and Claricoates2011; Taylor et al., Reference Taylor, Loew and Grace2011a; Sabbah et al., Reference Sabbah, Hui, Hauser, Nelson and Hawryshyn2012). Some aspects of teleost retinal morphology and photoreceptor opsin expression are exquisitely adapted to ecological need with respect to diurnal/nocturnal behavior (Taylor et al., Reference Taylor, Loew and Grace2011a; Pusch et al., Reference Pusch, Wagner, von der Emde and Engelmann2013), spectrum of available light (Shand et al., Reference Shand, Hart, Thomas and Partridge2002; Taylor et al., Reference Taylor, Loew and Grace2011a), amount of available light (Wagner et al., Reference Wagner, Fröhlich, Negishi and Collin1998; Taylor et al., Reference Taylor, Loew and Grace2011a; Kreysing et al., Reference Kreysing, Pusch, Haverkate, Landsberger, Engelmann, Ruiter, Mora-Ferrer, Ulbricht, Grosche, Franze, Streif, Schumacher, Makarov, Kacza, Guck, Wolburg, Bowmaker, von der Emde, Schuster, Wagner, Reichenbach and Francke2012; Francke et al., Reference Francke, Kreysing, Mack, Engelmann, Karl, Makarov, Guck, Kolle, Wolburg, Pusch, von der Emde, Schuster, Wagner and Reichenbach2014), migratory behavior (Temple et al., Reference Temple, Veldhoen, Phelan, Veldhoen and Hawryshyn2008), and species recognition (Siebeck et al., Reference Siebeck, Parker, Sprenger, Mäthger and Wallis2010). Many marine teleosts progress through morphologically and ecologically distinct larval, juvenile, and adult stages that have different visual requirements. Comparative analysis of retinal development in relation to ecology can increase our understanding of the functional anatomy of the retina, the relationship between retinal architecture and ecology, and the mechanisms that drive retinal neurogenesis.
Retinal organization and function differ among ecologically distinct species, but mechanisms that drive species-specific differences in retinal neurogenesis are largely unknown. Exposure to different photic habitats can drive changes in opsin gene expression (Shand et al., Reference Shand, Davies, Thomas, Balmer, Cowing, Pointer, Carvalho, Trezise, Collin, Beazley and Hunt2008; Fuller & Claricoates, Reference Fuller and Claricoates2011), as can changes in circulating hormone levels (Cheng et al., Reference Cheng, Gan and Flamarique2009). Differences in the light environment were found to have no effect on early photoreceptor genesis in the goldfish (Carassius auratus) retina (Powers et al., Reference Powers, Bassi and Raymond1988). However, the effects of the light environment on photoreceptor genesis have not been investigated in teleosts that transition through different light environments during ontogeny. Changes in the light environment can occur within the lifetime of a fish due to migration, habitat change, eutrophication, etc. It is, therefore, important to determine if the light environment can influence photoreceptor genesis, in order to better understand the degree of developmental plasticity in the teleost retina and the mechanisms underlying retinal neurogenesis.
Teleost fishes in the subdivision Elopomorpha begin life as leptocephalus larvae—a larval form that has several shared features that are unique to this assemblage (Smith, Reference Smith and Böhlke1989). One of these features is a rod-dominated retina in all elopomorph larvae studied so far (Blaxter & Staines, Reference Blaxter and Staines1970; Pankhurst, Reference Pankhurst1984; Omura et al., Reference Omura, Uematsu, Tachiki, Furukawa and Satoh1997; Taylor et al., Reference Taylor, Loew and Grace2011a; Taylor et al., Reference Taylor, Loew and Grace2011b)—contrasting with the cone-dominated or pure-cone retina of most other teleost larvae (Hubbs & Blaxter, Reference Hubbs and Blaxter1986; Evans & Fernald, Reference Evans and Fernald1990; Evans & Fernald, Reference Evans and Fernald1993; Negishi & Wagner, Reference Negishi and Wagner1995; Shand, Reference Shand1997; Helvik et al., Reference Helvik, Drivenes, Harboe and Seo2001; Lara, Reference Lara2001). All elopomorph larvae are thought to hatch in an open oceanic environment due to limited osmoregulatory abilities and the isosmotic (to seawater) nature of their bodies (Smith, Reference Smith and Böhlke1989). Despite these similarities among elopomorph larvae, there is dramatic morphological and ecological diversity among elopomorph species following metamorphosis. This group is, therefore, an excellent model system for comparing ontogenic change in functional morphology of the retina in relation to ecology.
The ladyfish, Elops saurus, is a large, fast-swimming, pelagic feeder that lives in coastal waters and estuaries, and is diurnal and nocturnal (Sogard & Powell, Reference Sogard and Powell1989), often feeding near the surface (personal observation). The bonefish, Albula vulpes, is a highly sought-after game fish that frequents shallow, clear, tropical waters. It is a diurnal, demersal predator of mollusks, crustaceans, and fishes (Crabtree et al., Reference Crabtree, Stevens and Snodgrass1998), spending much of its time feeding on shallow sand flats in water less than 2 m deep (Humston et al., Reference Humston, Ault, Larkin and Luo2005). The speckled worm eel, Myrophis punctatus, burrows in sediment up to 80% of the time after the larval stage (Able et al., Reference Able, Allen, Bath-Martin, Hare, Hoss, Marancik, Powles, Richardson, Taylor, Walsh, Warlen and Wenner2011), and adults are active at night (personal observation), suggesting limited exposure to bright light. These three species are morphologically similar as leptocephalus larvae (and are therefore grouped into the Elopomorpha assemblage), but due to their dissimilarities as adults they are placed into separate orders (E. saurus—Elopiformes; A. vulpes—Albuliformes; M. punctatus—Anguilliformes). The morphological and ecological divergence of these three species as they mature from larvae to adults provided an opportunity for comparing ontogenic changes in retinal structure and function in relation to ecology. Furthermore, postsettlement, de-novo cone genesis in M. punctatus allowed experiments to test the effect of different light environments on cone cell genesis during a key period of ecological and retinal transition.
Materials and methods
Animals
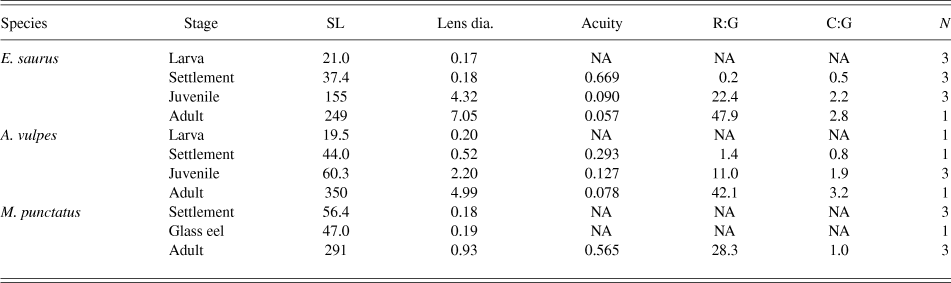
All protocols and experiments involving live animals were approved by the Institutional Animal Care and Use Committee at the Florida Institute of Technology. Specimens in which retinal cells were quantified are listed in Table 1 along with mean standard lengths (SL—tip of snout to base of tail), lens diameters, and calculated visual acuity (see below). Additional specimens used for immunohistochemistry and microspectrophotometry (MSP) are not listed in the table, but are described in the text. Premetamorphic leptocephalus larvae of E. saurus, A. vulpes, and M. punctatus were collected from the Florida Straits, from 0–100 m depths by MOCNESS plankton net during routine plankton surveys (Richardson & Cowen, Reference Richardson and Cowen2004). Due to the difficulties of finding particular species of larvae in open ocean plankton sampling, only three specimens of larval E. saurus and one specimen of larval A. vulpes were collected. The fragile larvae were dead upon surfacing of the net and were immediately placed in the appropriate fixative solution (below), and identified according to taxonomic keys (Böhlke, Reference Böhlke1989).
Specimens, measurements, and calculations

Standard length (SL) and lens diameters in mm, visual acuity is minimum separable angle in degrees, rod (R) or cone (C) to ganglion cell (G) ratios presented as mean of entire retina, and number of specimens for histological analysis (N).
Settlement-stage E. saurus, A. vulpes, and M. punctatus were captured by moored plankton net during nighttime flood tides entering the Indian River Lagoon, Sebastian Inlet, FL, as previously described (Shenker et al., Reference Shenker, Maddox, Wishinski, Pearl, Thorrold and Smith1993; Taylor & Grace, Reference Taylor and Grace2005). Live specimens were identified under dim red LED light (to keep eyes in a dark-adapted state), then immediately euthanized in a solution of 100 mg/l tricane methanesulphonate (MS-222) and placed into the appropriate fixative solution.
Juvenile E. saurus were collected from impounded mangrove marshes adjacent to the Indian River Lagoon in Brevard County, FL by seine net and hook-and-line fishing. Juvenile A. vulpes were collected by seine net from clear water less than 1 m deep along sandy beaches of Key Biscayne, FL and from the Rookery Bay Research Reserve near Naples, FL. M. punctatus glass eels were collected as described above for settlement-stage larvae. Glass eels are characterized as the eel life history stage immediately following metamorphosis when the laterally flattened leptocephalus becomes shorter, body depth decreases, the body is mostly unpigmented, and individuals begin burrowing in sediment (Able et al., Reference Able, Allen, Bath-Martin, Hare, Hoss, Marancik, Powles, Richardson, Taylor, Walsh, Warlen and Wenner2011). For histology, juvenile specimens were returned alive to the laboratory and euthanized in a solution of 500 mg/l MS-222, prior to the eyes being enucleated. Glass eels were processed as described above for settlement-stage larvae.
Adult E. saurus were collected at night by hook-and-line at Sebastian Inlet, FL. Adult A. vulpes were collected during the day by hook-and-line from shallow waters (<2 m depth) off Key Biscayne, FL. Limited availability of adult fish and the challenge of processing and plastic-embedding large adult eyes allowed quantitative analysis of only one specimen each of adult E. saurus and A. vulpes. Adult M. punctatus were captured by dip net at Sebastian Inlet, FL during outgoing nighttime tides. Adults were deeply anesthetized in the field with 1% MS-222 being applied directly to the gills, prior to decapitation and enucleation.
Tissue preparation and histology
Specimen preparation and histology methods were previously described (Taylor et al., Reference Taylor, Loew and Grace2011a; Taylor et al., Reference Taylor, Loew and Grace2011b). Briefly, for light microscopy and transmission electron microscopy (TEM), tissues were embedded in Durcupan ACM epoxy resin (Electron Microscopy Sciences, Hatfield, PA) and sectioned on a Leica ultramicrotome at ca. 1.0 µm or 70 nm, respectively. For opsin immunohistochemistry, tissues were infiltrated in 20% sucrose, then embedded frozen in OCT medium and sections (ca. 16 µm) prepared on a Leica cryostat. For larval and settlement-stage individuals (and glass eels), whole heads were serially sectioned in the dorso-ventral plane, and imaging was done on the center of the eye to produce radial sections of the retina. For juvenile and adult retinas, eyecups were cut into quadrants before embedding, and radial retinal cross-sections cut in the dorsal, ventral, nasal, and temporal regions.
Immunohistochemistry
Information about antibodies used in this study is summarized in Table 2. For opsin immunohistochemistry, slides were incubated for 8 h at room temperature with polyclonal rabbit anticone opsin (CERN-906; 1:1000; gift from W.J. DeGrip; University of Nijmegen, Netherlands) and/or mouse monoclonal antirhodopsin mab5316 (1:500; Millipore). Antibody dilutions and labeling procedures were performed as previously described (Taylor et al., Reference Taylor, Loew and Grace2011a; Taylor et al., Reference Taylor, Loew and Grace2011b). CERN-906 was raised in rabbit against chicken cone opsin CF II (Foster et al., Reference Foster, Garcia-Fernandez, Provencio and DeGrip1993) and is highly specific for retinal cone photoreceptors in chick (Rothermel & Layer, Reference Rothermel and Layer2001), green anole [Anolis carolinensis (Foster et al., Reference Foster, Garcia-Fernandez, Provencio and DeGrip1993)], Atlantic tarpon [Megalops atlanticus (Taylor et al., Reference Taylor, Loew and Grace2011a)], and several species of larval eels [Elopomorpha:Anguilliformes (Taylor et al., Reference Taylor, Loew and Grace2011b)]. The antirhodopsin mab5316 was raised by hyper-immunization of mice with rat rod outer segments and specifically labels rod photoreceptors in mammalian (Hicks & Barnstable, Reference Hicks and Barnstable1987; Xu & Tian, Reference Xu and Tian2008) and fish (Taylor et al., Reference Taylor, Loew and Grace2011a) retinas. Primary antibodies were omitted as controls (data not shown), and mutually exclusive, nonoverlapping labeling of specific photoreceptor outer segment types with mab5316 (rods) and CERN-906 (cones) demonstrates specificity.
Antibodies used in this study

For more detailed information, see Materials and Methods.
Quantification, statistics, and visual acuity
Cells were quantified in 1.0 µm radial cross-sections using standard light microscopy and digital imaging. For larval and settlement-stage fish, rod, cone, and ganglion cell nuclei were quantified in each of three retinal regions (dorsal, center, and ventral), within 2–3 (depended on retina size) randomly chosen 0.05 mm strips of retina in each region. Data were collected from a single cross-section with the greatest lens diameter, corresponding to the center of the retina. In juvenile and adult specimens, cells were quantified in the dorsal, ventral, nasal, and temporal regions, within four 0.05 mm strips in each region. Statistical analyses were performed using one-way ANOVA followed by post-hoc Tukey's tests (95% CI). Previous work determined that the fixation procedure used here for TEM and light microscopy resulted in 18.0% shrinkage of isolated retinal tissue and 9.3% shrinkage of the lens (Taylor et al., Reference Taylor, Loew and Grace2011a). These shrinkage factors have been applied to all cell counts and lens diameters to allow accurate comparisons with other studies using different fixation protocols.
For comparison of visual discrimination, theoretical visual acuity was calculated according to the following formula (Lara, Reference Lara2001), and expressed as minimum separable angle (MSA)—the smallest visual angle at which two points can be discriminated as separate in degrees:
 $$a{\rm{\ }} = \left( {{c \mathord{\left/ {\vphantom {c {2.5{\rm{\ }}r}}} \right. \kern-\nulldelimiterspace} {2.5{\rm{\ }}r}}} \right) \times \left( {{{180} \mathord{\left/ {\vphantom {{180} \pi }} \right. \kern-\nulldelimiterspace} \pi }} \right)\quad {\rm{,}}$$
where a = MSA degrees, c = distance between centers of adjacent cones in mm, and r = radius of the lens in mm.
This formula is based on the assumption that cone density is the limiting factor determining acuity, but actual acuity can differ due to variables such as eye and lens shape and convergence of light information from photoreceptors to ganglion cells. Still, behavioral tests indicate that this calculation provides a reasonably accurate estimate of actual visual acuity (Job & Bellwood, Reference Job and Bellwood1996) and is used here as a relative comparison of acuity among species and life history stages. Calculated visual acuity values are listed in Table 1 for each species and developmental stage in which cone cells could be discriminated and counted using light microscopy.
MSP
MSP was used to characterize photoreceptor light absorption for one specimen each of settlement-stage E. saurus (30 mm SL) and M. punctatus (50 mm SL), juvenile E. saurus (118 mm SL) and A. vulpes (78 mm SL), and adult M. punctatus (290 mm SL). For MSP, settlement-stage fishes were collected, euthanized under dim red LED light, placed immediately into cold buffer (sodium/potassium phosphate, 6% sucrose, pH 7.2), and shipped on ice to Cornell University. Juvenile and adult fishes were collected and shipped alive to Cornell University for analysis. MSP techniques were previously described in detail (MacNichol, Reference MacNichol1986; Loew, Reference Loew1994; Taylor et al., Reference Taylor, Loew and Grace2011a).
Rearing eels in captivity
Glass eels of M. punctatus were captured by moored plankton net as described above and reared in captivity under either constant light or constant dark conditions for 120 days. Constant light was produced by two fluorescent 70 in., 85 W, cool white fluorescent tubes (Phillips FT2T12/N/HO) suspended 30 in. above the water surface. Light intensity at the water surface was measured at ∼1500 lux. Eels were reared in clear, plastic tanks without substrate to prevent burrowing. All eels were fed daily and 50% water changes performed weekly. Feeding and maintenance were performed under brief exposure to dim red LED light for the dark-reared group.
Digital image presentation
Contrast and brightness parameters were adjusted in all digital images presented in the following figures. Color channels were adjusted to produce magenta and green overlay images instead of red and green. Images were manipulated globally, solely to enhance clarity and interpretability of the data.
Results
Larval retinas are rod-dominated with a localized patch of cones
As in M. punctatus and other larval elopomorph species studied (Taylor et al., Reference Taylor, Loew and Grace2011a; Taylor et al., Reference Taylor, Loew and Grace2011b), antirhodopsin (rod-specific) immunoreactivity is predominant throughout the retina in larval E. saurus and A. vulpes (Fig. 1A–1F). Anticone immunolabeling is concentrated in the dorsal region and scattered in the central region of E. saurus (arrowheads, Fig. 1A and 1C) and A. vulpes (arrowheads, Fig. 1B and 1D) retinas, but is nearly absent from the ventral retina in both species (Fig. 1E and 1F). Sections of E. saurus specimens in the naso-temporal plane revealed a patch of anticone labeling in the mid-temporal retina in an area where antirod labeling is nearly absent (arrowheads, Fig. 1G). These results indicate that at the ages examined, the retinas of larval E. saurus and A. vulpes are rod-dominated with localized patches of cone cells.
Opsin immunohistochemistry showing the distributions of rod and cone opsins in the retinas of larval E. saurus and A. vulpes. (A,C,E) Antirod (magenta) and anticone (green, arrowheads) immunolabeling in the dorsal (A), central (C), and ventral (E) regions of the larval E. saurus retina. (B,D,F) Antirod (magenta) and anticone (green, arrowheads) immunolabeling in the dorsal (B), central (D), and ventral (F) regions of the larval A. vulpes retina. (G) Antirod (magenta) and anticone (green) immunolabeling in the naso(N)-temporal(T) plane of the larval E. saurus retina, with the cone-exclusive patch shown between the arrowheads. Scale bars = 0.05 mm.
Species-specific retinal specializations and new cone genesis occur during metamorphosis
With metamorphosis and the transition from oceanic to estuarine habitat (settlement), new and more pronounced retinal distinctions develop among elopomorph species. In settlement-stage E. saurus, rods and cones are present throughout the retina, with the highest rod density in the ventral region and the highest cone density in the dorsal region (Fig. 2A, 2D, 2G, and 2J). Furthermore, cone density is higher than rod density in all retinal regions (Fig. 2J), demonstrating that new cones have been rapidly added to the retina following the rod-dominated premetamorphic stage. In contrast, settlement-stage A. vulpes has a different photoreceptor arrangement, with the highest rod density in the dorsal and the highest cone density in the ventral retina (Fig. 2B, 2E, 2H, and 2K). Limited specimen availability prevented the use of rod and cone immunolabeling, but rods and cones can be clearly distinguished using light microscopy (Fig. 2B and 2E) and TEM (Fig. 2H). Cone outer segments (white arrowheads) are substantially smaller than rod outer segments (black-filled arrowheads) and are extended distally compared to rod outer segments in the dark-adapted retina. Rod densities are higher than cone densities (Fig. 2K), but the presence of cones throughout the retina indicates that new cones have been generated since the premetamorphic stage. In M. punctatus, antirod and anticone labeled photoreceptors can be distinguished immunologically (Fig. 2C and 2F) and with TEM (Fig. 2I) and are present throughout the retina. The high density of both antirod and anticone immunoreactive outer segments gives the appearance of co-localization at low magnification (yellow, Fig. 2C), but differentially labeled outer segments can be distinguished at higher magnification (arrowheads, Fig. 2F). However, rod and cone nuclei cannot be reliably distinguished with a light microscope and therefore could not be differentially quantified (Fig. 2L). Together, these data indicate that new cone genesis occurs in the elopomorph retina during metamorphosis, and that species-specific retinal specializations develop by the time of settlement.
Opsin immunohistochemistry, TEM, and light microscopy showing rod and cone distributions in settlement-stage retinas. (A,D,G) Settlement-stage E. saurus retina; (A) opsin immunohistochemistry showing the distributions of rods (magenta, black-filled arrowhead) and cones (green, solid white arrowhead) throughout the retina, and (D) focused on the ventral region; (G) TEM showing the rod and cone morphology in the ventral region. (B,E,H) Settlement-stage A. vulpes retina; (B) light micrographs showing overall retinal morphology and (E) rods (black-filled arrowheads) and cones (solid white arrowheads) in the ventral region; (H) TEM showing rod and cone morphology in the ventral retina. (C,F,I) Settlement-stage M. punctatus retina; (C) opsin immunohistochemistry showing the distributions of rods (magenta, black-filled arrowhead) and cones (green, solid white arrowhead) throughout the retina and (F) focused on the ventral region; (I) TEM showing rod and cone morphology in the ventral retina. (J,K,L) Rod (magenta) and cone (green) photoreceptor densities across retinal regions of settlement-stage E. saurus (J; n = 3; lowercase letters indicate significant differences among retinal regions, P < 0.05), A. vulpes (K; n = 1) and M. punctatus (L; n = 3). Rods and cones could not be distinguished in M. punctatus using light microscopy and all were quantified together (gray). Error bars represent standard deviation. Scale bars: A–F = 0.05 mm; G–I = 2.5 μm.
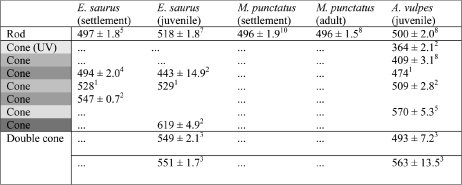
In settlement-stage (metamorphosing) E. saurus and M. punctatus, rod cells absorb maximally (λmax) at about the same wavelength (E. saurus 497 nm, M. punctatus 496 nm, Table 3; due to limited availability, settlement-stage A. vulpes could not be analyzed by MSP). E. saurus also has three spectrally distinct classes of single cones concentrated around middle wavelengths (λmax 494 nm; 528 nm; and 547 nm, Table 3). In M. punctatus, despite morphologically and immunologically distinct rod-like and cone-like photoreceptor subtypes, only a single spectral class of photoreceptor could be identified by MSP (λmax 496 nm). This suggests that spectral absorption characteristics of all M. punctatus photoreceptors are similar at this stage. These data demonstrate that at the time of settlement there are species-specific photoreceptor absorption spectra among elopomorphs.
λmax values for spectrally distinct photoreceptor classes among species and developmental stages
Colors represent the portion of the human visible spectrum for each single cone λmax value (nm). Error shown as standard deviation and superscripts indicate numbers of cells (n) measured for each photoreceptor class.
M. punctatus glass eels lose larval cones and add retinal area
Following metamorphosis from the larval to the glass eel stage, all M. punctatus photoreceptors have rod-like morphology and are labeled by antirhodopsin, and anticone immunolabeling is absent throughout the retina (Fig. 3A–3C). The morphologically identical rod-like photoreceptors, lack of cells with cone-like morphology by light microscopy (Fig. 3A) and TEM (Fig. 3C), and lack of anticone immunolabeling (Fig. 3B) suggest that by the glass eel stage, M. punctatus has lost all cones that were present at earlier stages. In addition to losing cones, M. punctatus develops a peculiar out-pocketing in the central retina that is small in younger glass eels (47 mm SL, Fig. 3D), but is prominent in older glass eels (48 mm SL, Fig. 3E) and is even more pronounced in eels that have been reared in captivity for 120 days postsettlement (50 mm SL, Fig. 3F; relative ages of eels are evident based on lens and eye diameter—note scale bars: Fig. 3D–3F). This out-pocketing is not evident at the adult stage, suggesting that it functions to increase retinal area in the small eyes of young eels.
Retinal morphology in M. punctatus glass eels. (A–C) Rod cells in wild-caught glass eels in a light micrograph (A), immunocytochemistry showing rods (magenta, black-filled arrowhead) but no cones (green) (B), and TEM showing only rods (black-filled arrowhead). (D–F) Development of the retinal out-pocketing (indicated by the white arrowheads) in a young glass eel (D), an older glass eel (E), and postsettlement eel after rearing for 120 days (F). Scale bars: A,B,D,E,F = 0.05 mm; C = 2.5 μm.
Juvenile and adult retinal specializations correlate with ecology
At the adult stage, when E. saurus, A. vulpes, and M. punctatus occupy distinct habitats and ecological niches, additional species-specific retinal specializations are present. Overall retinal organization is similar between juvenile and adult stages of a particular species, so data from these stages are presented together. At the juvenile and adult stages, E. saurus has short rod outer segments, approximately ¼ the length of A. vulpes and M. punctatus rod outer segments, that are grouped into discrete bundles of many members stacked into multiple layers (black-filled arrowheads, Fig. 4A–4C, cf. Fig. 4E–4G and 4I–4K). E. saurus also has a tapetum lucidum to reflect light back onto photoreceptors and increase photon capture (Somiya, Reference Somiya1980). Light-colored tapetal crystals are present within apical processes of the retinal pigmented epithelium (RPE), which surround the distal portions of cone outer segments and rod cell bundles (labeled “t,” Fig. 4A, 4C, and 4D). E. saurus also has higher rod cell densities than A. vulpes throughout the retina at the juvenile and adult stages (Fig. 4M and 4N). In comparison, A. vulpes (black-filled arrowheads, Fig. 4E–4H) and M. punctatus (black-filled arrowheads, Fig. 4I–4L) have longer rod outer segments that are stacked into multiple layers, but are not grouped into bundles, and they do not have a reflective tapetum. Additionally, rod-to-ganglion cell ratios in E. saurus are higher than in A. vulpes at the juvenile stage and higher than in A. vulpes and M. punctatus at the adult stage (Table 1), indicating greater convergence of light information on each ganglion cell in E. saurus. These results demonstrate that the E. saurus retina has several specializations for vision in low-light conditions, suggesting the highest scotopic visual sensitivity of the three species.
Photoreceptor arrangements and morphologies in juvenile and adult retinas. (A–D) The juvenile and adult E. saurus retina; rod (black-filled arrowheads) and cone (solid white arrowheads) photoreceptor arrangements shown in a light micrograph (A) and with rod (magenta) and cone (green) immunohistochemistry (B); rod (C) and cone (D) morphologies and clustered arrangements in TEM micrographs. The reflective tapetal layer is labeled (t). (E–H) The juvenile and adult A. vulpes retina; rod (black-filled arrowheads) and cone (solid white arrowheads) photoreceptor arrangements shown in a light micrograph (E) and with rod (magenta) and cone (green) immunohistochemistry (F); rod (G) and cone (H) morphologies shown in TEM micrographs. (I–L) The adult M. punctatus retina; rod (black-filled arrowheads) and cone (solid white arrowheads) photoreceptor arrangements shown in a light micrograph (I) and with rod (magenta) and cone (were not labeled by CERN906 antibody) immunohistochemistry (J); rod (K) and cone (L) morphologies shown in TEM micrographs, with distinct rod nuclei (rn) and cone nuclei (cn) labeled, cone outer segment indicated by solid white arrowhead and cone inner segment indicated by solid black arrowhead. (M–P) Rod and cone photoreceptor densities across retinal regions of juvenile (M,N) E. saurus (n = 3) and A. vulpes (n = 3), and in adult (O,P) E. saurus (n = 1), A. vulpes (n = 1), and M. punctatus (n = 3); error bars represent standard deviation. Asterisks and lowercase letters indicate significant differences among species (*P < 0.05). Scale bars: A,B,E,F,I,J = 0.05 mm; C,D,G,H,K,L = 2.5 μm.
Cone cell arrangements also differ among species. E. saurus cones are grouped and organized into clusters between wedges of reflective tapetum (white arrowheads, Fig. 4A, 4B, and 4D). A. vulpes has abundant cones that are arranged in a single continuous layer (white arrowheads, Fig. 4E, 4F, and 4H), while M. punctatus has widely spaced, morphologically distinct cone-like cells that are not labeled by the CERN906 anticone or mab5316 antirod antibodies (white arrowheads, Fig. 4I and 4L). These cells have morphological features typically associated with cones, including short, tapered outer segments (white arrowheads, Fig. 4L), wide inner segments with abundant mitochondria (solid black arrowheads, Fig. 4L), and elongate, distally positioned nuclei (cn) that stain lighter than rod nuclei (rn) and have distinct puncta of condensed chromatin (Branchek & Bremiller, Reference Branchek and Bremiller1984; Schmitt & Dowling, Reference Schmitt and Dowling1999; Fu et al., Reference Fu, Fang, Zou, Sun, Lathrop, Su and Wei2013). These cells are clearly distinct from the abundant rod photoreceptors that have elongate, nontapering outer segments (black-filled arrowheads, Fig. 4K and 4L), and round to ovoid, darker-staining, vitreally positioned nuclei (rn) with more uniform chromatin (Fig. 4L). This indicates that the M. punctatus adult retina has a morphologically and immunologically distinct cone-like photoreceptor subtype that is not present in larval and settlement-stage M. punctatus, suggesting that new cones are added to the retina after settlement. At the juvenile stage, A. vulpes has the highest cone density throughout the retina (Fig. 4O). In adults, however, cone cell densities do not differ between E. saurus and A. vulpes and remain significantly lower in M. punctatus (Fig. 4P). Cone-to-ganglion cell ratios are similar in E. saurus and A. vulpes at the juvenile and adult stages; M. punctatus has the lowest ratio (Table 1). Due to larger eyes and lens diameter, E. saurus has better photopic visual acuity than A. vulpes at the juvenile and adult stages (Table 1), despite the higher cone density in A. vulpes at the juvenile stage. Adult M. punctatus has comparatively poor photopic visual acuity (Table 1), due to small eye size and low cone density.
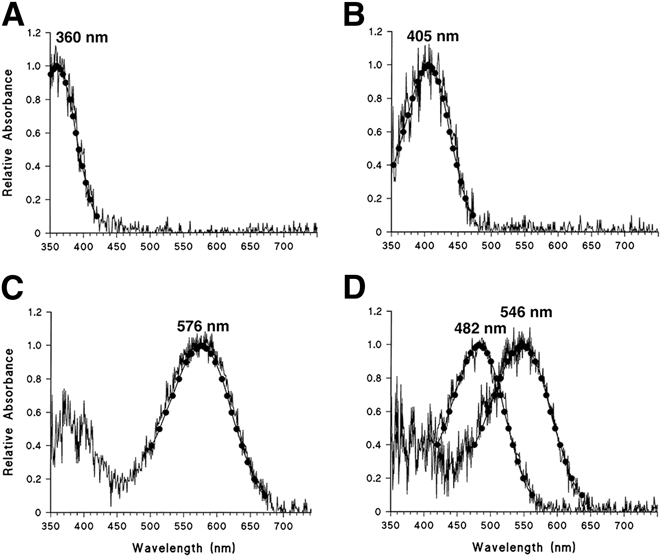
Photoreceptor absorption λmax values also differ among species, correlating with light availability in juvenile and adult habitats. E. saurus rod λmax shifts from a shorter (497 nm) to longer (518 nm) wavelength between settlement and juvenile stages (Table 3), corresponding to lower transmission of short wavelengths (Jerlov, Reference Jerlov1976; Shand et al., Reference Shand, Hart, Thomas and Partridge2002) in the turbid juvenile habitat. Additionally, juvenile E. saurus have a complex photopic system with three classes of single cones (λmax 443, 529, 619 nm), and an additional double cone with two elements of similar λmax (549, 551 nm) (Table 3). These λmax values are concentrated in the middle to long wavelength regions of the spectrum, again corresponding to the reduced transmission of shorter wavelengths in turbid water. In comparison, photoreceptor λmax values in A. vulpes are tuned to shorter wavelengths than in E. saurus, corresponding to the shorter wavelengths of light that are transmitted in clear water. A. vulpes has a rod λmax of 500 nm, five spectrally distinct classes of single cones (λmax 364, 409, 509, 570 nm), and a double cone with two distinct λmax values–493 and 563 nm (Fig. 5; Table 3). Finally, adult M. punctatus rods have a λmax of 496 nm, exactly the same as at the settlement stage. The small, morphologically distinct cone-like cells in adult M. punctatus could not be measured with MSP due to their rarity and small size compared to the overwhelming number of large rod cells in MSP preps. These results indicate a strong correlation between photoreceptor λmax values and the available spectrum of light in the habitat of each species.
MSP data for representative cone cells in juvenile A. vulpes meeting the selection criteria for template fitting (Loew, Reference Loew1994). The data points and curve are obtained using the Mansfield/MacNichol method by fitting the raw data to a vitamin A1-based template (MacNichol, Reference MacNichol1986). (A) UV cone, (B) short-wavelength single cone, (C) medium wavelength single cone, and (D) double cone. Numbers represent the λmax value for each cone type.
Light environment affects M. punctatus rod density, but does not modulate cone genesis
Despite the loss of larval cone photoreceptors during metamorphosis, M. punctatus develops new cone-like cells between the glass eel and adult stages (see above). Genesis of a new class of morphologically distinct cone-like cells during a well-defined developmental period provided an opportunity to test the hypothesis that light environment drives photoreceptor genesis. M. punctatus were reared in captivity under either constant light or constant dark conditions for 120 days after capture at the glass eel stage, to determine if exposure to extreme differences in the light environment can modulate photoreceptor development. All wild-caught glass eels that were not reared in captivity had only rod cells (Figs. 3A–3C and 6A). Strikingly, however, all eels reared in captivity for 120 days past the glass eel stage, regardless of the light condition, had morphologically distinct cone-like cells throughout the retina (Fig. 6A–6D), and cone-like cell density did not differ between light and dark treatments (Fig. 6A–6C). In contrast, rod cell density was lower in light-reared than dark-reared eels, with the greatest difference occurring in the dorsal retina (mean 24 rods/0.05 mm light vs. 44 rods/0.05 mm dark) (Fig. 6A). These data demonstrate that exposure of M. punctatus glass eels to very different exogenous light stimuli can modulate rod cell density, but does not modulate de novo cone-like cell genesis over the timeframe tested.
Rod and cone densities and retinal morphology in postsettlement M. punctatus reared 120 days in constant light or constant dark. (A) Rod and cone densities in the retinas of light and dark-reared eels, compared with wild-caught glass eels; *P < 0.05. (B) Light micrograph showing the light-adapted retina of light-reared eels; (C) light micrograph showing the dark-adapted retina of dark-reared eels; and (D) electron micrograph showing the morphology of cones in reared eels. Arrowheads and labels indicate the following: cone outer segments (white arrowheads); cone inner segments (solid black arrowheads); rod outer segments (black-filled arrowheads); melanin pigment (m); cone nuclei (cn); rod nuclei (rn); outer limiting membrane (olm). Scale bars B, C = 0.05 mm; D = 2.5 μm. Error bars indicate standard deviation; *P < 0.05.
Light or dark exposure also differentially affects rod and cone-like cell retinomotor movements. In light-adapted retinas of light-reared eels (Fig. 6B), all cone-like outer (white arrowheads) and inner segments (solid black arrowheads) are contracted vitreally along the outer limiting membrane (olm), rod outer segments (black-filled arrowheads) are extended distally, and melanin pigment (m) separates the rods and cone-like cells. However, in dark-adapted retinas of dark-reared eels (Fig. 6C), some cone-like outer (white arrowheads) and inner segments (black arrowheads) are extended distally while rod outer segments (black-filled arrowheads) are contracted vitreally, and all melanin (m) is concentrated distally behind the rods. These results demonstrate that the two photoreceptor types display retinomotor movements characteristic of rods and cones (Taylor & Grace, Reference Taylor and Grace2005).
Discussion
The data presented here show that, as in other species of elopomorph leptocephalus larvae (Taylor et al., Reference Taylor, Loew and Grace2011a; Taylor et al., Reference Taylor, Loew and Grace2011b), premetamorphic E. saurus and A. vulpes have rod-dominated retinas with a localized patch of cones in a species-specific location. Additional species-specific retinal differences develop as larvae metamorphose and transition to estuarine habitat, and in juveniles and adults, retinal specializations closely correlate with feeding behaviors and habitat light availability. Additionally, periods of rapid cone genesis occur in the elopomorph retina during and after metamorphosis, in stark contrast to the general teleost developmental model of a single primary wave of cone genesis in the early embryo (Otteson & Hitchcock, Reference Otteson and Hitchcock2003; Stenkamp, Reference Stenkamp2007). Further, the addition of new cone cells throughout the M. punctatus retina after the glass eel stage suggests a novel mechanism of cone cell genesis from retinal progenitor cells. Finally, extreme differences in the light environment do not alter this late cone genesis, but do alter rod distribution, suggesting that differences in the light environment can modulate some aspects of retinal development.
Ecological implications of a rod-dominated larval retina
Because of their fragility and relatively low concentrations in the open ocean, premetamorphic leptocephalus larvae are difficult to capture or study alive and therefore little is known about their ecology (Miller, Reference Miller2009). Thus, information about their visual capabilities inferred from retinal structure can provide important clues about how they may interact with the environment, including their ability to locate prey. Like other elopomorph species, E. saurus, A. vulpes, and M. punctatus begin life as pelagic leptocephalus larvae with rod-dominated retinas and a localized patch of cone cells [cf. (Taylor et al., Reference Taylor, Loew and Grace2011a; Taylor et al., Reference Taylor, Loew and Grace2011b)]. Based on the typical functions of rods and cones (Kefalov, Reference Kefalov2012), this retinal morphology suggests functionality in low-light conditions with relatively poor spatial acuity (based on rods), although the patch of cones likely allows higher photopic spatial acuity (but reduced light sensitivity) in a specific visual axis in line with the cones. The location of this patch of cones differs among species, suggesting differences in ecology that rely on optimal photopic acuity in distinct visual planes, and suggests that the extremely small size of leptocephalus eyes requires a spatial trade-off between rods and cones.
Late cone genesis and species-specific retinal changes during metamorphosis
As leptocephalus larvae undergo metamorphosis and transition from an open-ocean to an estuarine environment, new cones are added to the retina, eliminating the rod-exclusive regions seen in larvae. In all three species studied here, cones are present throughout the retina at the settlement-stage, and in E. saurus, cones outnumber rods in all retinal regions. This differs from the typical pattern of teleost retinal development in which most cones develop during an embryonic wave of photoreceptor genesis, and most subsequent photoreceptor genesis involves the insertion of new rods between existing cones as the retina grows (Hubbs & Blaxter, Reference Hubbs and Blaxter1986; Evans & Fernald, Reference Evans and Fernald1990; Evans & Fernald, Reference Evans and Fernald1993; Evans et al., Reference Evans, Hárosi and Fernald1993; Hitchcock et al., Reference Hitchcock, Ochocinska, Sieh and Otteson2004; Hitchcock & Raymond, Reference Hitchcock and Raymond2004; Stenkamp, Reference Stenkamp2007, Reference Stenkamp2011). This novel developmental paradigm in elopomorphs of late cone addition to the retina might reveal new mechanisms of vertebrate photoreceptor genesis.
Although rods and cones are present throughout the retina, their distributions differ among elopomorphs at the time of settlement. In E. saurus, cone density is highest in the dorsal retina and rod density is highest in the ventral, while A. vulpes has the opposite photoreceptor arrangement. During the same period, M. punctatus has antirod and anticone labeled photoreceptors throughout the retina with no regional specializations. The observations that the photoreceptor arrangements in settlement-stage larvae are not maintained at the juvenile stage suggest that they serve specific purposes such as detecting prey.
Following metamorphosis from larvae, anguilliform eels have a complex developmental strategy that involves three morphologically and ecologically distinct stages (unpigmented glass eel, pigmented elver, and yellow eel), prior to becoming sexually mature adults (Jessop et al., Reference Jessop, Cairns, Thibault and Tzeng2008). The glass eel is, therefore, an early postlarval phase, and M. punctatus glass eels have retinal specializations that differ from both the larval and adult stages. In M. punctatus glass eels, all photoreceptors are morphologically rod-like, all are labeled by antirhodopsin, and anticone immunolabeling is absent from the retina. These observations suggest that cone cells of larval M. punctatus are lost from the retina during metamorphosis. Functionally, this suggests that M. punctatus glass eels lack photopic vision and the retina is adapted for nocturnal vision. The retinal out-pocketing that occurs in M. punctatus glass eels might be another adaptation to increase low-light visual sensitivity. This out-pocket increases total retinal area and the number of rod cells in the central region, presumably increasing the number of rods in the light path. This unusual morphology does not seem to persist in adults, suggesting that it is only required in early stages when the eyes are small and rod densities are lower.
Functional morphology of the retina as a predictor of ecology
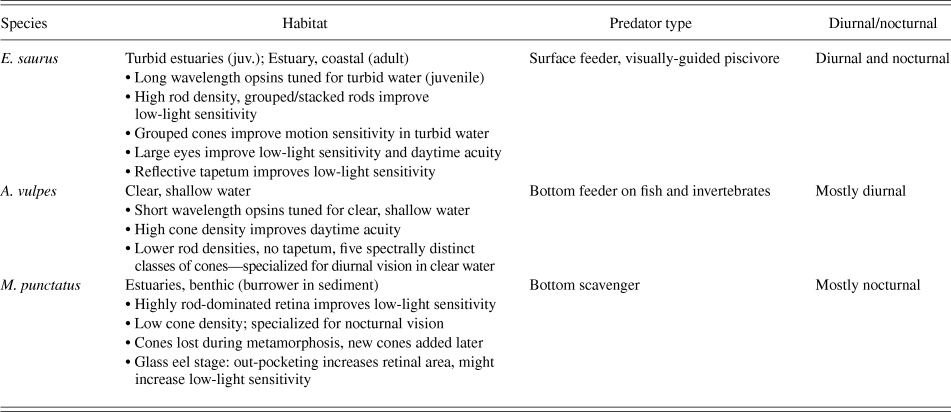
As elopomorphs transition into the juvenile and adult stages, additional retinal specializations develop that correlate with ecology (summarized in Table 4). Additionally, photoreceptor to ganglion cell ratios and theoretical visual acuity are indicators of visual capability (Pankhurst et al., Reference Pankhurst, Pankhurst and Montgomery1993; Shand, Reference Shand1994; van der Meer, Reference van der Meer1994; Shand, Reference Shand1997; Collin et al., Reference Collin, Hoskins and Partridge1998; Querubin et al., Reference Querubin, Lee, Provis and O'Brien2009; Taylor et al., Reference Taylor, Loew and Grace2011a), and both change substantially through ontogeny. E. saurus, for example, has several specializations that increase visual sensitivity in low-light conditions. These include a reflective tapetum, which reflects light back onto the retina to increase light sensitivity (Somiya, Reference Somiya1980), and grouped and stacked rod photoreceptors with a high rod:ganglion cell ratio, which pools light information from many rods to increase visual sensitivity in deep or turbid water (Somiya, Reference Somiya1980; Taylor et al., Reference Taylor, Loew and Grace2011a; Francke et al., Reference Francke, Kreysing, Mack, Engelmann, Karl, Makarov, Guck, Kolle, Wolburg, Pusch, von der Emde, Schuster, Wagner and Reichenbach2014). Cones are also grouped in E. saurus, which, as in the elephantnose fish Gnathonemus petersii (Kreysing et al., Reference Kreysing, Pusch, Haverkate, Landsberger, Engelmann, Ruiter, Mora-Ferrer, Ulbricht, Grosche, Franze, Streif, Schumacher, Makarov, Kacza, Guck, Wolburg, Bowmaker, von der Emde, Schuster, Wagner, Reichenbach and Francke2012; Pusch et al., Reference Pusch, Wagner, von der Emde and Engelmann2013), likely increases visual sensitivity, contrast detection, and motion sensitivity in turbid water. These characteristics are consistent with the observation that E. saurus is a visually guided predator that feeds on fast-moving prey in both day and night. In comparison, the A. vulpes retina has fewer specializations for low-light vision with lower rod density, lower rod:ganglion cell ratio, higher cone density, no bundling of photoreceptors, and no tapetum. These characteristics correspond with A. vulpes' clear, shallow water, high light habitat, and diurnal feeding activity. The adult M. punctatus retina, on the other hand, has a rod cell density similar to that of E. saurus, but rod:ganglion cell ratio and cone cell density are much lower, and photopic visual acuity is comparatively poor. This suggests that M. punctatus does not rely as heavily on vision and that the retina is adapted primarily for nocturnal activity.
Summary of ecological differences among juvenile/adult E. saurus, A. vulpes and M. punctatus, and corresponding retinal characteristics with predicted functional values
As ecology and retinal morphology change over ontogeny, corresponding shifts also occur in photoreceptor spectral absorption. Visual pigments can be changed, or tuned, over the course of development, corresponding to light availability in the environment (Hunt et al., Reference Hunt, Fitzgibbon, Slobodyanyuk and Bowmaker1996; Hunt et al., Reference Hunt, Dulai, Partridge, Cottrill and Bowmaker2001; Carleton, Reference Carleton2009; Taylor et al., Reference Taylor, Loew and Grace2011a). Three spectrally distinct cone classes are present in settlement-stage E. saurus, but between settlement and the juvenile stage, one class is lost (λmax 494 nm), two are gained (λmax 443 and 619 nm), and a double cone is added (λmax 549 and 551 nm). At the same time, the rod photoreceptor pigment shifts from λmax 497 to 518 nm. The loss of a cone and rod visual pigment with similar λmax values (494 and 497 nm) suggests that these pigments were useful to premetamorphic larvae in the open ocean, but not in the turbid estuarine settlement/juvenile habitat. Accordingly, peak light transmission in clear, oceanic water is slightly below 500 nm, while in turbid coastal water the peak shifts to longer wavelengths (Jerlov, Reference Jerlov1976). Similar shorter-to-longer wavelength absorption shifts occur in photoreceptors of Atlantic tarpon, Megalops atlanticus (Taylor et al., Reference Taylor, Loew and Grace2011a), and black bream Acanthopagrus butcheri (Shand et al., Reference Shand, Hart, Thomas and Partridge2002), both of which also transition from clearer high-light environments to turbid, tannin-stained waters. Data from A. vulpes and M. punctatus also indicate strong correlations between light environment and photoreceptor absorption. A. vulpes live in clear, shallow water where there is a broader spectrum of available light and greater short wavelength penetration. Accordingly, juvenile A. vulpes rods absorb at λmax 496, and two of its five spectrally distinct cone classes are tuned to substantially shorter wavelengths (λmax 360, 405 nm) than E. saurus. This is comparable to the visual pigments of coral reef fishes living in clear shallow water (Losey et al., Reference Losey, McFarland, Loew, Zamzow, Nelson, Marshall and Montgomery2003; Cheney et al., Reference Cheney, Newport, McClure and Marshall2013). Interestingly, settlement and adult M. punctatus rods have the same λmax as A. vulpes (496 nm), suggesting better functionality in clear oceanic waters. Accordingly, settlement-stage M. punctatus are transitioning from an open ocean environment, and adults return to the open ocean to spawn. These data demonstrate close relationships between photoreceptor spectral absorption and the light environment at a given developmental stage, shifting as necessary throughout the lifetime of a fish.
Effects of light environment on postembryonic photoreceptor genesis
During postembryonic retinal growth in teleosts, new cones are thought to only arise from stem cells in the circumferential marginal zone (CMZ) (Otteson & Hitchcock, Reference Otteson and Hitchcock2003; Hitchcock & Raymond, Reference Hitchcock and Raymond2004; Hitchcock et al., Reference Hitchcock, Ochocinska, Sieh and Otteson2004; Stenkamp, Reference Stenkamp2007). However, we demonstrate that the M. punctatus retina rapidly adds new cones throughout the retina after the glass eel stage. The CERN-906 antibody does not label these cone-like cells, suggesting that they express a different opsin than larval cones, but there are several pieces of evidence that distinguish these from rods and indicate that they are true cones. First, they are not labeled by antirhodopsin and are therefore distinct from rods in their opsin expression. Second, they are morphologically distinct from rods and have several cone-like characteristics (described in results). Third, rearing in constant light or dark affects rod density but not cone-like cell density (discussed below). Finally, the rods and cone-like cells undergo retinomotor movements typical of true rods and cones when in a dark versus light-adapted state (Fig. 6B and 6C; also see Taylor & Grace, Reference Taylor and Grace2005). These data indicate that after the glass eel stage, M. punctatus rapidly develops new cones throughout the retina (not just the retinal margin), suggesting that they arise from progenitors dispersed throughout the retina. Interestingly, a similar pattern might occur in the European eel, Anguilla anguilla, which has cones at the larval stage, loses these cones by the time of settlement (Omura et al., Reference Omura, Uematsu, Tachiki, Furukawa and Satoh1997), and then has cones again at later stages of development (Cottrill et al., Reference Cottrill, Davies, Semo, Bowmaker, Hunt and Jeffery2009). Previously, postembryonic cone cell addition to the central retina was thought to be possible only during injury-induced photoreceptor regeneration, from Müller glia that re-enter the cell cycle and act as intrinsic stem cells (Bernardos et al., Reference Bernardos, Barthel, Meyers and Raymond2007; Goldman, Reference Goldman2014; Lenkowski & Raymond, Reference Lenkowski and Raymond2014). The source of the new cone cells in the M. punctatus retina is unknown, but identifying their source might reveal a novel mechanism of vertebrate photoreceptor genesis.
New cone genesis in the M. punctatus retina after the glass eel stage provided an opportunity to test the effect of light environment on photoreceptor genesis. A previous study determined that extreme differences in the light environment (i.e., constant light vs. constant dark) do not influence the rate of photoreceptor genesis in the developing goldfish retina (Powers et al., Reference Powers, Bassi and Raymond1988). However, unlike elopomorph fishes, goldfish does not undergo substantial ontogenic shifts in photic habitat. The data presented here show that extreme differences in the light environment cannot modify the timing of cone genesis during the time period studied, but can affect rod cell densities. One possible explanation for the effect on rods is that chronic bright light exposure might induce rod cell death as it does in dorsal retina of albino zebrafish (Vihtelic et al., Reference Vihtelic, Soverly, Kassen and Hyde2006; Taylor et al., Reference Taylor, Chen, Luo and Hitchcock2012; Thomas et al., Reference Thomas, Nelson, Luo, Hyde and Thummel2012). However, M. punctatus glass eels have retinal melanin pigment (in contrast to albino fish), and light intensities used here (∼1500 lux) were much lower than those used in the zebrafish studies (∼10,000–20,000 lux). This suggests that the lighting paradigm was not sufficient for acute photoreceptor death, but we cannot rule out slow, chronic apoptosis. Other equally plausible explanations are that chronic light exposure reduced the rate of rod genesis, or that constant darkness increased the rate of rod genesis. These are all mechanisms through which the light environment might modulate retinal development, but further experimentation is necessary to determine the details of this relationship and the mechanisms involved.
Conclusions
The data presented here demonstrate that retinas of elopomorph fishes change dramatically through ontogeny, starting with similar rod-dominated retinas in larvae and then diverging among species with respect to ecology. Comparisons of retinal morphology and photoreceptor absorption provide important insights into the ecology of particular species such as nocturnal versus diurnal activity, predatory strategies, and light availability in the primary habitat. This study also provides evidence that, contrary to the traditional model, cone photoreceptor genesis occurs rapidly throughout the elopomorph retina during and after metamorphosis. Extreme differences in the light environment do not alter this late cone genesis, but do alter rod distribution. This suggests that light environment can modulate some aspects of retinal development.
Acknowledgments
This research was supported by Sigma Xi (Grants in Aid of Research) awarded to SMT. The authors thank Jonathan Shenker, David Carroll, John Morris, and Charles Bostater, Florida Institute of Technology, Melbourne, FL USA, for their expertise and intellectual contributions to this research. We thank Dr. Robert Cowen and crew, University of Miami, RSMAS, for allowing the collection of larvae aboard their vessel and providing equipment and expertise. We also thank W.J. DeGrip, University of Nijmegen, Nijmegen, The Netherlands, for kindly donating antibodies for immunohistochemistry. Finally, we thank Matthew Scripter, Florida Institute of Technology, Michael Larkin, University of Miami, and Pat O'Donnell, Rookery Bay National Estuarine Research Reserve, Naples, FL, for assistance with specimen collection.